0324
White matter shape and microstructure across the adult lifespan1Vanderbilt University Medical Center, Nashville, TN, United States, 2University of Pittsburgh Medical Center, Pittsburgh, PA, United States, 3Vanderbilt University, Nashville, TN, United States, 4National Institute on Aging, Baltimore, MD, United States
Synopsis
Here, we examine brain white matter diffusion magnetic resonance imaging data from a mixed longitudinal and cross-sectional dataset of 892 subjects and 1991 sessions of people aged 22.4-102.0 years from the Baltimore Longitudinal Study of Aging. Quantifying 7 microstructural features and, for the first time, 11 shape-based features across 49 white matter pathways, we document large age associations with white matter. Microstructure and shape measures are associated with age, although features of white matter shape do not show uniform trends across all pathways. Results from this study provide a comprehensive characterization of white matter pathways in the human brain.
Introduction
The white matter of the human brain undergoes significant changes throughout the lifespan. To understand changes related to normal aging, and differences due to disease, it is necessary to characterize how and where microstructure and connectivity varies with age. To date, a number of studies have used diffusion MRI to characterize microstructure, finding significant associations of diffusion tensor measures [1]and multi-compartment models [2]with age in a number of white matter (WM) pathways, and significant associations between these metrics across pathways [3]. However, the geometrical and connectivity features of these pathways has not been studied as a function of age.In this study, using a large mixed longitudinal and cross-sectional dataset from the Baltimore Longitudinal Study of Aging (BSLA), we quantify both microstructural and shape-based features across a large number of WM pathways, and investigate their individual relationship with age, and their relationship across pathways and features.
Methods
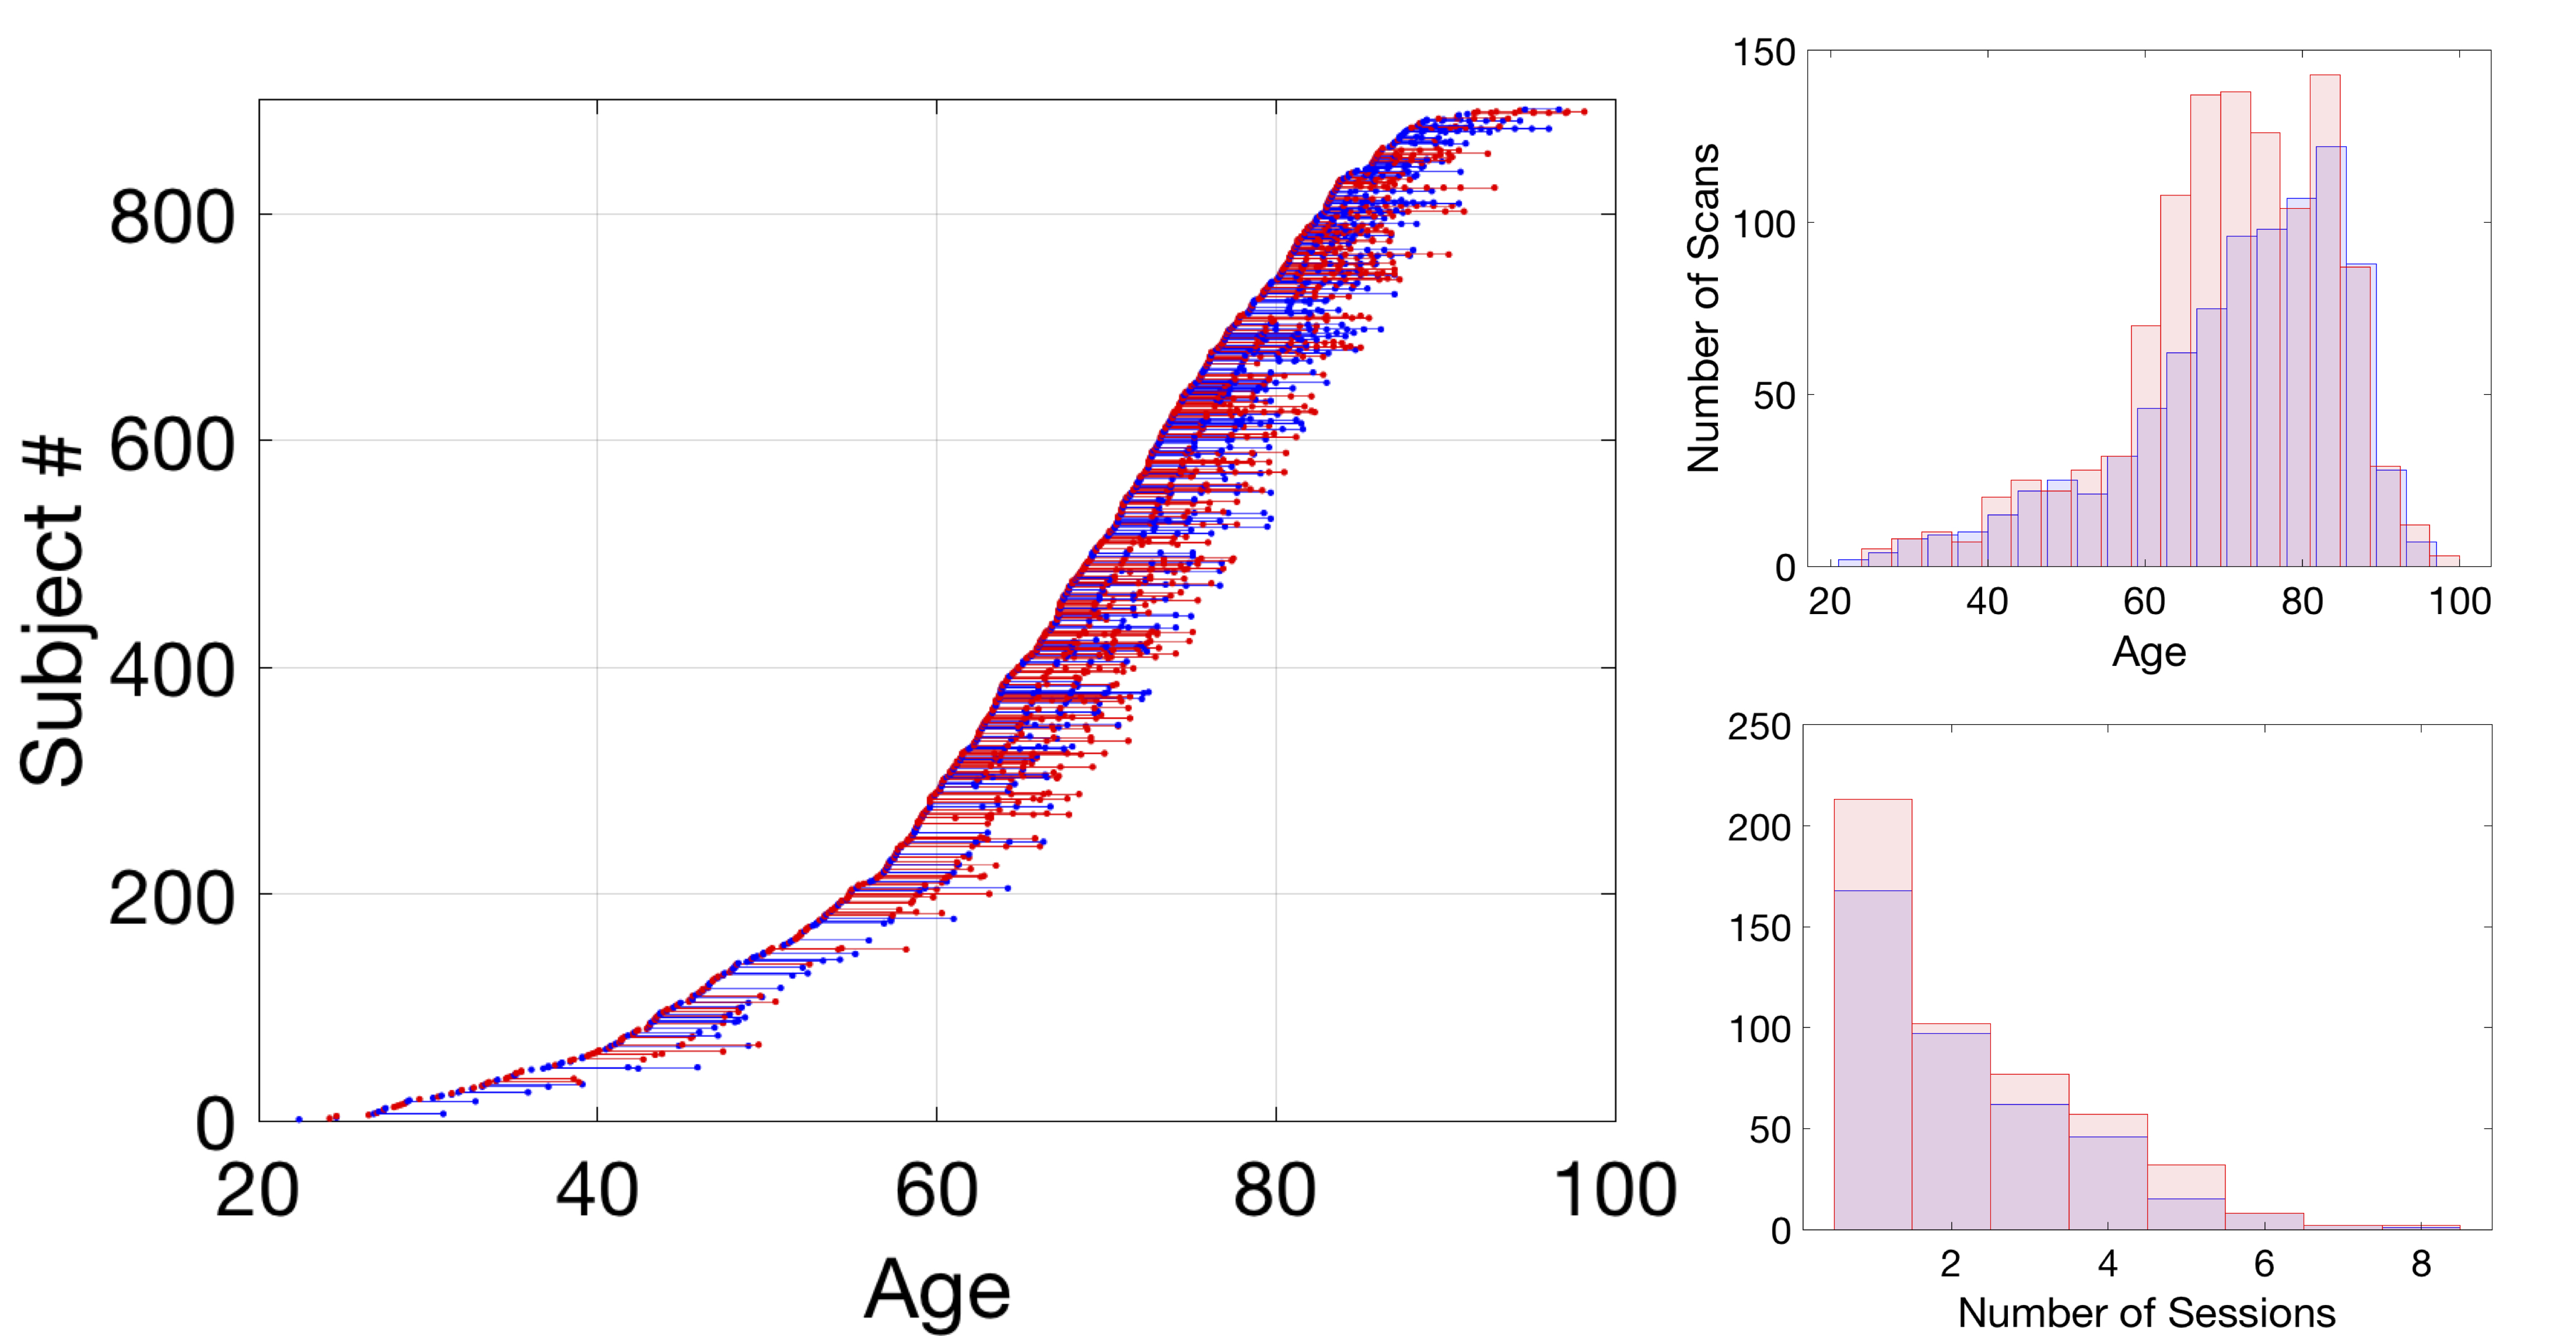
DataThis study uses data from participants in the BLSA dataset. Data is summarized in Figure 1, and includes, 892 subjects, with age range 22.4-102.0 years at time of scan. Subjects were scanned multiple times ranging from 1 and 8 sessions, with time between scans ranging from 1 to 10 years, yielding a total of 1991 diffusion datasets. Exclusion criteria included diagnoses of mild cognitive impairment, Alzheimer’s disease, or dementia at baseline, or if they developed these conditions during the follow-up interval.
MRI data was acquired on a 3T Philips Achieva scanner (32 gradient directions, b-value=700s/mm2, TR/TE=7454/75ms, reconstructed voxel size=0.81×0.81×2.2mm, reconstruction matrix=320×320, acquisition matrix=11× 115, field of view=260×260mm).
Processing
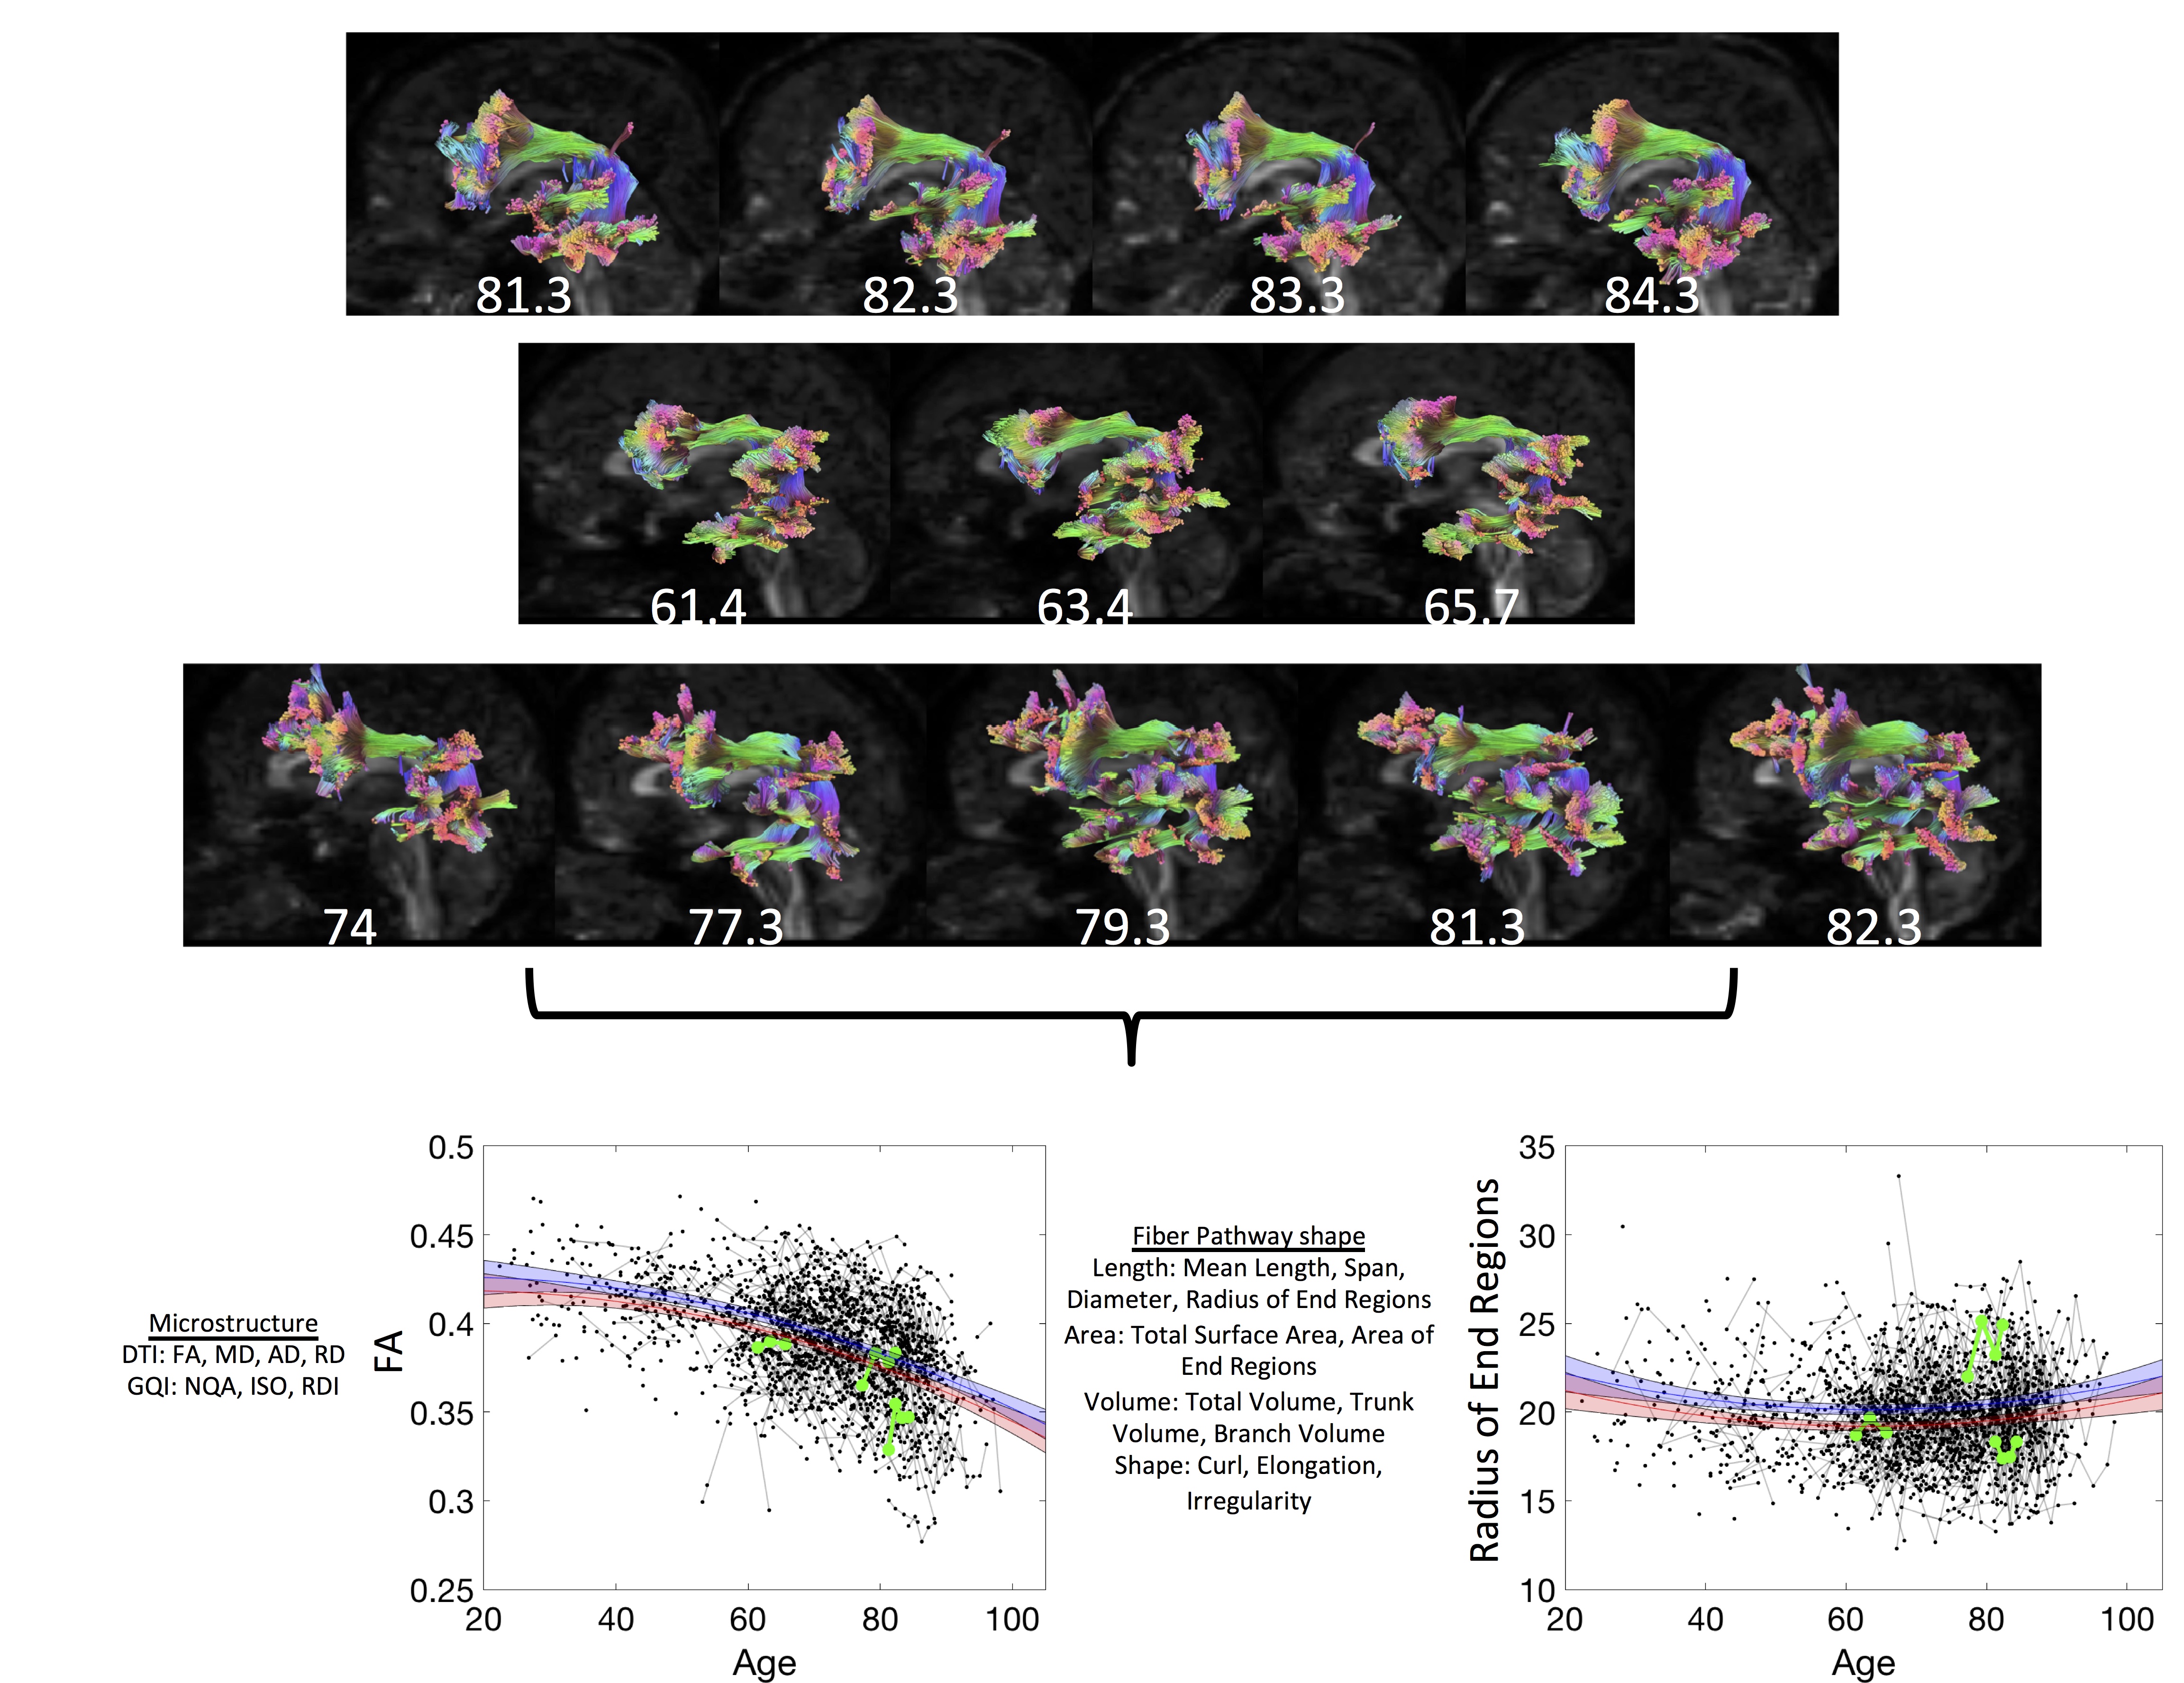
For every session, 49 WM pathways were virtually dissected using automatic track recognition [4]in the DSI Studio software. For each session, and every pathway, several features were extracted. 7 Microstructural features included DTI metrics of FA, MD, radial diffusivity (RD), and axial diffusivity (AD), and generalized q-space imaging features of normalized quantitative anisotropy (NMA), isotropic diffusion component (ISO), and restricted diffusion index (RDI). The 12 shape-based features extracted from each pathway (details described in [5]) are based on length (mean length and span, diameter, radius of end regions), area (total surface area, area of end regions), volume (total volume, trunk volume, branch volume), and shape (curl, elongation, irregularity). Figure 2 shows a qualitative visualization of the left arcuate fasciculus over time on 3 subjects, summarizes the features extracted for each pathway, and highlights these subjects in the plot over the sample across age.
Statistical analysis
To investigate the relationship between age and each WM feature, linear mixed effects (lme) analysis was performed, with each (z-normalized) feature, Y, modeled as a linear function of age, Y = A + B (AGE) + C(SEX), and quadratic function of age, Y = A + B (AGE) +C(AGE)^2 + D(SEX), where subjects were entered as a random effect. A likelihood ratio test was used for model selection, and all significance thresholds were set to p<0.05, with results corrected for multiple comparisons (49 pathwaysx19 features). Finally, normalized features and pathways were encoded into an agglomerative hierarchical cluster tree with clusters shown as a dendogram plot to visualize relationships between features or between pathways.
Results
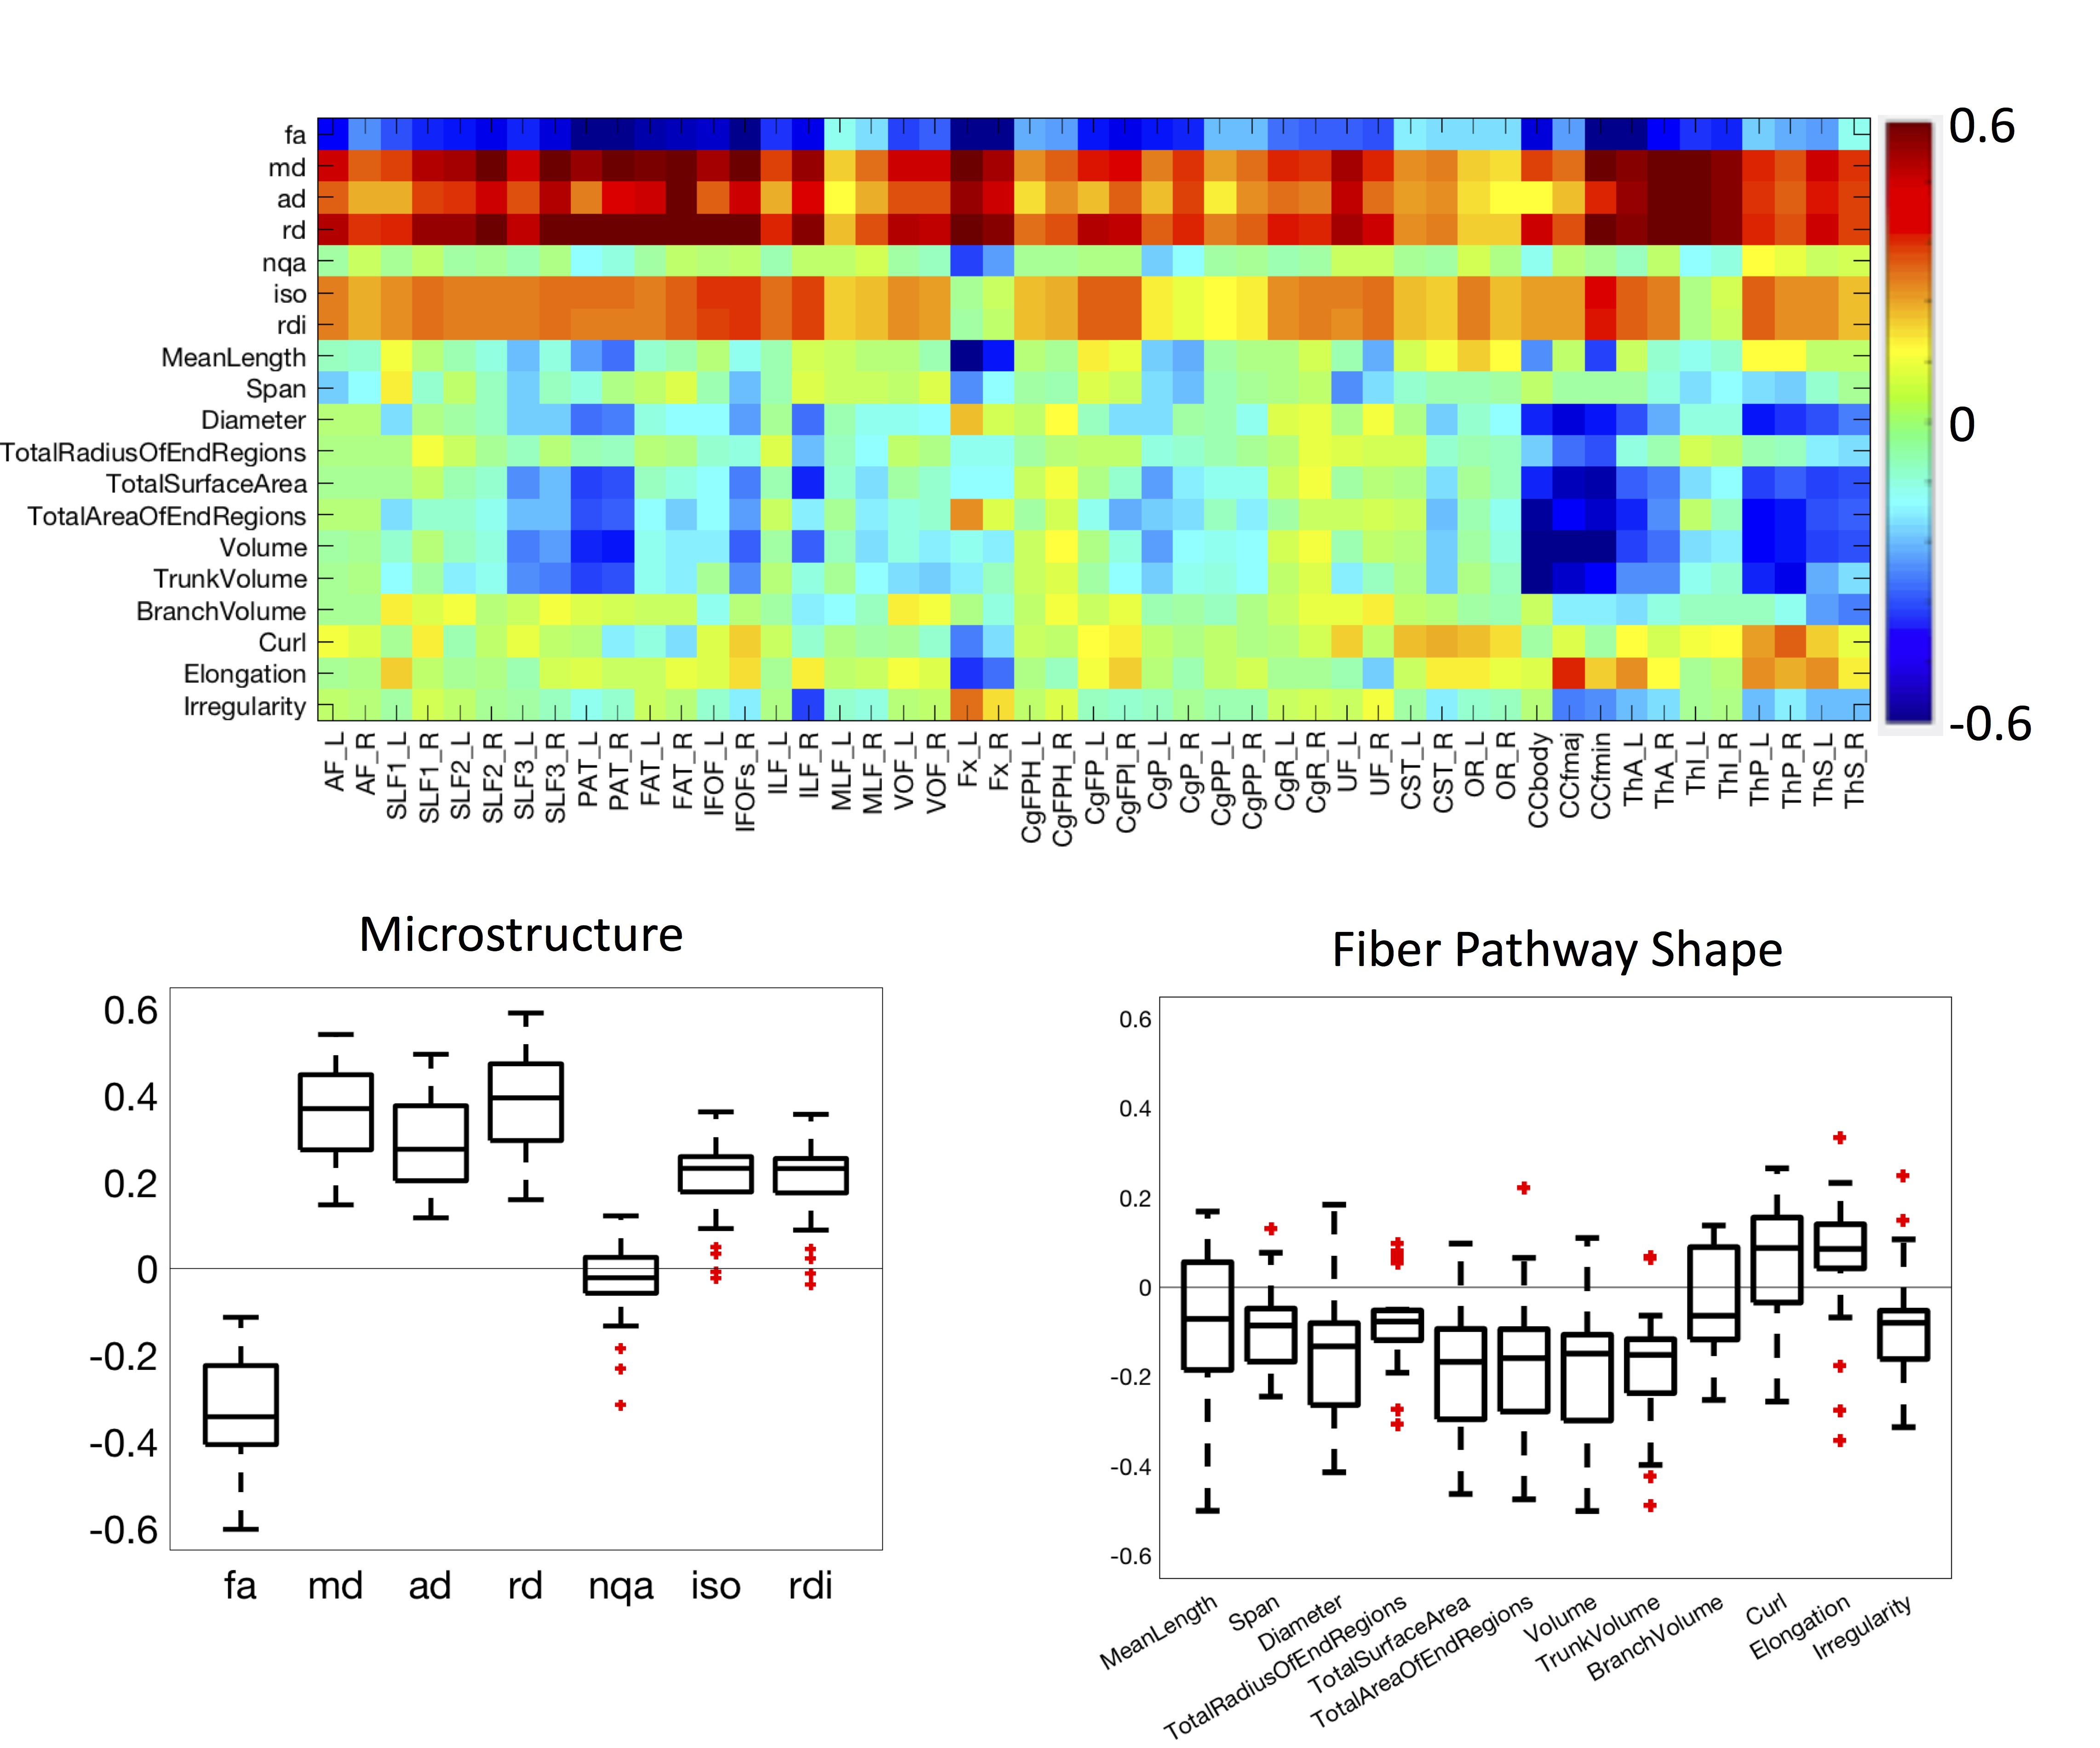
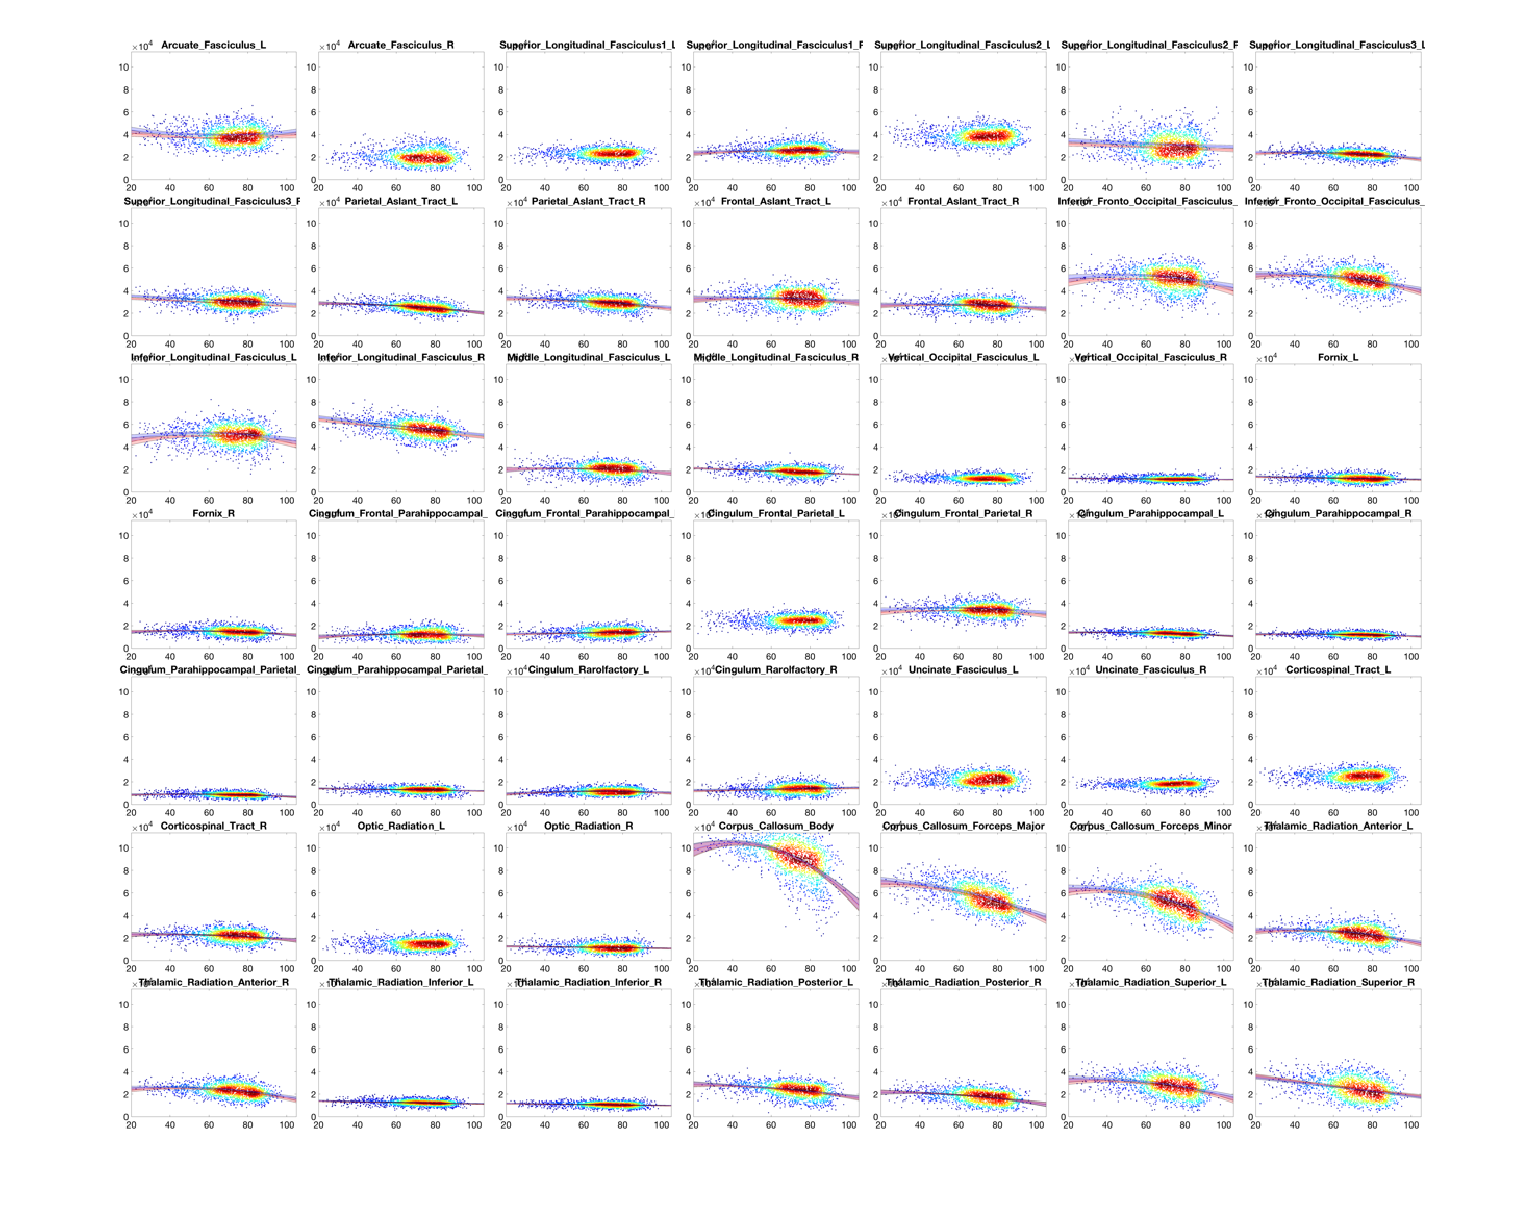
Figure 3 shows the beta regression coefficients for associations of each parameter with age. In agreement with literature, FA is negatively associated with age, while the diffusivity coefficients are positively associated with age. Features of connectivity show overall smaller correlations. Most indices of length and volume show small negative correlations with age, with the callosal fibers and thalamic fibers showing the largest correlations. Interestingly, curl and elongation tend to increase with age in several pathways.Despite smaller overall correlations with age, shape-features show variation specific to different pathways, i.e., indicate more heterogeneity across pathways than microstructure. As an example visualization, the overall total end surface area is plotted for all 49 pathways in Figure 4. Many show significant associations with age, with some indicating small changes, while others indicate large changes across time.
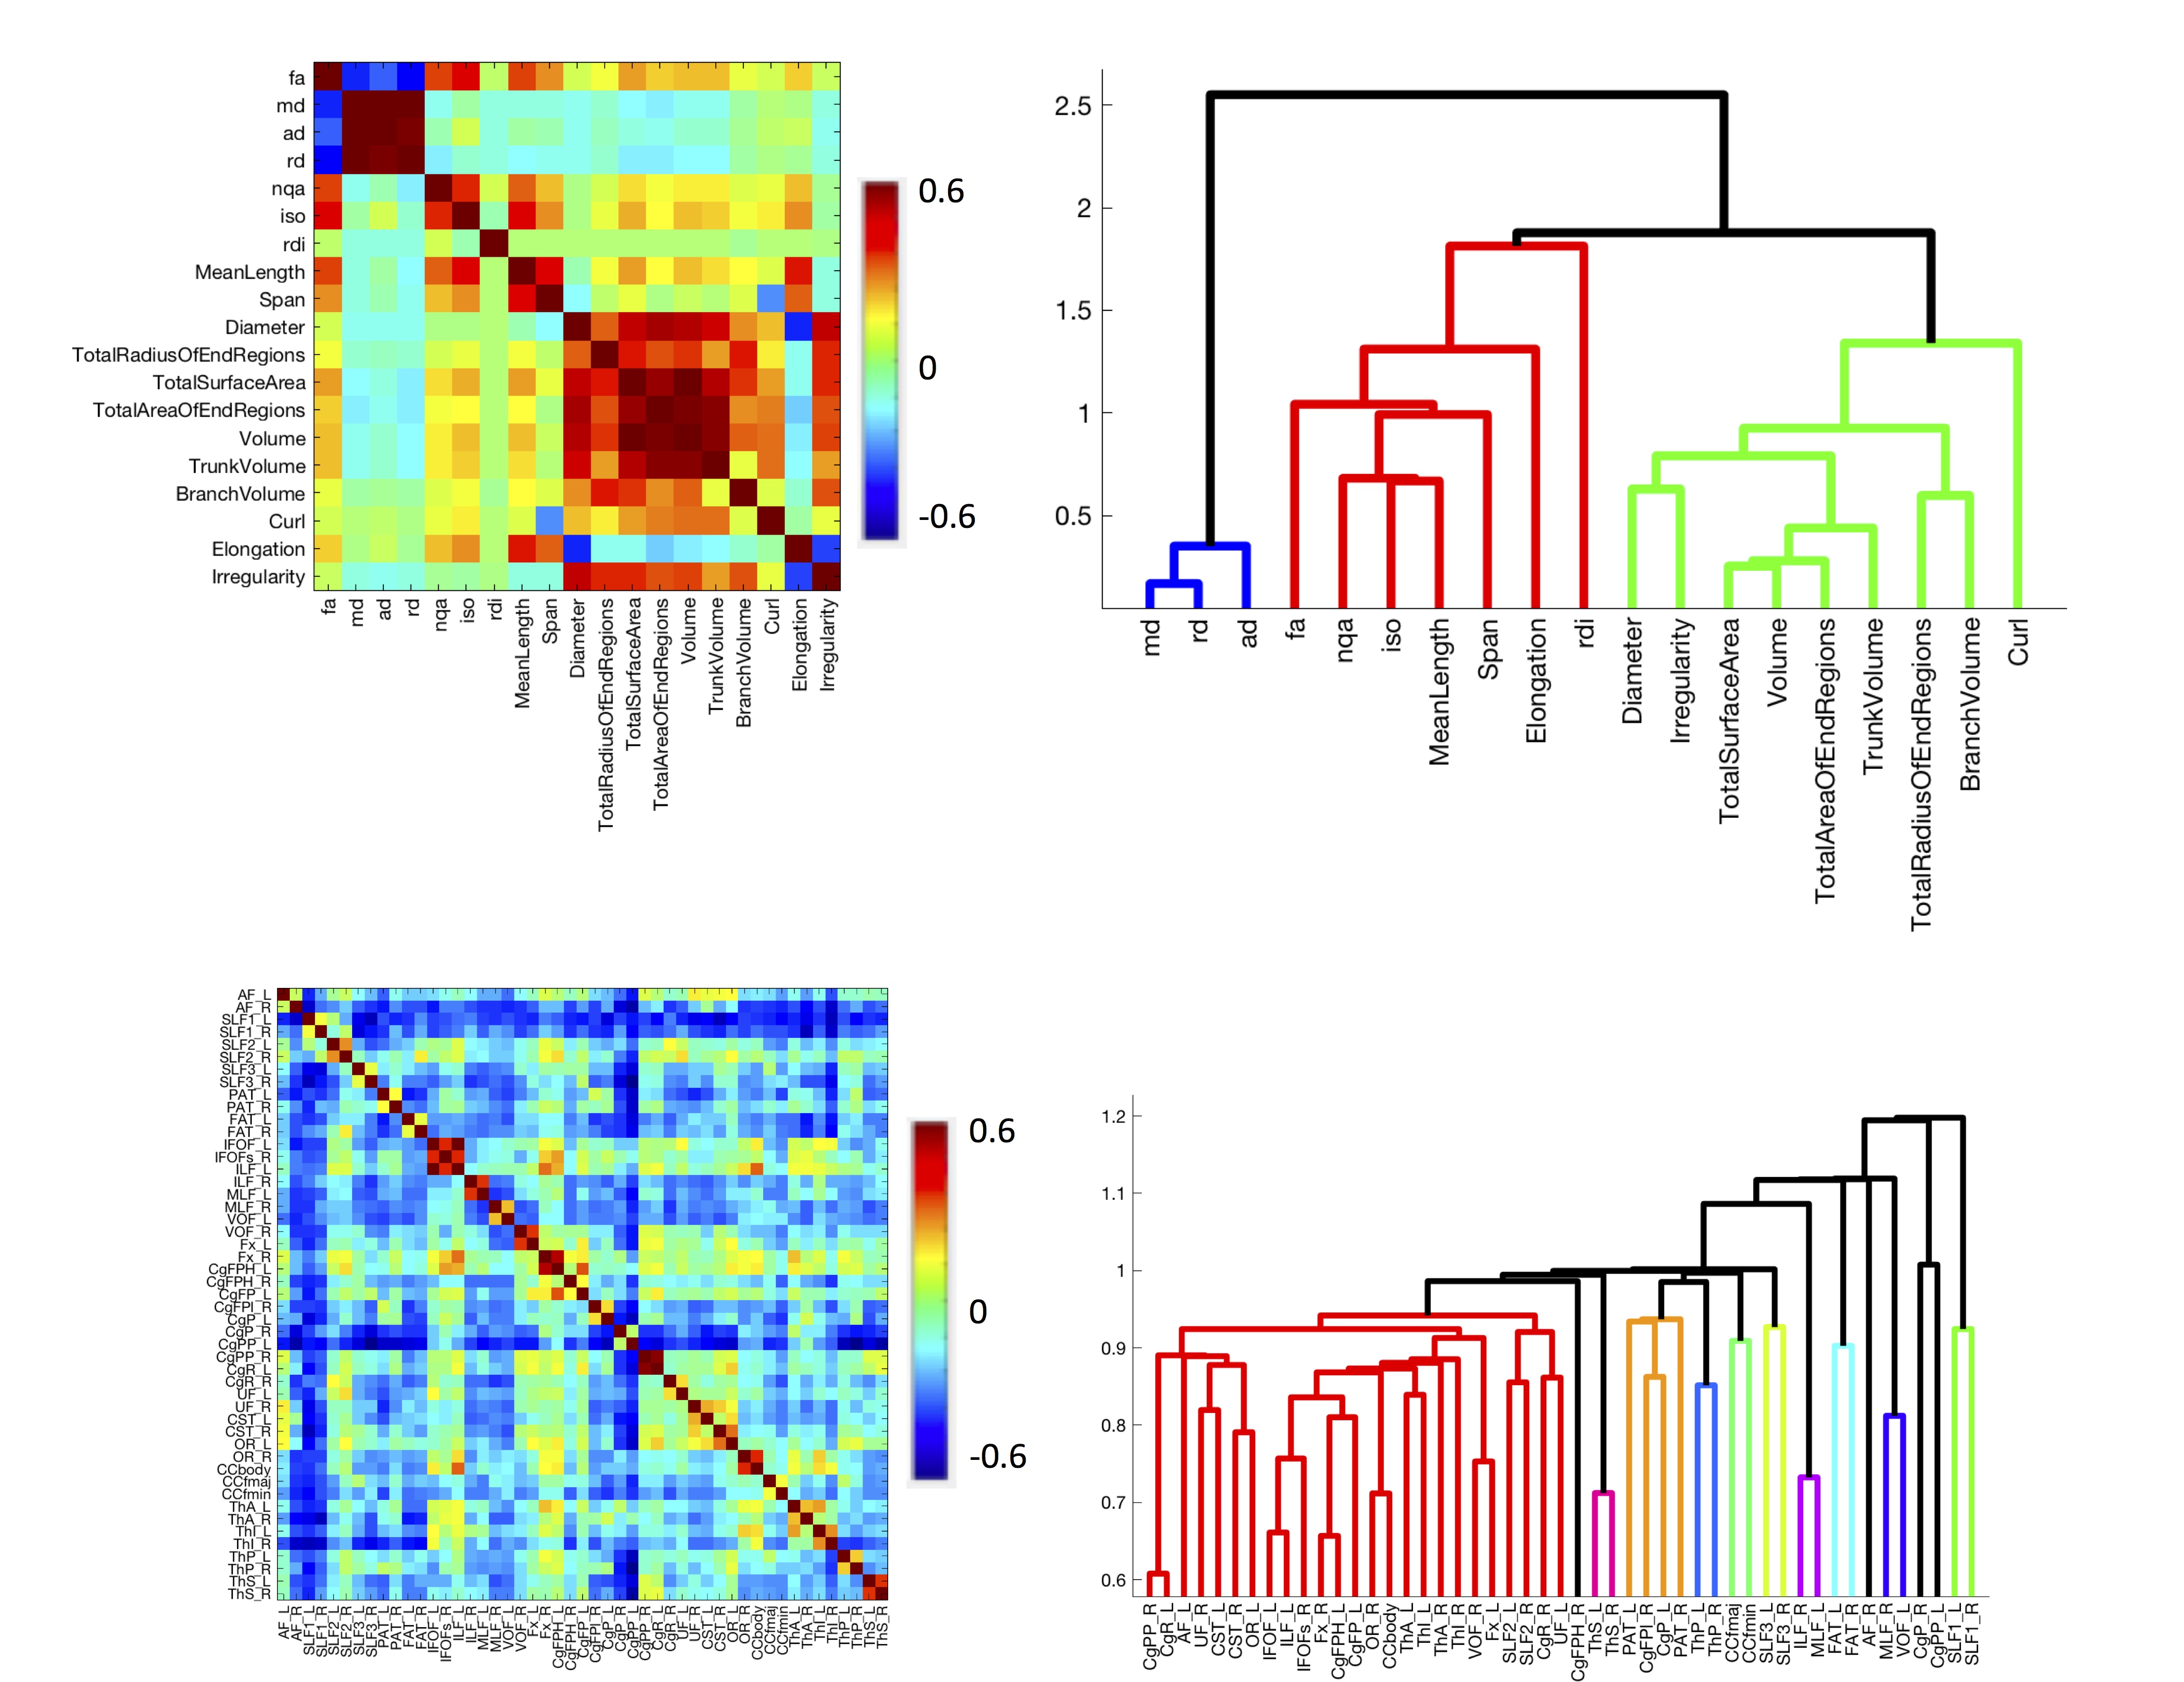
Correlation coefficients of features and clustering are shown in Figure 5. The correlation coefficient of variables were calculated against all other variables (over all pathways and subjects), while correlation coefficients of pathways were calculated against all other pathways (over all variables and subjects). FA is negatively correlated to diffusivity measures, and measures of volume and area are positively associated with other measures of volume and area. Similarly, MD, RD, and AD cluster together, while anisotropy measures are clustered (with mean length, span, and elongation). Most pathways cluster with their contralateral pathway at the lowest clustering level.
Discussion
Using a large, cross sectional and longitudinal dataset, we analyze microstructural features and, for the first time, shape-based features, of WM pathways across age. Microstructure features are most sensitive to age. Shape and geometry of pathways change significantly with age, showing non-uniform trends across pathways studied. Thus, these features may be more specific in identifying changes in age, or disease, compared to more homogenously distributed changes in FA and MD. This study provides comprehensive characterizations of associations of white matter pathways in the human brain, and may be useful for studying aging in a variety of diseases or abnormal conditions.Acknowledgements
This work was supported by the National Institutes of Health under award numbers R01EB017230 (B.A.L), and T32EB001628 (K.G.S.), and in part by VICTR VR3029 and the National Center for Research Resources, Grant UL1 RR024975-01. This research was conducted with support from the Intramural Research Program, National Institute on Aging, NIH. The content is solely the responsibility of the authors and does not necessarily represent the official views of the NIH.References
1. Lebel, C., et al., Diffusion tensor imaging of white matter tract evolution over the lifespan.NeuroImage, 2012. 60(1): p. 340-352.
2. Beck, D., et al., White matter microstructure across the adult lifespan: A mixed longitudinal and cross-sectional study using advanced diffusion models and brain-age prediction.NeuroImage, 2021. 224: p. 117441.
3. Cox, S.R., et al., Ageing and brain white matter structure in 3,513 UK Biobank participants.Nature Communications, 2016. 7(1): p. 13629.
4. Yeh, F.C., et al., Population-averaged atlas of the macroscale human structural connectome and its network topology.Neuroimage, 2018. 178: p. 57-68.
5. Yeh, F.-C., Shape Analysis of the Human Association Pathways.bioRxiv, 2020: p. 2020.04.19.049544.
Figures