0323
PVS enlargement preferentially influences regional cortical thickness across the normative lifespan1USC Mark and Mary Stevens Institute for Neuroimaging and Informatics, USC Keck School of Medicine, Los Angeles, CA, United States
Synopsis
Perivascular spaces (PVS) are an important structural feature of the glymphatic system. PVS enlargement is associated with impaired glymphatic functionality and has been observed in both normative aging and neurodegenerative disorders; however, it is unclear how white matter PVS alterations affect neighboring cortical morphology in cognitively normal subjects. In the present study, we explore the relationship between PVS enlargement and cortical thickness across the normative lifespan. We found PVS enlargement preferentially influences cortical thickness of frontal regions, and this association is observed in children, adults and the elderly.
Introduction
The glymphatic system consists of a network of brain vasculature that plays a critical role in waste clearance and tissue homeostasis [1]. Perivascular spaces (PVS) are a major component of the glymphatic system and consist of interstitial fluid-filled cavities that function as low-resistance pathways for CSF flow, enabling the influx of energy substrates and efflux of waste. Impairment of the brain clearance system can impede the removal of toxic substances from the brain and pathological PVS enlargement has been observed in a range of neurological and neurodegenerative disorders, such as AD [2], traumatic brain injury [3] and stroke [4]. Recently, we have also demonstrated that PVS enlargement is a feature of normative lifespan changes [5]. However, it is unclear if PVS changes in cognitively normal subjects reflect pathological alterations that influence neighboring brain tissue. The purpose of this study is to determine the relationship between PVS and cortical morphology across the normative lifespan. We utilize a neuroimaging processing workflow that automatically segments and quantifies PVS in white matter regions [6] to relate PVS content and cortical thickness in a large cohort that ranges from childhood to aging in the Human Connectome Project (HCP) Lifespan cohort.Methods
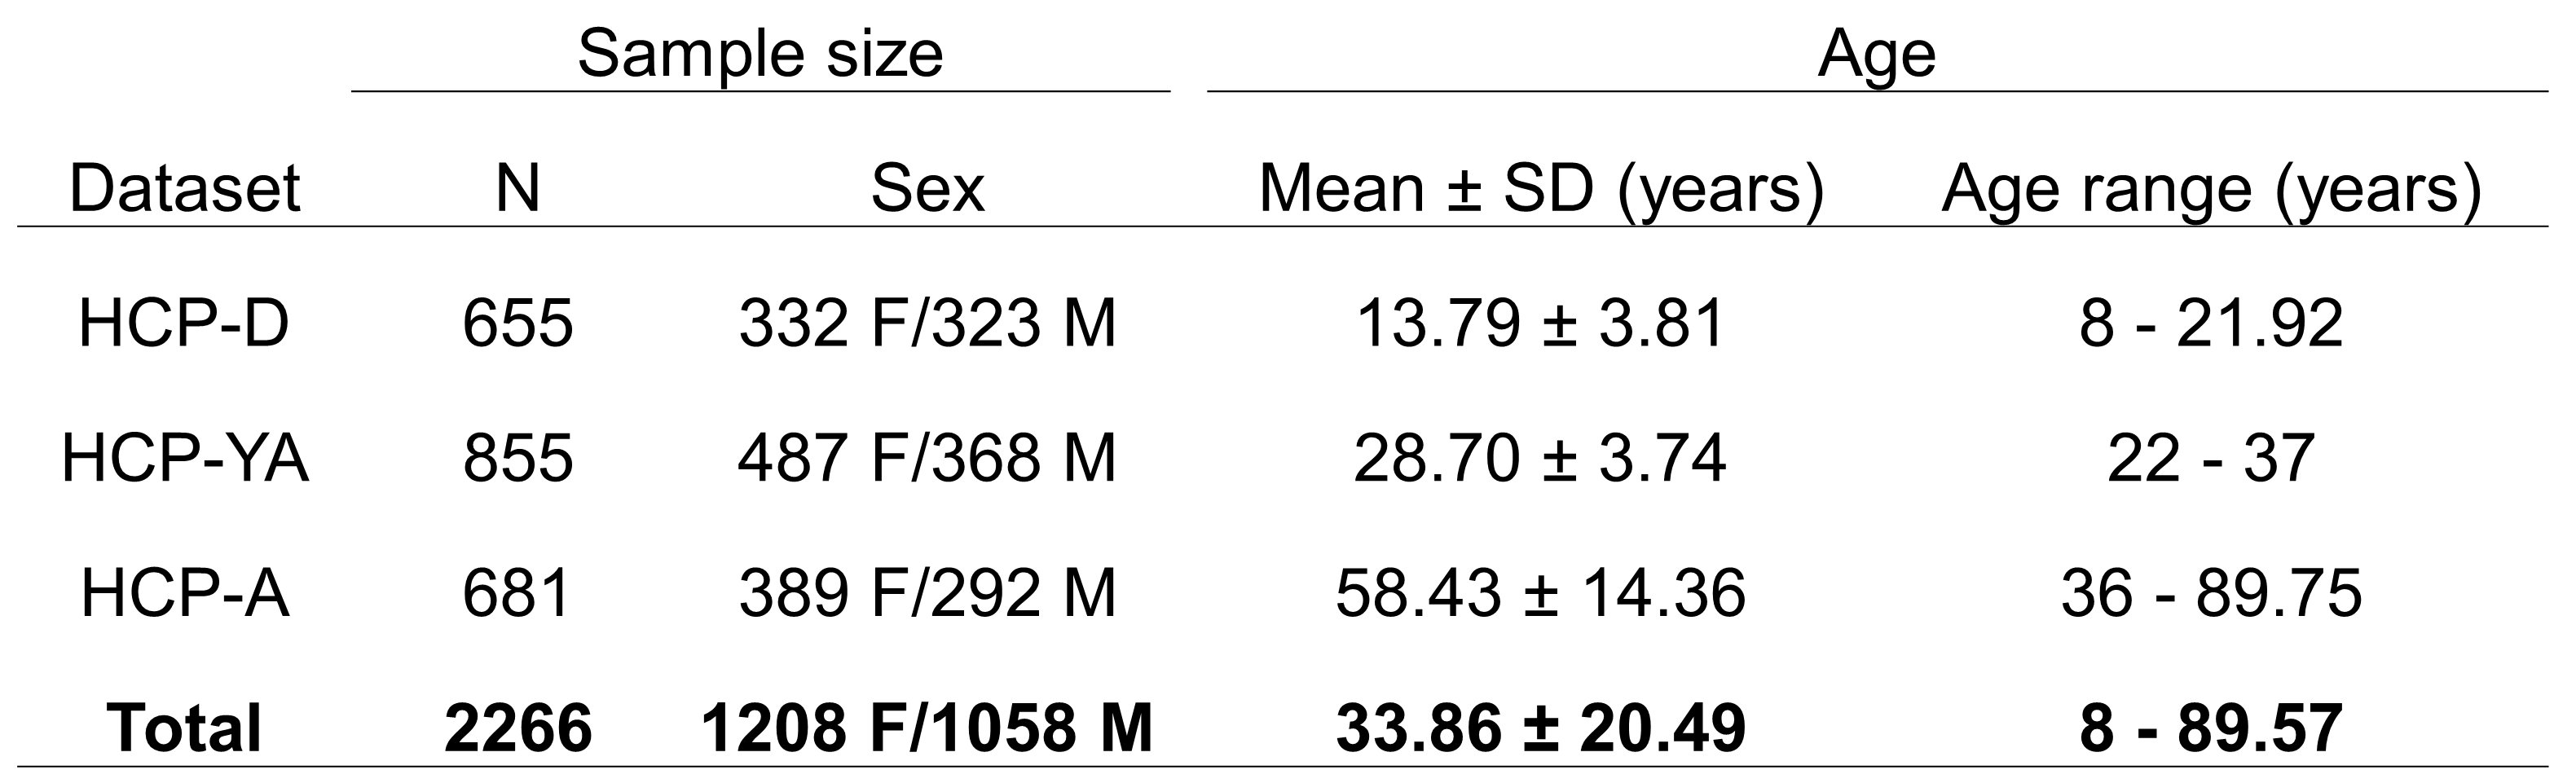
Neuroimaging data from 2266 cognitively normal subjects from 8 to 100 years were acquired through the Lifespan Human Connectome Project (HCP) and includes HCP Development (HCP-D), HCP Young Adults (HCP-YA), and HCP Aging (HCP-A) (Figure 1). High resolution T1-weighted (T1w) MPRAGE scans (voxel size: .7-.8 mm isotropic; FOV: 224x224 mm; TI: 1000 ms; TR/TE: 2400/2.14 ms) and T2-weighted (T2w-SPC) scans (voxel size: .7 mm isotropic; FOV: 224x224 mm; TR/TE: 3200/565 ms) were used for the present study. There were slight variations in the acquisition parameters for HCP-A and HCP-D to accommodate the unique challenges of working with young and elderly populations [7]. PVS segmentation was performed using the methods described in [6]. Structural MRI data was first preprocessed using the HCP pipeline [8]. Field bias correction, co-registration and non-local filtering were applied to the T1 and T2 weighted images, and we then calculated the T1 divided by T2 weighted image to generate the enhanced PVS contrast (EPC) [9]. Frangi filters were used to generate vesselness maps from the EPC and PVS were then automatically segmented and quantified using optimal thresholding based on expert reviewer manual segmentations. T1w images were parcellated into regional gray and white matter regions using Freesurfer (http://surfer.nmr.mgh.harvard.edu/). The PVS volume fraction for each white matter region was calculated by dividing the PVS volume by the white matter volume. General linear models were used to determine the relationship between cortical thickness and the underlying PVS volume fraction with age as a covariate of no interest. Multiple comparison correction was carried out using Bonferroni significance thresholding across 28 cortical regions in each hemisphere, resulting in 56 statistical tests (p<.00089).Results
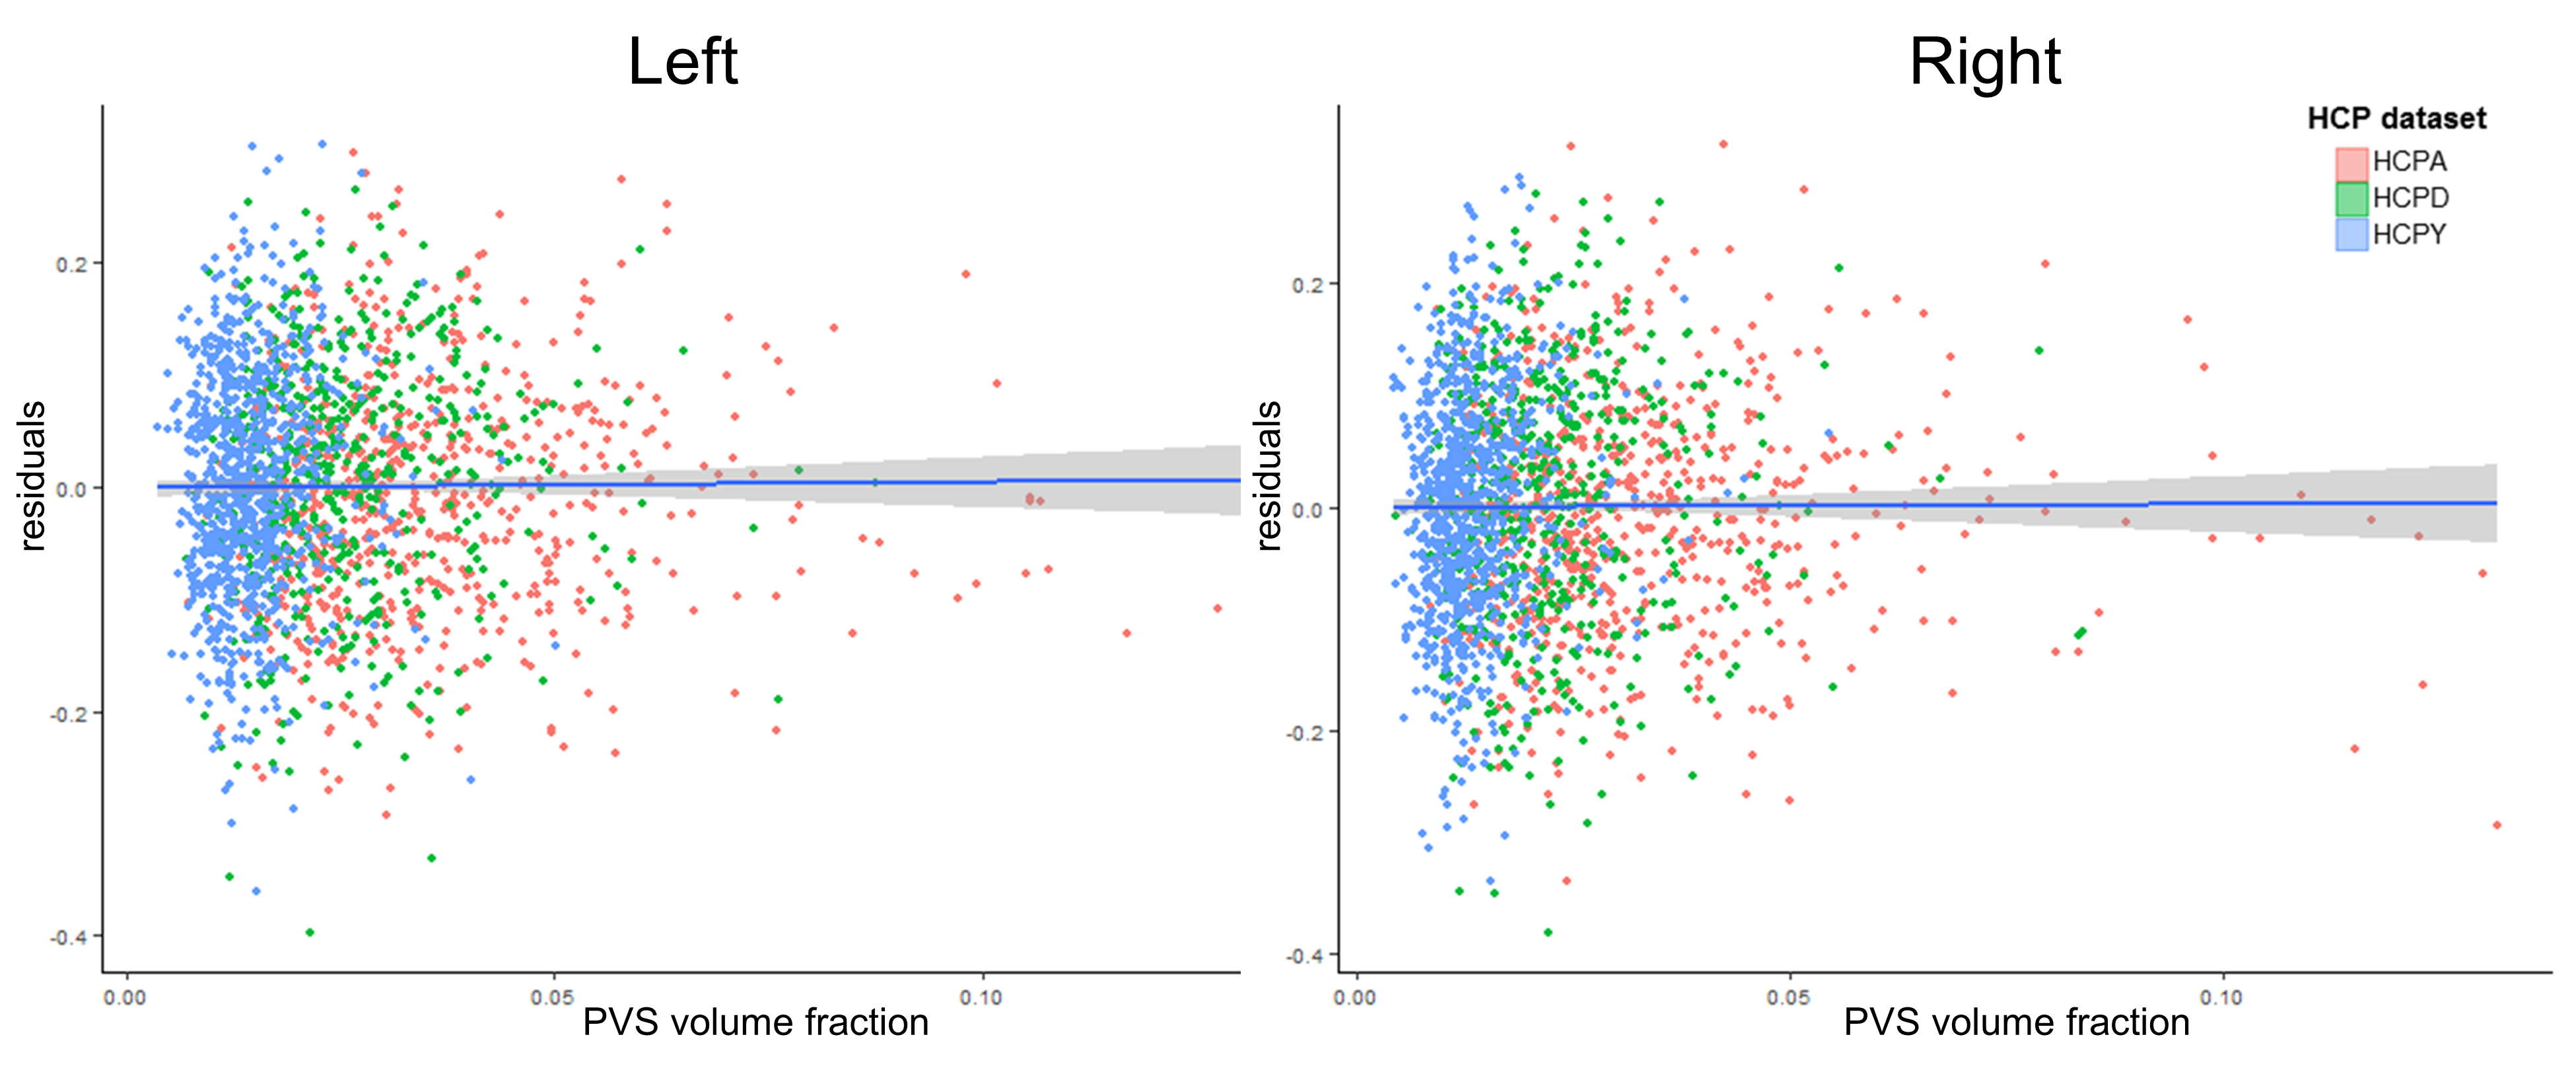
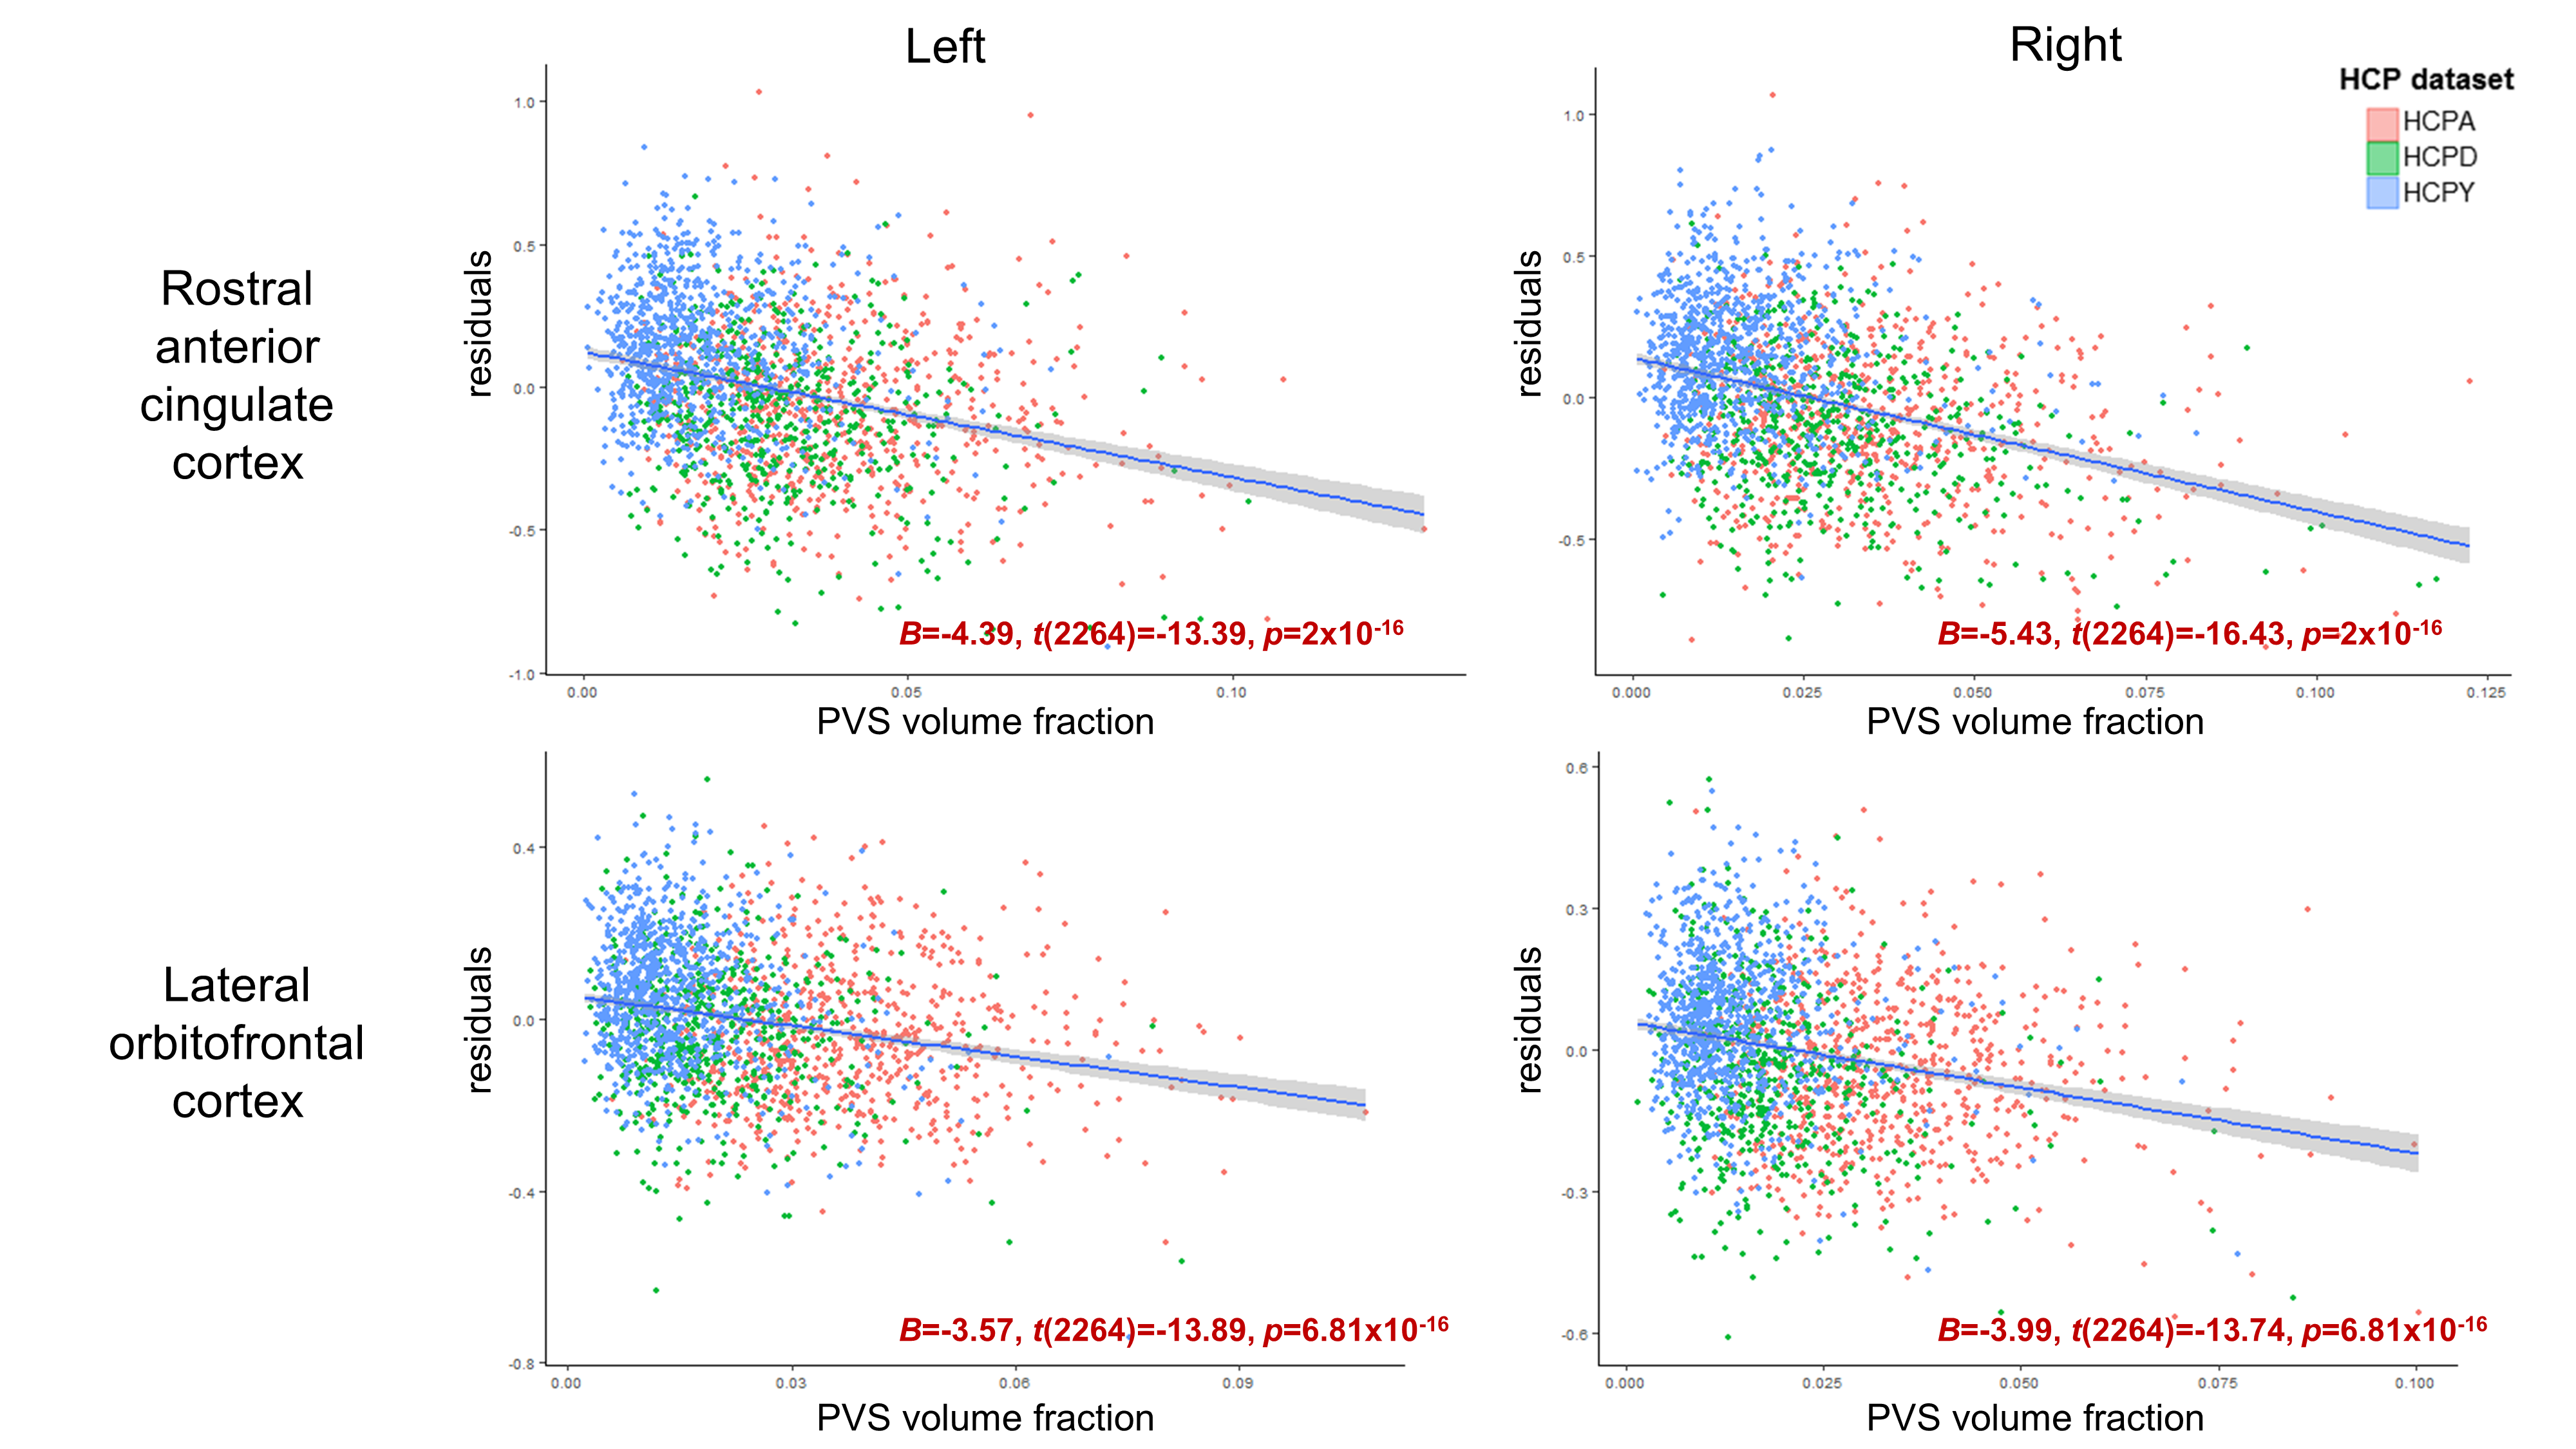
Age was significantly associated with mean cortical thickness, B=-.01, t(2264)=-83.99, p<.001, and PVS volume fraction, B=2.75x10⁻⁴, t(2264)=18.68, p<.001. After adjusting for age, PVS volume fraction was not significantly associated with mean cortical thickness in either the right, p=.86, or left hemisphere, p=.69 (Figure 2). Regional analyses showed age-adjusted cortical thickness for 4 bilateral regions were significantly associated with the underlying PVS volume fraction following Bonferroni correction (.05/56): the transverse temporal cortex, left: B=2.46, t(2264)=4.98, p=6.81x10⁻⁷, right: B=1.61, t(2264)=3.66, p=2.6x10⁻⁴, lateral orbitofrontal cortex, left: B=-3.57, t(2264)=-13.89, p=2x10-16, right: B=-3.99, t(2264)=-13.74, p=2x10-16, medial orbitofrontal cortex, left: B=-4.14, t(2264)=-10.64, p=2x10-16, right: B=-6.13, t(2264)=-14.52, p=2x10-16, and rostral anterior cingulate cortex, left: B=-4.39, t(2264)=-13.39, p=2x10-16, right: B=-5.43, t(2264)=-16.43, p=2x10-16 (Figure 3). The cortical thickness of the right rostral middle frontal cortex, B=-1.26, t(853)=-4.81, p=1.67x10⁻⁶, was also significantly associated with PVS volume fraction after controlling for age. The relationship between PVS volume fraction and regional age-adjusted cortical thickness remained significant in cohort-stratified analyses.Discussion
Our results show the fraction of white matter tissue occupied by PVS is associated with cortical morphology in a cognitively normal population; however, this effect was not uniform across the brain. We found increased PVS was associated with increased cortical thickness in bilateral transverse temporal cortex and decreased cortical thickness in several bilateral frontal regions, including prefrontal and anterior cingulate regions. Additionally, these effects were observed independent of age. Anatomical PVS abnormalities can profoundly impact glymphatic and vascular function through decreased bulk flow of energy substrates and waste metabolites [10]. It is possible that PVS enlargement in white matter regions may occur as a secondary effect of occlusions in upstream arteries located in the gray matter [11]. Therefore, it is unclear whether white matter PVS enlargement is a cause or consequence of nearby cortical thickness alterations.Conclusion
The present study investigated the influence of white matter PVS enlargement on cortical thickness across the lifespan. We found frontal and temporal regions were selectively and differentially associated with PVS content. These findings suggest the influence of PVS enlargement may extend beyond that of glymphatic functionality, and may affect downstream cellular processes in nearby tissue.Acknowledgements
This work was supported by National Institutes of Health grant number P41EB015922 and the National Institute of Mental Health of the NIH Award Number RF1MH123223.References
[1] J. J. Iliff et al., “A paravascular pathway facilitates CSF flow through the brain parenchyma and the clearance of interstitial solutes, including amyloid β,” Sci. Transl. Med., vol. 4, no. 147, 2012.
[2] G. Banerjee et al., “MRI-visible perivascular space location is associated with Alzheimer’s disease independently of amyloid burden.,” Brain, vol. 140, no. 4, pp. 1107–1116, Apr. 2017.
[3] R. A. Opel et al., “Effects of traumatic brain injury on sleep and enlarged perivascular spaces,” J. Cereb. Blood Flow Metab., 2018.
[4] A. Charidimou et al., “Enlarged perivascular spaces as a marker of underlying arteriopathy in intracerebral haemorrhage: A multicentre MRI cohort study,” J. Neurol. Neurosurg. Psychiatry, vol. 84, no. 6, pp. 624–629, 2013.
[5] K. M. Lynch, G. Barisani, A. W. Toga, and F. Sepehrband, “Perivascular space imaging across the lifespan,” in Proc International Society for Magnetic Resonance in Medicine (ISMRM), 2020.
[6] F. Sepehrband et al., “Image processing approaches to enhance perivascular space visibility and quantification using MRI,” Sci. Rep., vol. 9, p. 12351, Aug. 2019.
[7] M. Harms et al., “Extending the Human Connectome Project across ages: Imaging protocols for the Lifespan Development and Aging projects,” Neuroimage, vol. 183, pp. 972–984, 2018.
[8] M. F. Glasser et al., “The minimal preprocessing pipelines for the Human Connectome Project,” Neuroimage, vol. 80, pp. 105–124, 2013.
[9] J. V Manjón, P. Coupé, L. Martí‐Bonmatí, D. L. Collins, and M. Robles, “Adaptive non‐local means denoising of MR images with spatially varying noise levels,” J. Magn. Reson. Imaging, vol. 31, no. 1, pp. 192–203, 2010.
[10] J. J. Iliff et al., “Cerebral arterial pulsation drives paravascular CSF–interstitial fluid exchange in the murine brain,” J. Neurosci., vol. 33, no. 46, pp. 18190–18199, 2013.
[11] N. A. Jessen, A. S. F. Munk, I. Lundgaard, and M. Nedergaard, “The Glymphatic System – A Beginner’s Guide,” Neurochem Res, vol. 40, no. 12, pp. 2583–2599, 2015.
Figures