0322
Iron deposits estimated by QSM MRI: a biomarker of depressive symptoms in cognitively normal and impaired adults with vascular problems1Radiology, Johns Hopkins University, Baltimore, MD, United States, 2Neurology, Johns Hopkins University, Baltimore, MD, United States, 3Engineering, Johns Hopkins University, Baltimore, MD, United States, 4Epidemiology, Johns Hopkins University, Baltimore, MD, United States, 5Whitting School of Engineering, Johns Hopkins University, Baltimore, MD, United States, 6Medicine, Johns Hopkins University, Baltimore, MD, United States, 7Psychiatry and Behavorial Sciences, Johns Hopkins University, Baltimore, MD, United States, 8Johns Hopkins University, Baltimore, MD, United States, 9Kirby Center, Kennedy Krieger Institute, Baltimore, MD, United States
Synopsis
This study explored whether brain iron deposits in gray matter, measured as increased magnetic susceptibility, is a good biomarker for depressive symptoms in older adults with normal and impaired cognition, and vascular comorbidities. In a cross-sectional study(n=73) of normal, mild-cognitive-impairment (MCI), and mild-dementia participants with vascular comorbidities, increased susceptibility in brain-regions (frontal, temporal, parietal, occipital, hippocampus and thalamus) was associated with depressive symptoms (Geriatric Depression Scale, GDS) after adjusting for age, sex, diagnosis, and structural-volume loss, suggesting its potential use as biomarker for depressive symptoms in normal and impaired older adults.
Depression and cognitive impairment are common among older adults, particularly those with vascular co-morbidities1. It is critical to identify mechanisms underlying these neuropsychiatric complications in this population. One potential biomarker that has gained considerable interest is iron-deposits as they are modifiable and linked to oxidative stress, neurodegeneration2 and disrupted striatal dopamine neurotransmission.3 Although prior studies examining iron-related depression alterations yielded equivocal findings,4,5,6 7 iron measurement was based on peripheral-levels which may not reflect cerebral iron deposits.
Recently, quantitative-susceptibility-mapping (QSM) MRI has been used to estimate brain-iron-level changes in a variety of neurodegenerative-diseases and psychiatric-disorders including depression.8,9 QSM allows quantification of bulk tissue magnetic susceptibility from gradient-echo(GRE) signal phase10, 11,12,13 and is optimal for measuring iron-content in gray-matter since tissue magnetic susceptibility relative-to-CSF is mainly determined by its paramagnetic iron content. Higher putamen and thalamus iron-deposits were observed in individuals with Major Depressive Disorder and related to depression severity.14,15 Sub-threshold depression has been also related to structural-volume loss.16
No study to-date has investigated relationships between iron-deposits and depressive symptoms, after adjusting structural-volume loss in older adults with normal and impaired-cognition, and vascular co-morbidities. Thus, we investigated relationships between tissue magnetic susceptibility, a surrogate-marker for iron deposits in cortical and subcortical gray-matter and depressive symptoms, after adjusting structural-volume loss. We hypothesized that higher thalamus and basal ganglia magnetic-susceptibility would be associated with higher depressive-symptoms, after adjusting for structural-volume loss.
METHODS
Seventy-three older participants (24 normal, 38 MCI, and 11 mild-dementia) with vascular co-morbidities from the Johns Hopkins (JH) Diabetes-Center clinics and Alzheimer-Dementia-Research-Center (ADRC) were recruited into this cross-sectional study.Geriatric Depression ScaleDepression symptoms were measured using the 15-item Geriatric Depression Scale (GDS) total-score which has high sensitivity and specificity for depression.17 Scores greater than four were considered clinically significant for depressive symptoms.
MRI
MRI images were acquired on a 3 Tesla-Philips scanner using a 3D T1-weighted Magnetization-Prepared-Rapid-Acquisition-of-Gradient-Echo (MPRAGE) sequence (1×1×1mm3) for anatomic reference and a 3D multi-echo gradient-echo sequence (0.8×0.8×1.6 mm3, TE1/TE/TR=6/6/30, 5 unipolar-echoes) for QSM. QSM images were reconstructed using the JH/Kennedy Krieger Institute QSM Toolbox (version 3.0; http://godzilla.kennedykrieger.org/QSM/). Phase processing, QSM dipole inversion and brain-segmentation were performed as previously described.18 Twelve regions-of-interest (ROI) were segmented and quantified for volume and tissue magnetic-susceptibility referenced to CSF: superior and middle frontal (SM-frontal), inferior and orbital-frontal (IO-frontal), parietal, temporal, occipital, entorhinal (ENT), cingulate cortices, amygdala, hippocampus, caudate, putamen, and globus pallidus.
Analysis
Pearson correlations and multivariable linear regressions evaluated relationships between gray-matter magnetic-susceptibilities and depressive-symptoms. First, correlations evaluated relationships between susceptibility in the twelve ROIs and GDS. Second, regression analyses assessed relationships between susceptibility in ROI and GDS after adjusting for age, sex, diagnosis (MCI/dementia), and structural-volume. Finally, due to absence of associations between structural-volumes and GDS, we estimated total iron-content for twelve ROIs (susceptibility x ROI-volume) and conducted principal components analysis (PCA) with varimax rotation to remove multicollinearity among brain-regions, and to use the uncorrelated component residuals in a single regression model to determine regions relating to depression while accounting for other regions as well as age, sex, and diagnosis (MCI/dementia).
RESULTS
Table1 shows both high-GDS (GDS score >4) and low-GDS groups have higher than normal vascular-risk (Systolic/Diastolic BP (>120/70 mmHg), and HbA1c (>5.7 %)). Gray-matter susceptibilities (iron-concentrations) were higher in high-GDS (GDS score >4) vs. low-GDS group for several brain-regions (SM-frontal (p=0.001), IO-frontal (p=0.007), parietal (p=0.00001), temporal(p=0.004), occipital (p=0.002), hippocampus (p=0.004), and thalamus (p=0.016)) (Table1). Higher susceptibilities in these ROIs correlated with higher GDS-scores (Fig 1). In adjusted analyses, higher susceptibilities in SM-frontal (β=0.82, p=0.001), IO-frontal (β=0.66, p=0.009), parietal (β=0.81, p=0.001), temporal (β=0.89, p=0.0003), occipital (β=0.76, p=0.002), cingulate (β=0.65, p=0.016), hippocampus (β=0.76, p=0.002), and thalamus (β=0.057, p=0.027) were associated with higher GDS-scores (Table 2).Three principal-components (PC) were derived from the PCA (PC1, reflected cortical and PC2 & 3 reflected subcortical regions). PC1 reflecting cortical regions was associated with higher GDS in the adjusted analysis (Table3b). Finally, regression analysis on the uncorrelated component-residuals showed associations between higher total iron-content in SM-frontal (β=0.198, p=0.013), IO-frontal (β=0.19, p=0.012), Parietal (β=0.20, p=0.013), temporal (β=0.14, p=0.006), occipital (β=0.18, p=0.010), and hippocampus (β=0.16, p=0.04) and higher GDS-scores in adjusted analyses (Table 3c).
CONCLUSIONS
Iron-deposits estimated by magnetic susceptibilities in several brain-regions were associated with depressive-symptoms in 73 older individuals with normal and impaired cognition, and vascular-co-morbidities, suggesting iron deposits may be a reliable biomarker for depressive symptoms. Their ability to explain variance in depressive-symptoms, beyond volume-loss, age and diagnosis in normal and pre-clinical stages of dementia, indicates early interventions to stabilize iron-homeostasis could alter depressive-symptoms related morbidity.
Acknowledgements
No acknowledgement found.References
References:
1. Alexopoulos GS. Depression in the elderly. Lancet. 2005 Jun 4-10;365(9475):1961-70. doi: 10.1016/S0140-6736(05)66665-2. PMID: 15936426.
2. Zecca L, Youdim MB, Riederer P, Connor JR, Crichton RR. Iron, brain ageing and neurodegenerative disorders. Nature Reviews Neuroscience. 2004 Nov;5(11):863-73.
3. Earley CJ, Connor J, Garcia-Borreguero D, Jenner P, Winkelman J, Zee PC, Allen R. Altered brain iron homeostasis and dopaminergic function in restless legs syndrome (Willis–Ekbom disease). Sleep medicine. 2014 Nov 1;15(11):1288-301.
4. Zhu L, Han B, Wang L, Chang Y, Ren W, Gu Y, Yan M, Wu C, Zhang XY, He J. The association between serum ferritin levels and post-stroke depression. Journal of affective disorders. 2016 Jan 15;190:98-102.
5. Stewart R, Hirani V. Relationship between depressive symptoms, anemia, and iron status in older residents from a national survey population. Psychosomatic medicine. 2012 Feb 1;74(2):208-13.
6. Su Q, Gu Y, Yu B, Yu F, He H, Zhang Q, Meng G, Wu H, Du H, Liu L, Shi H. Association between serum ferritin concentrations and depressive symptoms among Chinese adults: a population study from the Tianjin Chronic Low-Grade Systemic Inflammation and Health (TCLSIHealth) cohort study. PLoS One. 2016 Sep 9;11(9):e0162682.
7. Nielsen P, Günther U, Dürken M, Fischer R, Düllmann J. Serum ferritin iron in iron overload and liver damage: correlation to body iron stores and diagnostic relevance. Journal of Laboratory and Clinical Medicine. 2000 May 1;135(5):413-8.
8. Wang Y, Liu T. Quantitative susceptibility mapping (QSM): Decoding MRI data for a tissue magnetic biomarker. Magn Reson Med. 2015;73(1):82-10
9. Schweser F, Deistung A, Lehr BW, Reichenbach JR. Quantitative imaging of intrinsic magnetic tissue properties using MRI signal phase: an approach to in vivo brain iron metabolism?. Neuroimage. 2011 Feb 14;54(4):2789-807.
10. Liu T, Spincemaille P, de Rochefort L, Wong R, Prince M, Wang Y. Unambiguous identification of superparamagnetic iron oxide particles through quantitative susceptibility mapping of the nonlinear response to magnetic fields. Magnetic resonance imaging. 2010 Nov 1;28(9):1383-9.
11. Langkammer C, Pirpamer L, Seiler S, Deistung A, Schweser F, Franthal S, et al. (2016) Quantitative Susceptibility Mapping in Parkinson's Disease. PLoS ONE 11(9): e0162460.
12. Wang Y, Spincemaille P, Liu Z, et al. Clinical quantitative susceptibility mapping (QSM): Biometal imaging and its emerging roles in patient care. J Magn Reson Imaging. 2017;46(4):951-971.
13. Zhang Y, Gauthier SA, Gupta A, Chen W, Comunale J, Chiang GY, Zhou D, Askin G, Zhu W, Pitt D, Wang Y. Quantitative susceptibility mapping and R2* measured changes during white matter lesion development in multiple sclerosis: myelin breakdown, myelin debris degradation and removal, and iron accumulation. American Journal of Neuroradiology. 2016 Sep 1;37(9):1629-35.
14. Zhang W, Zhou Y, Li Q, Xu J, Yan S, Cai J, Jiaerken Y, Lou M. Brain iron deposits in thalamus is an independent factor for depressive symptoms based on quantitative susceptibility mapping in an older adults community population. Frontiers in Psychiatry. 2019;10:734.
15. Yao S, Zhong Y, Xu Y, et al. Quantitative Susceptibility Mapping Reveals an Association between Brain Iron Load and Depression Severity. Front Hum Neurosci. 2017;11:442.
16. Li J, Wang Z, Hwang J, Zhao B, Yang X, Xin S, Wang Y, Jiang H, Shi P, Zhang Y, Wang X. Anatomical brain difference of subthreshold depression in young and middle-aged individuals. NeuroImage: Clinical. 2017 Jan 1;14:546-51.
17. Sheikh, J.I., & Yesavage, J.A. (1986). Geriatric Depression Scale (GDS). Recent evidence and development of a shorter version. In T.L. Brink (Ed.), Clinical Gerontology: A Guide to Assessment and Intervention (pp. 165-173). NY: The Haworth Press, Inc.
18. Chen L, Soldan A, Oishi K, Faria A, Zhu Y, Albert M, van Zijl PC, Li X. Quantitative susceptibility mapping of brain iron and β-amyloid in MRI and PET relating to cognitive performance in cognitively normal older adults. Radiology. 2020 Nov 24:201603.
Figures

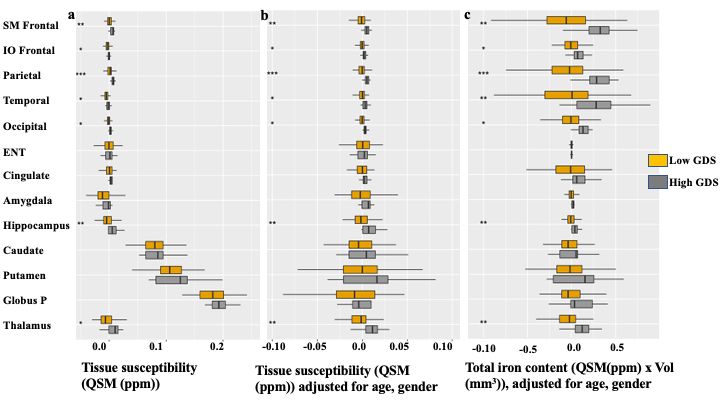
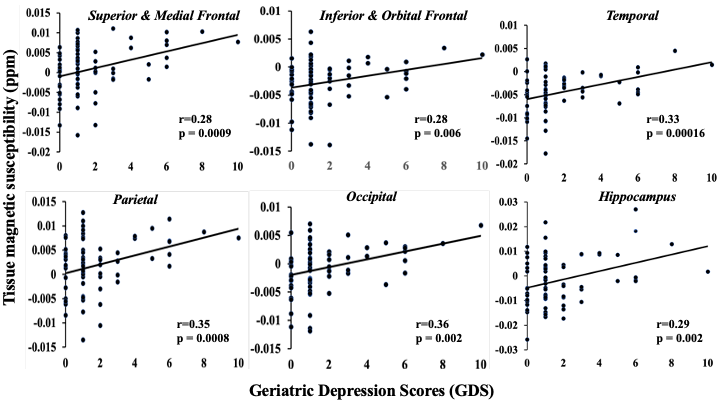

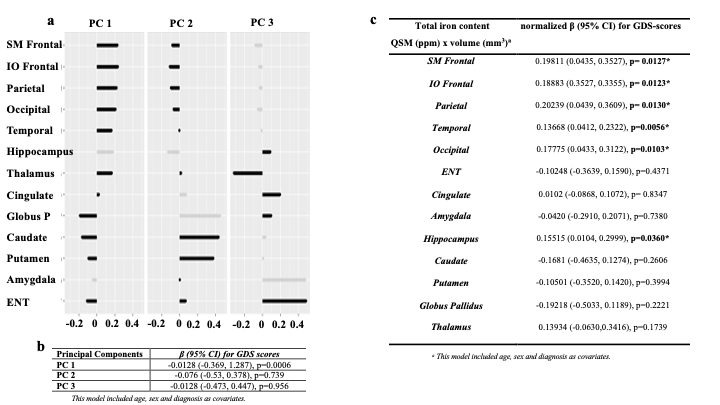
Table 3. Principal Component Analysis (PCA) and regression models for total iron content (susceptibility(ppm) x volume(mm3)) and GDS. 3a) shows 3 principal components (PC)s derived from PCA: PC1, mostly cortical areas, and PC2 & 3, sub-cortical areas. 3b) shows regression model for PCs and GDS scores. 3c) shows a regression model for PCA derived non-collinear residuals for brain regions, and GDS.