0317
Improvement of Left Hepatic Lobe Diffusion Weighted Imaging using Double Triggering with Motion Sensitive CINE Imaging1Philips Japan, Tokyo, Japan, 2Department of Clinical Radiology, Graduate School of Medical Sciences, Kyushu University, Fukuoka, Japan, 3Division of Radiology, Department of Medical Technology, Kyushu University Hospital, Fukuoka, Japan, 4Department of Radiological Services, Tokyo Women’s Medical University, Tokyo, Japan, 5Department of Diagnostic Imaging and Nuclear Medicine, Tokyo Women’s Medical University, Tokyo, Japan
Synopsis
In the Liver DWI, the respiratory and cardiac motion induce signal loss and artificially increase ADC of the left hepatic lobe. On the other hand, Motion-Sensitive (MoSe) CINE imaging, based on T2FFE (also known as PSIF) sequence, could directly visualize the motion-insensitive cardiac timing thanks to that of motion sensitivity. We assumed that it is useful for determining optimal cardiac trigger delay (TD) in the liver DWI. We demonstrated that the respiratory and cardiac trigged DWI with optimal cardiac TD using MoSe CINE imaging leads to the robustness of image quality in DWI and ADC of the left hepatic lobe.
Introduction
Liver diffusion weighted imaging (DWI) is useful to diagnosis of the liver disease, lesion detection and lesion characterization and the apparent diffusion coefficient (ADC) is used to assess tumor response to treatment1-2. However, respiratory and cardiac motion induce signal loss in DWI and artificially increase ADCs of the left hepatic lobe3. One study demonstrated cardiac-triggered DWI at b=500 s/mm2 with predetermined optimal cardiac trigger delay (TD) improved ADC repeatability4. However, optimal cardiac TD was visually determined using balanced SSFP (bSSFP) CINE in this study. On the other hand, Motion-Sensitive (MoSe) CINE imaging, based on T2-fast field echo (T2FFE) sequence, can directly visualize the motion-insensitive cardiac phase timing thanks to that of motion sensitivity5. T2FFE theoretically has a greater sensitivity to motion6. Nevertheless, one study demonstrated that T2FFE achieves rapid 3D T2-weighted black- blood imaging while minimizing the impact of motion using a low flip angle under the shortest repetition time (TR) and the shortest echo time (TE) conditions similar to the bSSFP sequences7. MoSe CINE imaging is technique that utilizing features of them. We expect that the MoSe CINE imaging provide more robustness and quantitativity to determine optimized cardiac TD in the liver DWIs and ADCs. The aim of this study is to improve the image qualities of DWI and to provide the robustness of ADCs in the left hepatic lobe by respiratory and cardiac triggered DWI (double triggered DWI: DT-DWI) with MoSe CINE imaging.Methods
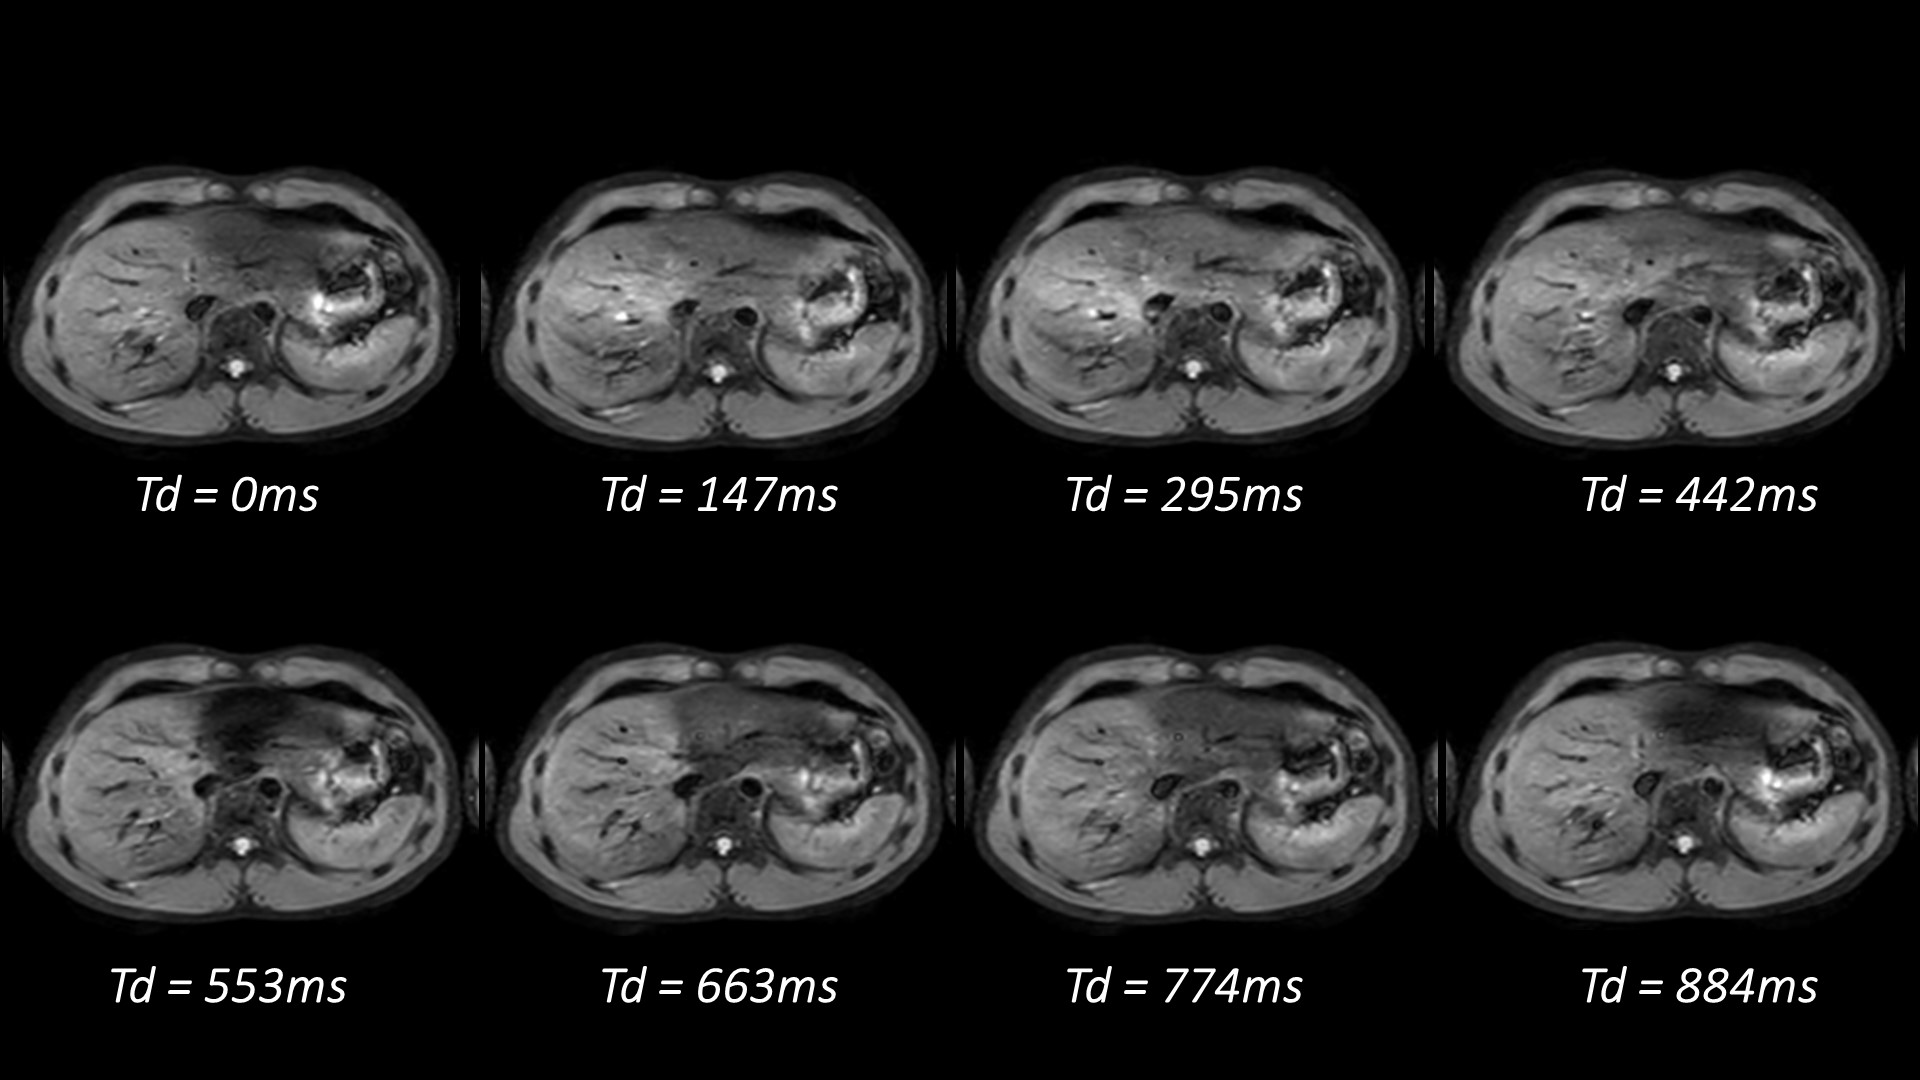
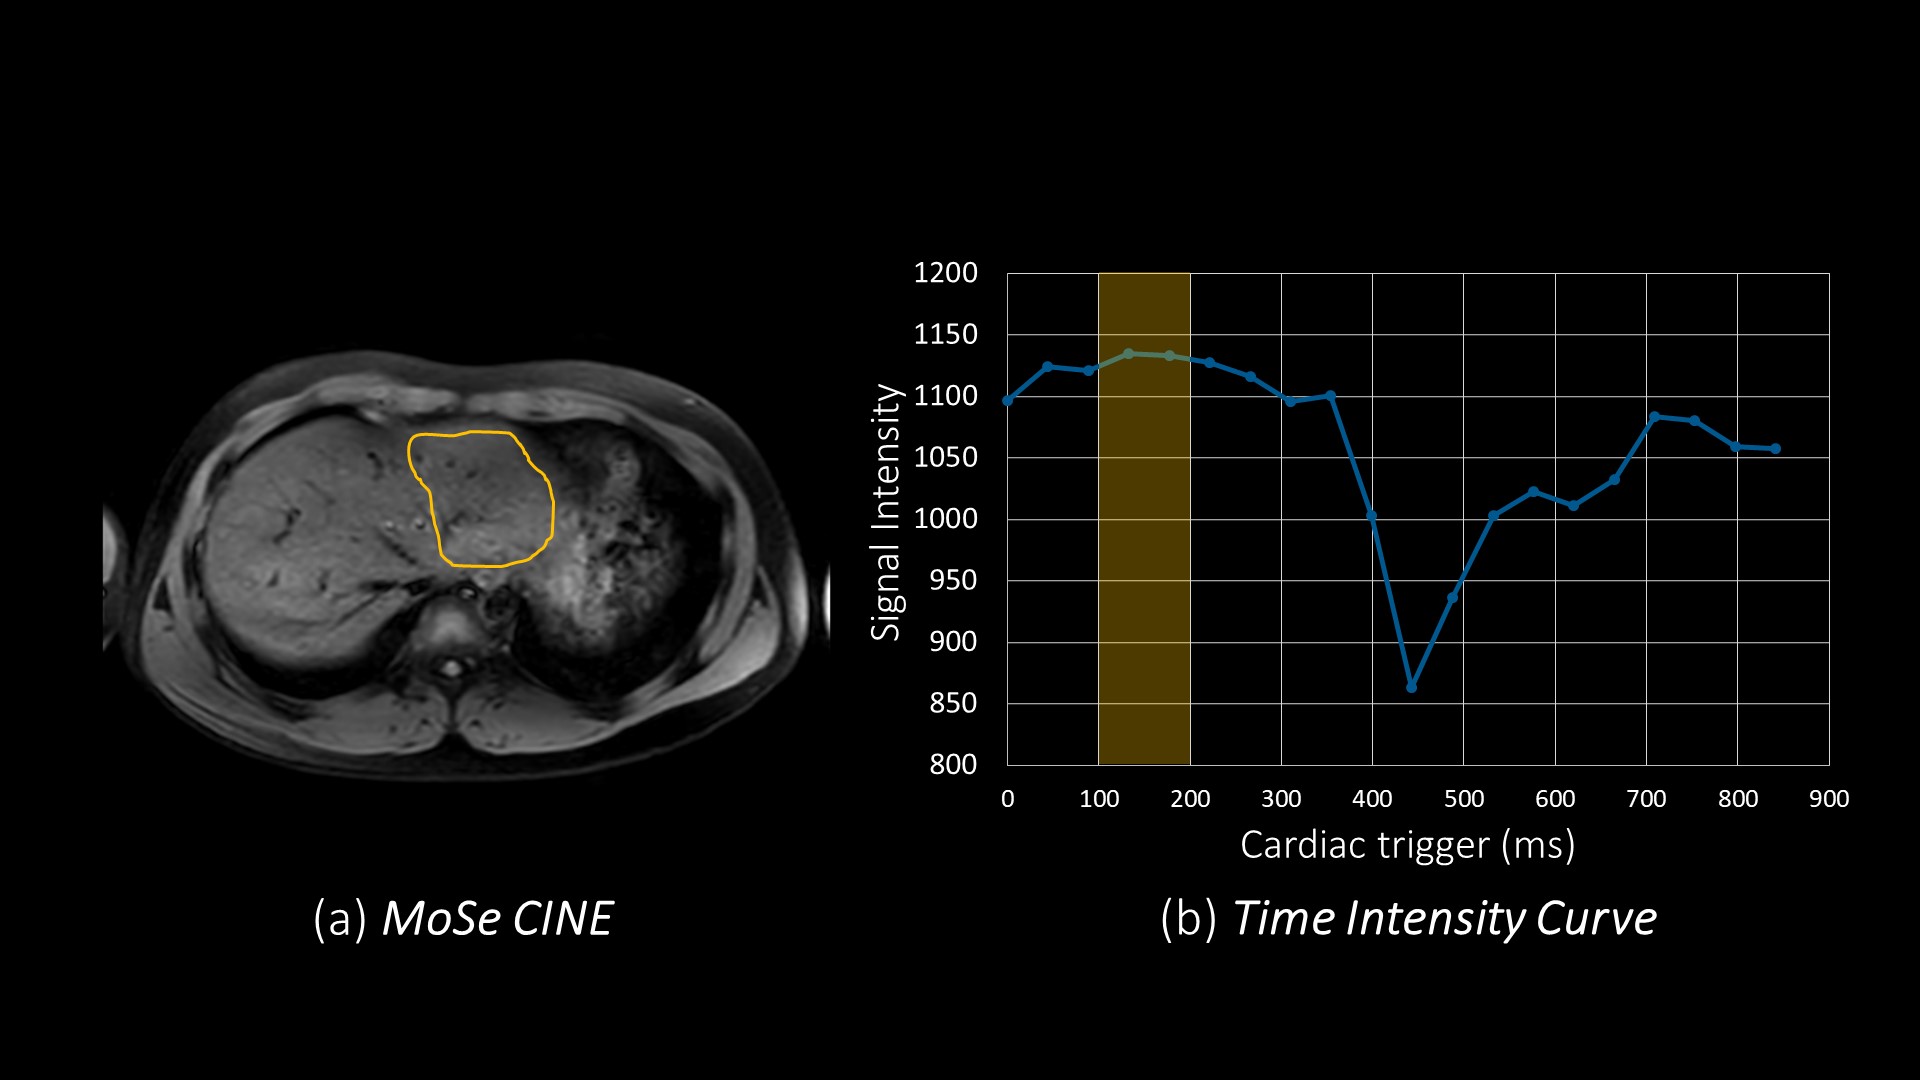
DT-DWI with MoSe CINE imaging techniques: DT-DWI utilizes navigator echo technique and peripheral pulse unit. Imaging parameters for DT-DWI: FOV=380mm, acquisition voxel size=3.5*3.5*7mm3, TE/TR=65/1875ms, Fat suppression technique=SPIR combine with SSGR, b-values=0-800 s/mm2, 6 slices, and acquisition time=1m21s (setting time). To demonstrate the feasibility of using MoSe CINE imaging for determining optimal cardiac TD in liver DWI, we compared three sequences: 1. Respiratory triggered DWI without cardiac triggering (RT-DWI). 2. Respiratory and cardiac triggered DWI with TD set to shortest, assuming cardiac diastolic phase (DT-DWI). 3. Respiratory and cardiac triggered DWI with optimal TD using MoSe CINE imaging (MoSe-DT-DWI). MoSe CINE images were obtained in the transverse plane including left hepatic lobe with a single breath hold (Fig. 1). To determine optimal cardiac TD, region-of-interest (ROI) was placed on the left hepatic lobe as large as possible and the time intensity curve was provided (Fig. 2). We defined the optimal cardiac TD, as the timing that signal is the highest and the most stable at the time intensity curve.Subjects: RT-DWI, DT-DWI and MoSe-DT-DWI in seven healthy volunteers were examined on a 3.0T MR scanner (Ingenia Elition, Philips Healthcare) and three healthy volunteers were examined on a 1.5T MR scanner (Ingenia CX, Philips Healthcare). The volunteers obtained informed consent and approved by institutional review board.
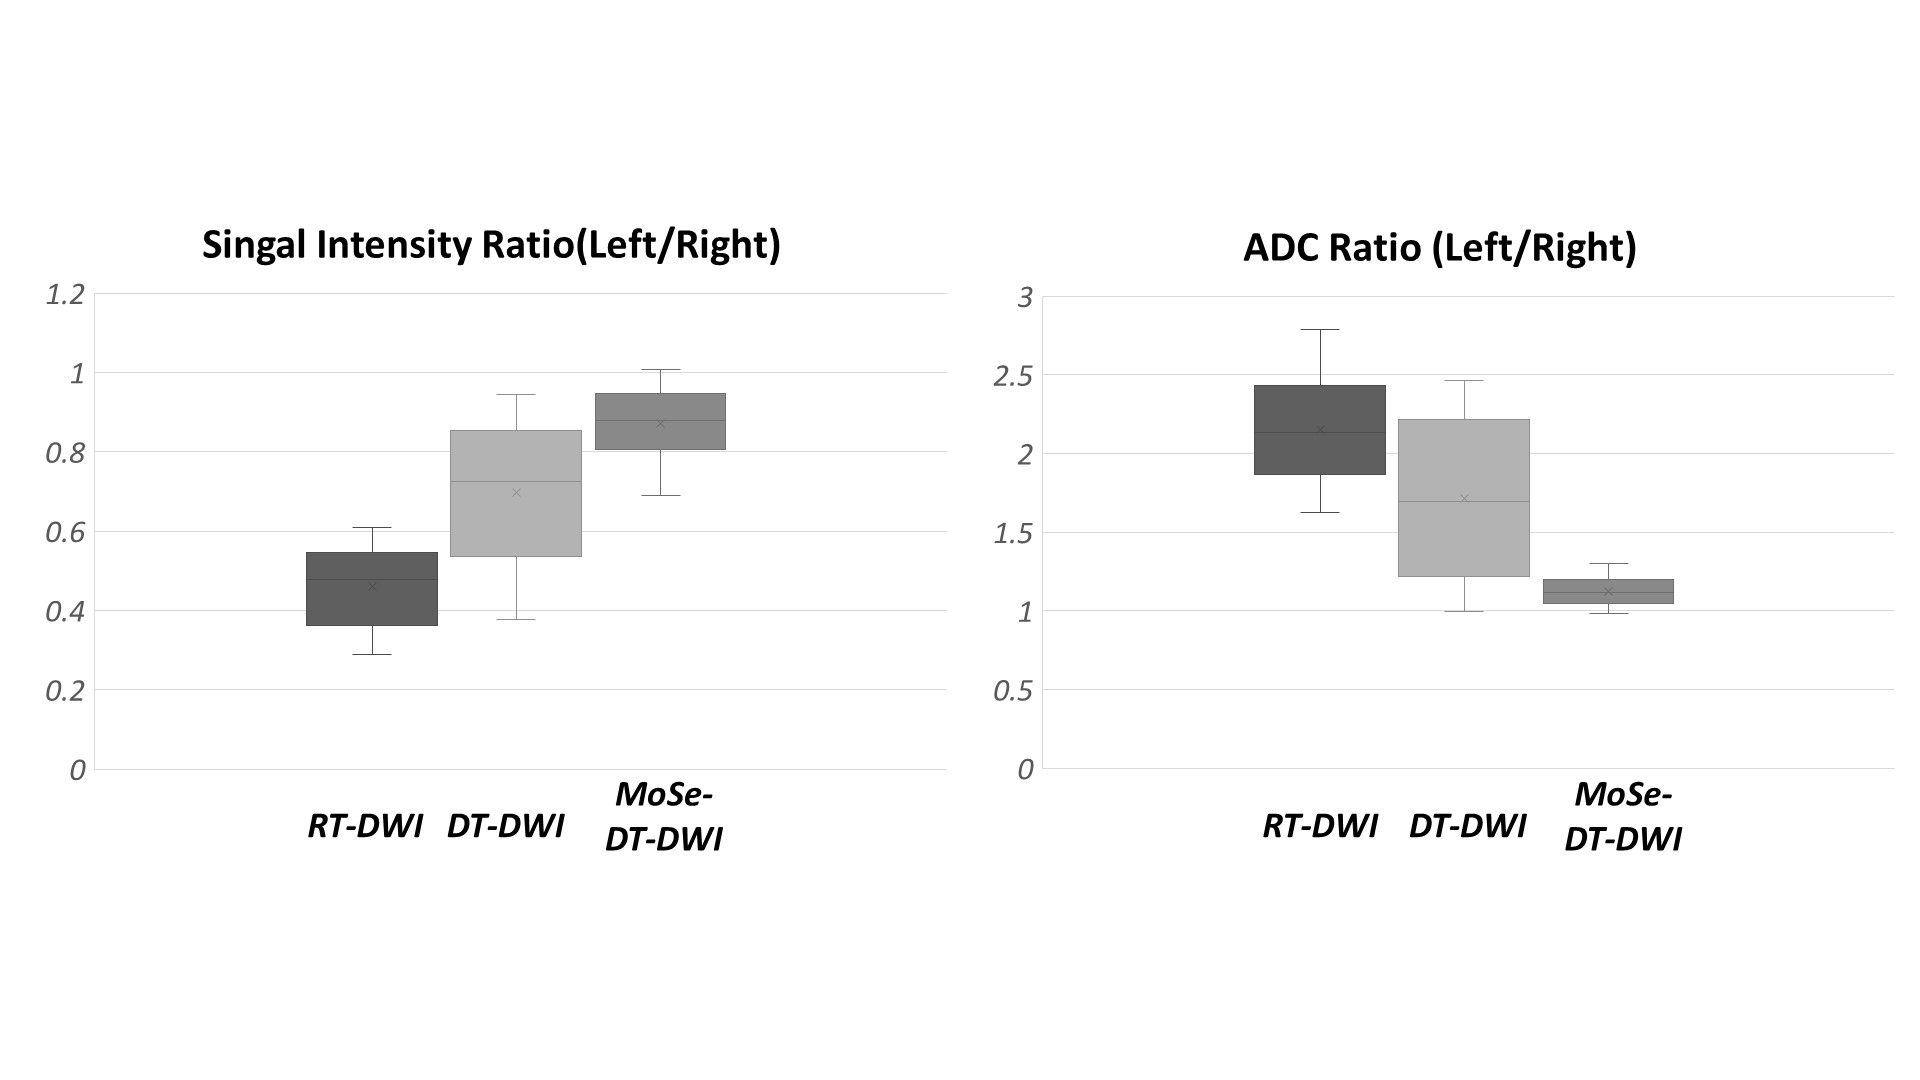
Evaluation: To compare the image qualities of three types of DWIs, the signal intensity ratio (SIR) and the ADC ratio for right and left hepatic lobe were evaluated. ROIs were placed on left lobe and right lobe on the DWIs with b=800 s/mm2 and ADC maps. The SIRs were calculated as SIR = signal intensity of left lobe (SI left)/ signal intensity of right lobe (SI right). Here SI left and SI right was respective mean signal intensity in the ROIs. ADC ratios were calculated as ADC value of left lobe (ADC left) / ADC value of right lobe (ADC right). Here ADC left and ADC right was respective mean ADC value in the ROIs.
Results and Discussion
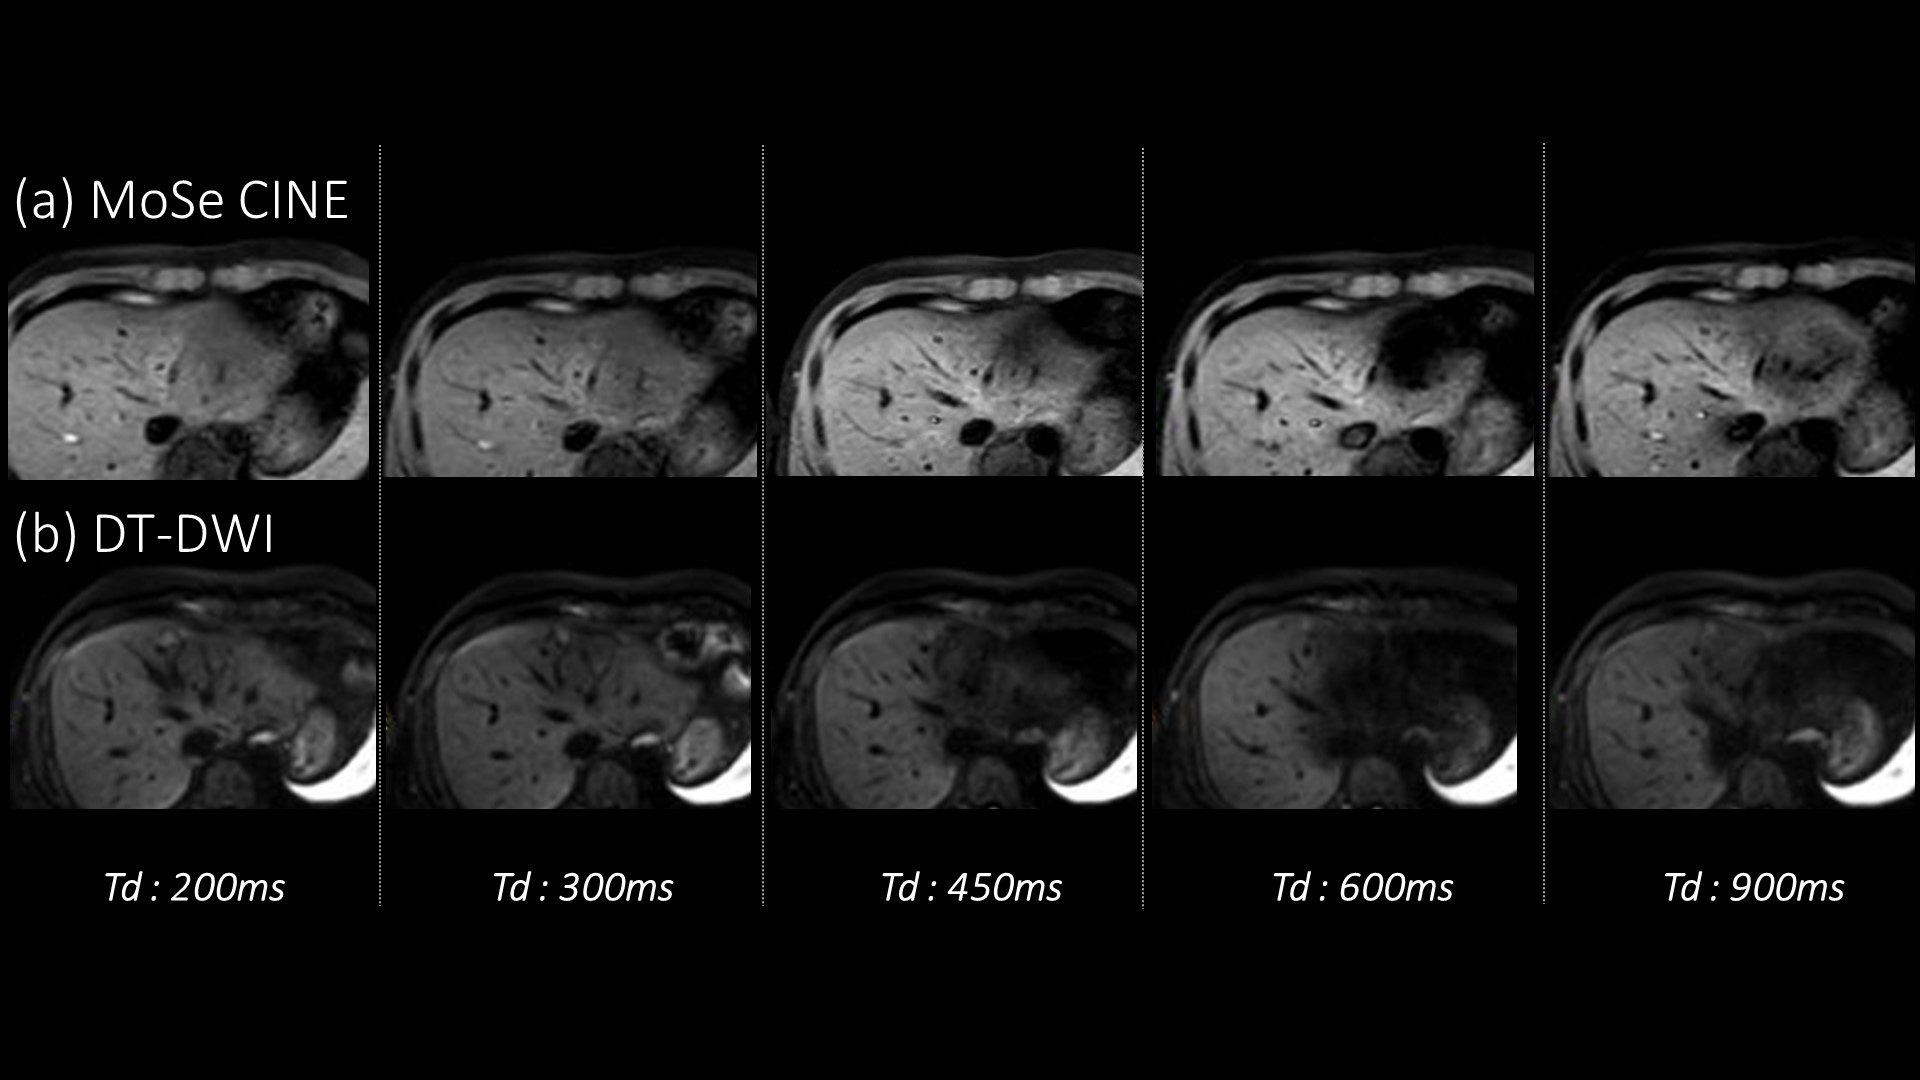
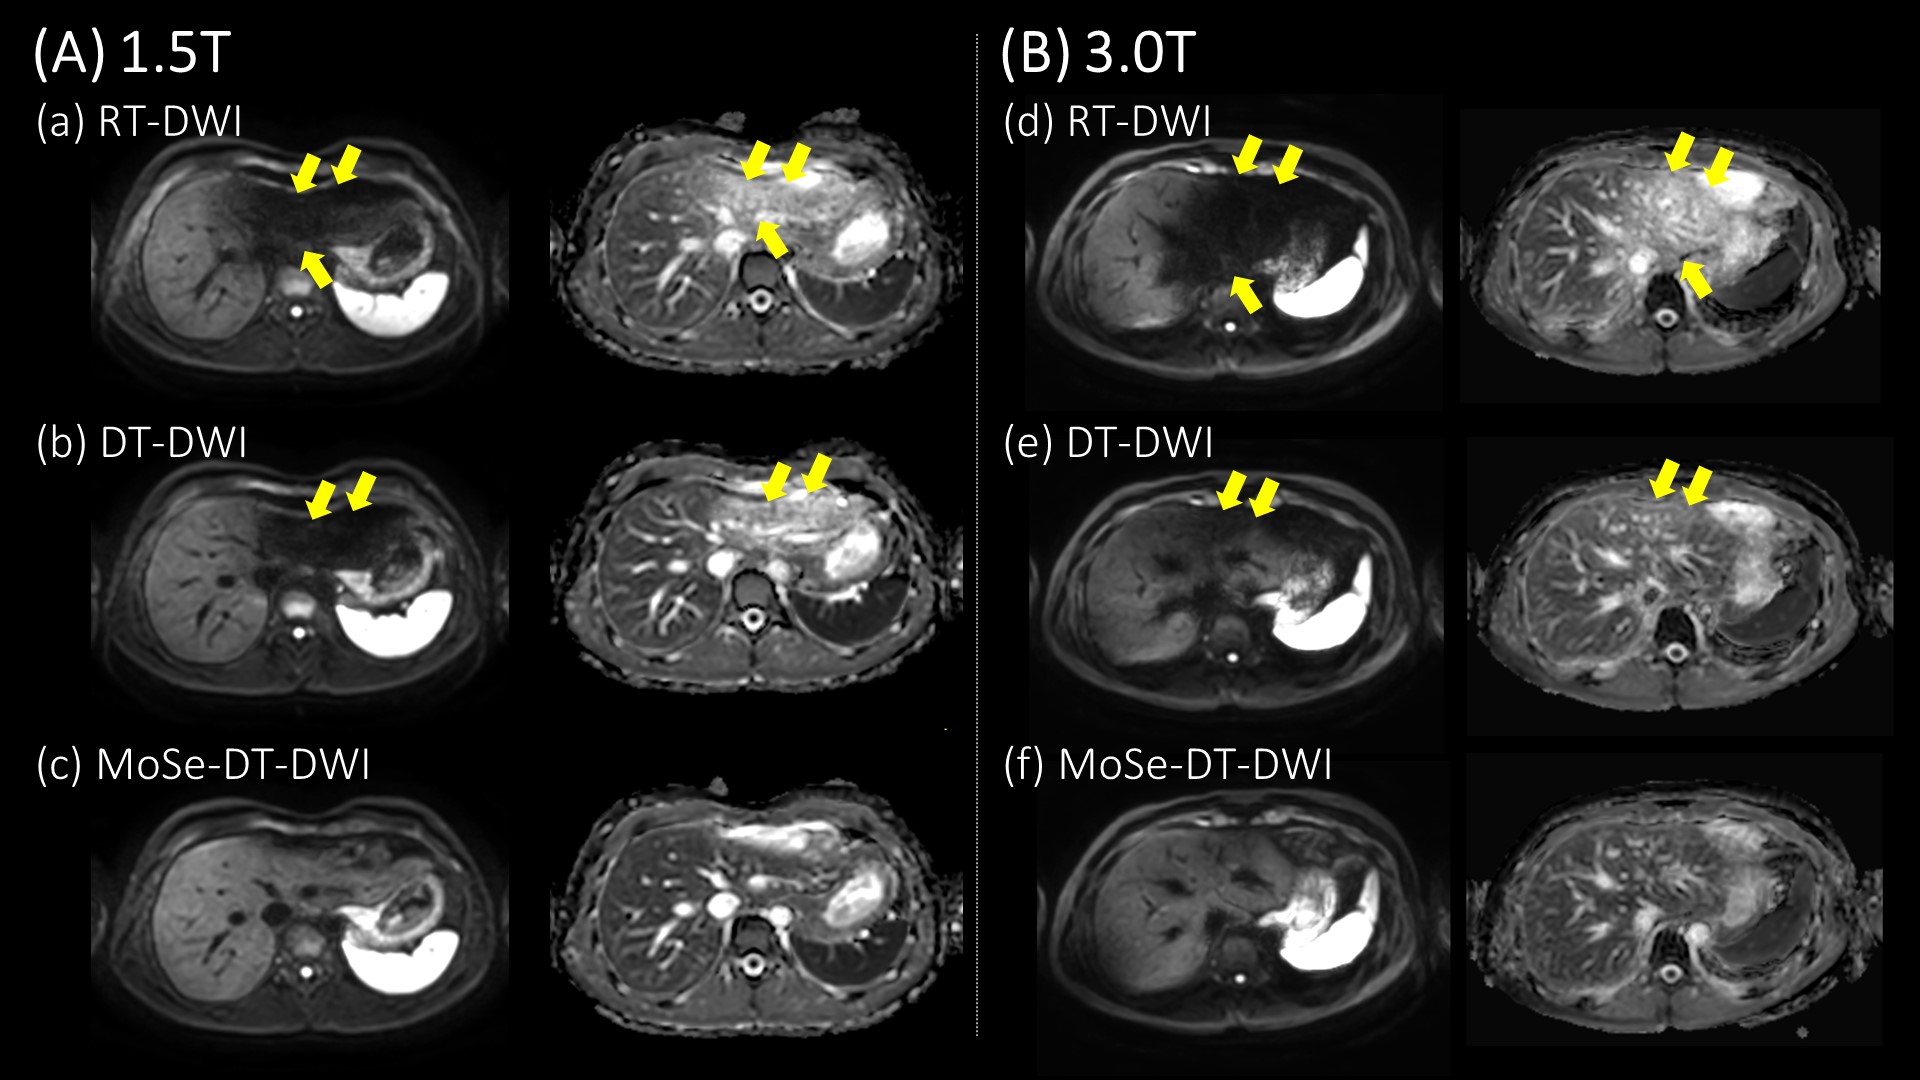
By using time intensity curves with MoSe CINE imaging, the operator could defined optimal cardiac TD with high robustness and quantitativity within 30 seconds. An example was shown that MoSe CINE images and DT-DWIs at respective cardiac TD, which was 200ms, 300ms, 450ms, 600ms and 900ms in Figure 3. The effects of cardiac motion on DT-DWIs agreed with findings of MoSe CINE imaging. Representative DWIs and ADC maps on 1.5T and 3.0T are shown respective in Figure 4. In the RT-DWI and DT-DWI, signal loss from cardiac related artifacts appeared and the ADC left was artificially higher than ADC right. MoSe-DT-DWI significantly improved the image qualities of the left hepatic lobe compared to other techniques. The results of SIRs and ADC ratios are shown in Figure 5. The SIRs and ADC ratios at the MoSe-DT-DWI is the closest to one, suggests that MoSe-DT-DWI is the least impact of signal loss from cardiac motion.Conclusion
MoSe CINE imaging was useful for determining optimal cardiac TD in the liver DWI. In this study, we demonstrated that the respiratory and cardiac triggered DWI with optimal cardiac TD using MoSe CINE imaging leads to the robustness of image quality in DWI and ADC map of the left hepatic lobe.Acknowledgements
No acknowledgement found.References
1 Taouli B et al. Diffusion-weighted MR imaging of the liver. Radiology. 2010 Jan 254(1): 47-66
2 Low RN. Abdominal MRI advances in the detection of liver tumours and characterisation. Lancet Oncol. 2007 Jun 8(6) : 525-35
3 Kwee TC et al. Influence of cardiac motion on diffusion-weighted magnetic resonance imaging of the liver. MAGMA. 2009 Oct 22(5): 319-25
4 Thierry Metens et al. Liver apparent diffusion coefficient repeatability with individually predetermined optimal cardiac timing and artifact elimination by signal filtering. J Magn Reson Imaging. 2016 May 43(5): 1100-10
5 Shiina I et al, Motion-Sensitive (MoSe) CINE imaging: utility for improving robustness of myocardial quantitative mapping. In:Proc. 28th Annual Meeting of ISMRM, 2020 ; 2053
6 Zur Y et al, Motion-insensitive, steady-state free precession imaging. Magn Reson Med. 1990 Dec 16(3): 444–59.
7 Yoneyama M et al. Reevaluation of T2-weighted fast field echo (T2FFE): application to rapidvolumetric black-blood imaging. Radiol Phys Technol. 2013 6: 305-12
Figures