0314
Macromolecular proton fraction mapping based on spin-lock for the non-invasive diagnosis of early stage liver fibrosis1Department of Imaging and Interventional Radiology, The Chinese University of Hong Kong, Hong Kong, Hong Kong, 2Department of Medicine & Therapeutics, The Chinese University of Hong Kong, Hong Kong, Hong Kong, 3Department of Anatomical and Cellular Pathology, The Chinese University of Hong Kong, Hong Kong, Hong Kong
Synopsis
Liver fibrosis is characterized by excessive accumulation of extracellular matrix proteins, such as collagen. Macromolecular Proton Fraction (MPF) is an indicator of the relative amount of macromolecular content. It was reported recently that MPF map can be obtained based on spin-lock (MPF-SL). In this work, we investigated the diagnostic value of MPF-SL for detecting early stage liver fibrosis on a clinical study.
Introduction
Liver fibrosis is characterized by excessive accumulation of extracellular matrix proteins, such as collagen.1,2 Quantitative Magnetization Transfer (qMT) shows the potential to quantify fibrous tissue.3,4 Among the parameters in qMT model, Macromolecular Proton Fraction (MPF) is an important one, which indicates relative amount of macromolecular content in tissues. The measurement of MPF attracts interests in both clinical and research fields in recent years.5-8 Recently, a novel MPF imaging technique based on spin-lock, termed MPF-SL, was reported.9 It is insensitive to the relaxation rate of the free water protons and thus does not require a T1 map to quantify MPF. Two-dimensional MPF-SL can be completed within a brief breath-hold. Only a B1 map in addition to imaging data is needed for MPF quantification. In this work, we reported our clinical study to investigate the diagnostic value of MPF-SL for detecting early stage liver fibrosis.Methods
Fifty-seven patients (26 females and 31 males, age from 28 to 72) were recruited in this study. The study was approved by the institutional review board. All patients had nonalcoholic fatty liver disease and were attending the hepatology clinics of our institute. Their liver fibrosis was histologically staged by a hepatopathologist blinded to the imaging results using the Nonalcoholic Steatohepatitis Clinical Research Network system.10 Twenty-two patients had no liver fibrosis (F0), and the other 35 had early stage liver fibrosis (F1 and F2). The scans were conducted on a Philips 3T MRI scanner (Achieva TX, Philips Healthcare, Best, Netherlands) with a 32-channel cardiac coil (Invivo Corp, USA). The pulse sequence was described in the reference.9 Sequence parameters included: resolution 1.5mm*1.5mm, slice thickness 7mm, and TR/TE 2000/20ms. Three slices were collected from each patient. The vendor-provided B1 map based on double-angle approach was obtained. A shimming box was added on the right lobe of the liver to mitigate B0 field inhomogeneity. Double Inversion Recovery (DIR) combined with fast/turbo spin echo readout was used for suppression of blood signal.11 Spectral Pre-saturation with Inversion Recovery (SPIR) was used for fat suppression.Same as reported previously9, five ROIs were manually drawn within the shimming box of each slice. A normal distribution fitting was then performed on the histogram from the ROIs. As liver fibrosis usually has diffuse involvement of the liver, the central tendency of the histogram was taken as the estimated MPF of the slice. Mann-Whitney U-test was used to compare MPF of the group with no fibrosis and with early stage fibrosis. Spearman’s rank correlation coefficient was used to test the associations between MPF and liver fibrosis score. A receiver operating characteristic (ROC) curve was used to investigate the capability of MPF for discrimination between patients with no liver fibrosis (F0) and patients with early stage liver fibrosis (F1 and F2). All statistical analyses were performed using SPSS statistic package v.22 (IBM corporation, New York, USA), with statistical significance set at p-value less than 0.05.
Results and Discussion
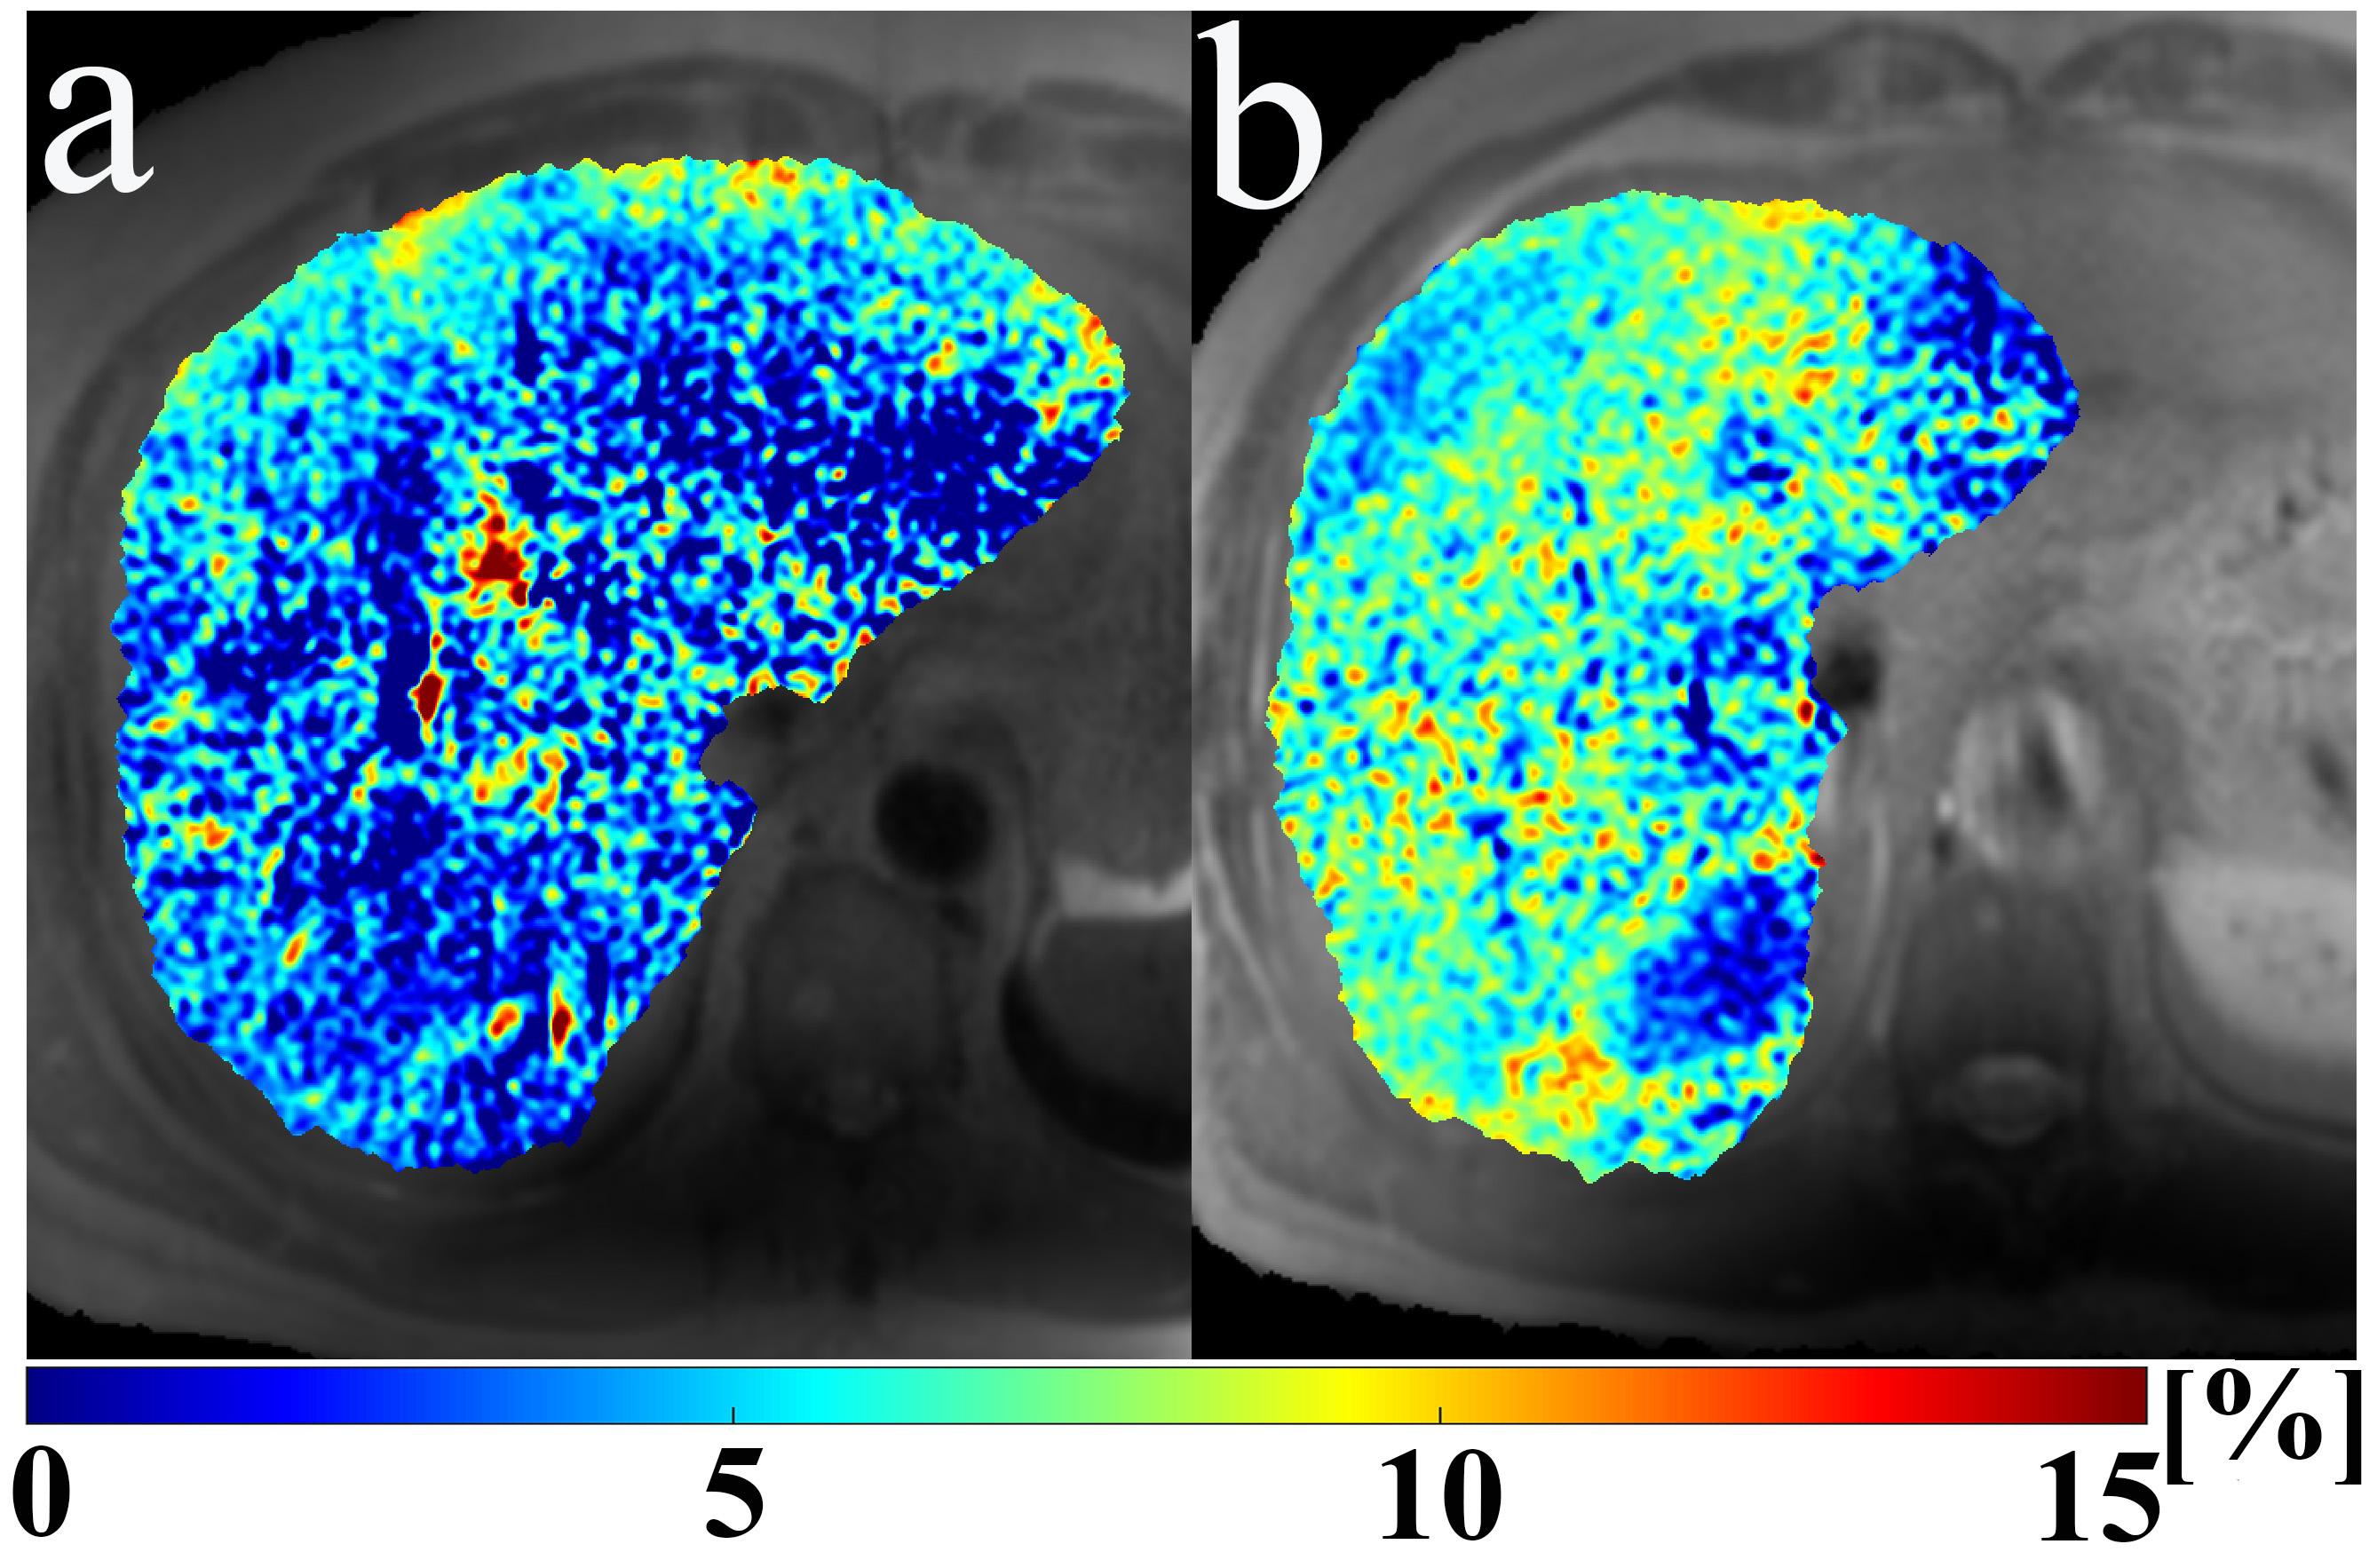
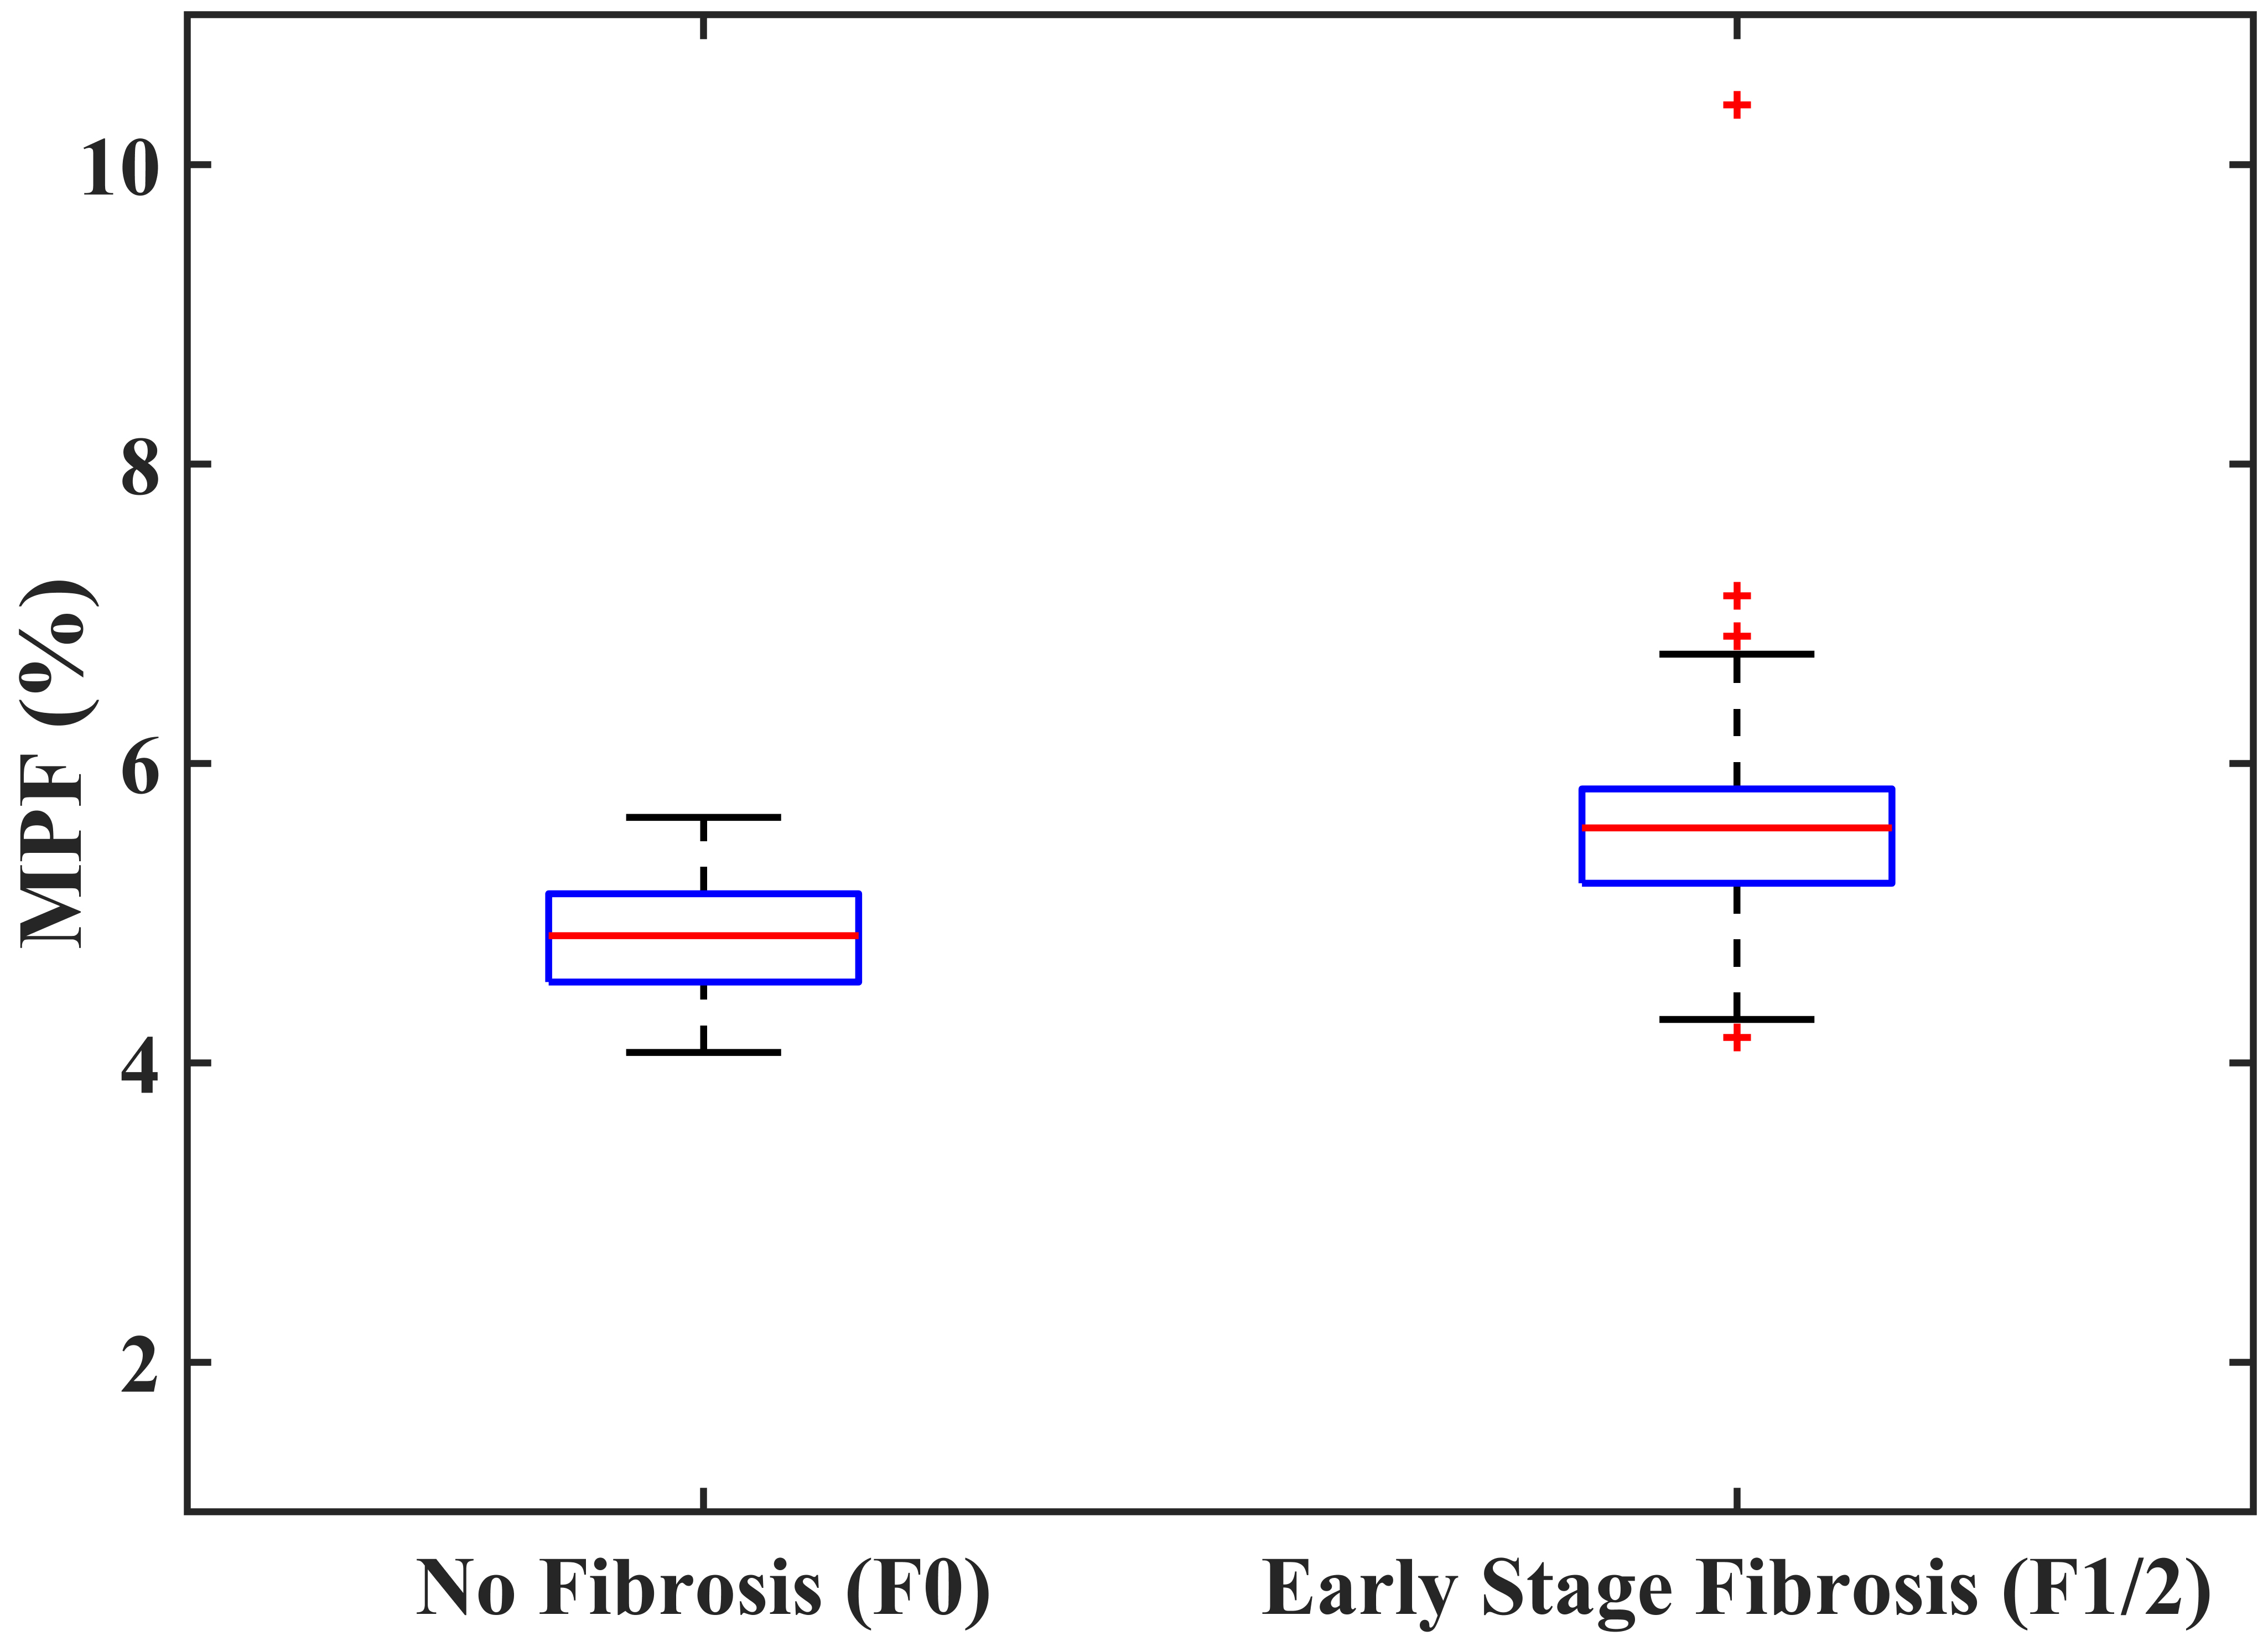
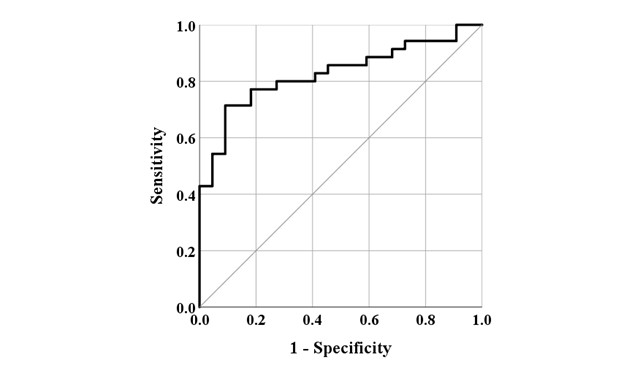
Representative MPF maps with no fibrosis (F0) and early stage liver fibrosis (F1/F2) were shown in Figure 1. MPF (shown as mean±SD) corresponding to no liver fibrosis (F0) and early stage liver fibrosis (F1/F2) were 4.84±0.41% and 5.69±1.06%, respectively (p<0.001). Figure 2 shows the boxplot of the measured MPF using MPF-SL at stage F0 and stage F1/F2. Note the significant difference between the groups. Spearman’s rank correlation between MPF and liver fibrosis score was 0.552 with p<0.001. Figure 3 shows the results of ROC analysis of MPF for discrimination between F0 and F1/F2. The Area Under Curve (AUC) was 0.827 with 95% Confidence Intervals (CI) 0.721-0.934 (p<0.001).Conclusion
MPF measured using MPF-SL shows correlations with the degree of liver fibrosis. A significant difference of MPF between normal (F0) and early stage liver fibrosis (F1/F2) was observed. ROC curve analysis suggests MPF-SL is a potential non-invasive approach for diagnosis of liver fibrosis.Acknowledgements
This study is supported by a grant from the Hong Kong Health and Medical Research Fund (HMRF) 06170166, Faculty Innovation Award from the Faculty of Medicine, the Chinese University of Hong Kong, a grant from the Hong Kong General Research Fund (GRF) 14201817, and a grant from the Research Grants Council of the Hong Kong SAR (Project SEG CUHK02).References
1, Bataller R, Brenner DA. Liver fibrosis. J Clin Invest. 2005 Feb;115(2):209-18. doi: 10.1172/JCI24282. Erratum in: J Clin Invest. 2005 Apr;115(4):1100
2, Petitclerc L, Sebastiani G, Gilbert G, Cloutier G, Tang A. Liver fibrosis: Review of current imaging and MRI quantification techniques. J Magn Reson Imaging. 2017 May;45(5):1276-1295. doi: 10.1002/jmri.25550
3, Edzes HT, Samulski ET. Measurement of cross - relaxation effects in proton NMR spin-lattice relaxation of water in biological-systems –hydrated collagen and muscle. J. Magn. Reson. 1978; 31(2): 207–229.
4, Yarnykh VL, Tartaglione EV, Ioannou GN. Fast macromolecular proton fraction mapping of the human liver in vivo for quantitative assessment of hepatic fibrosis. NMR Biomed. 2015 Dec;28(12):1716-25. doi: 10.1002/nbm.3437
5, Portnoy S, Stanisz GJ. Modeling pulsed magnetization transfer. Magn Reson Med. 2007 Jul;58(1):144-55. doi: 10.1002/mrm.21244
6, Yarnykh VL. Fast macromolecular proton fraction mapping from a single off-resonance magnetization transfer measurement. Magn Reson Med. 2012 Jul;68(1):166-78. doi: 10.1002/mrm.23224
7, Soellinger M, Langkammer C, Seifert-Held T, Fazekas F, Ropele S. Fast bound pool fraction mapping using stimulated echoes. Magn Reson Med. 2011 Sep;66(3):717-24. doi: 10.1002/mrm.22846
8, Battiston M, Schneider T, Grussu F, Yiannakas MC, Prados F, De Angelis F, Gandini Wheeler-Kingshott CAM, Samson RS. Fast bound pool fraction mapping via steady-state magnetization transfer saturation using single-shot EPI. Magn Reson Med. 2019 Sep;82(3):1025-1040. doi: 10.1002/mrm.27792
9, Hou J, Wong VW, Jiang B, Wang YX, Wong GL, Chan AW, Chu WC, Chen W. Macromolecular proton fraction mapping based on spin-lock magnetic resonance imaging. Magn Reson Med. 2020 Jul 6. doi: 10.1002/mrm.28362
10, Kleiner DE, Brunt EM, Van Natta M, Behling C, Contos MJ, Cummings OW, Ferrell LD, Liu YC, Torbenson MS, Unalp-Arida A, Yeh M, McCullough AJ, Sanyal AJ; Nonalcoholic Steatohepatitis Clinical Research Network. Design and validation of a histological scoring system for nonalcoholic fatty liver disease. Hepatology. 2005 Jun;41(6):1313-21. doi: 10.1002/hep.20701
11, Chen W, Chan Q, Wáng YX. Breath-hold black blood quantitative T1rho imaging of liver using single shot fast spin echo acquisition. Quant Imaging Med Surg. 2016 Apr;6(2):168-77. doi: 10.21037/qims.2016.04.05
Figures