0313
High-risk Esophageal Varices Screening with MR Elastography in Patients with Cirrhosis1Department of Radiology, Mayo Clinic, Rochester, MN, United States, 2Division of Gastroenterology and Hepatology, Mayo Clinic, Rochester, MN, United States, 3The Third Affiliated Hospital of Sun Yat-sen University, Guangzhou, China
Synopsis
In patients with end-stage chronic liver diseases, esophageal varices can be a life-threatening complication of portal hypertension because of bleeding risk. In this study, we explored the role of MR elastography (MRE) in stratifying portal hypertension severity and predicting high-risk varices by using upper gastrointestinal endoscopy as the reference standard. We concluded that a composite model including spleen size and stiffness plus liver stiffness and platelet count more accurately predicts the presence of high-risk varices, and thus could reduce unnecessary endoscopies more precisely than using liver stiffness and platelet count alone.
Introduction:
Despite significant advances in clinical and endoscopic management, esophageal variceal bleeding still carries a high mortality rate of 10-20%. Esophagogastroduodenoscopy (EGD) is currently the recommended surveillance modality to screen for high-risk esophageal varices. Current AASLD guideline recommends using platelet count (PLT>150 cells x103/μl) and liver stiffness measurement (LSM<20kPa) by ultrasound-based elastography to avoid unnecessary endoscopies (1,2). There is an emerging consensus that magnetic resonance elastography (MRE) is the most reliable method for detecting and staging liver fibrosis (3-6) and identifying patients at risk for hepatic decompensation (7). We aimed to develop a MRE-based risk stratification model to identify patients who can safely avoid invasive endoscopy. Moreover, through providing an estimation of PHTN severity, improve patients’ longitudinal management.Methods:
We retrospectively identified 1,167 patients who had MRE-assessed LSM no less than 5 kPa, which is the recommended threshold for cirrhosis diagnosis (8). 457 of these patients had EGD within one year and platelet count (PLT) within one month of the MRE exam. 211 of 457 patients had spleen stiffness measurement (SSM) and spleen size (SSize) available in addition to LSM and PLT. Kruskal-Wallis comparisons were performed with select clinical, laboratory, and imaging data between low and high-risk varices. LSM, PLT, SSM and SSize were identified as independent variables for detecting high-risk varices. Patients were randomized into a 3:1 ratio to either a training or validation cohort for decision tree and logistic regressions. The severity of esophageal varices was classified into four grades based on the EGD findings and variceal bleeding history: Grade 0 (No varices), Grade1 (small varices), Grade 2 (large varices or high-risk small varices), Grade 3 (active or prior variceal bleeding). Grades 0 and 1 were considered as a low-risk group, while grades 2 and 3 as a high-risk group which would require prophylaxis against variceal bleeding (1).Results:
Table 1 summarizes characteristics of the patient profiles and the nonparametric comparison results. The most common etiology of the underlying liver disease was metabolic-associated fatty liver disease (34.9%), and the prevalence of high-risk varices was 28.9%.Figure 1 demonstrates example MRE wave images, elatograms, MRI anatomic images, and EGD images in two patients.
Prediction of high-risk varices using decision tree and nominal logistic regression (NLR):
Table 2 summarizes the predictive models for dichotomous outcome. Using the decision tree model, LSM<6.29 kPa and PLT≥150 x103/μl was associated with a <5% probability of having high-risk varices. The NLR models were finely tuned after careful training and validation. The cut-off probabilities of 0.16-0.10 were obtained considering a false-negative rate of 5% or less. Every patient with a computed probability less than the cut-offs may avoid invasive endoscopy with a predictive 5% chance of having high-risk varices.
Prediction of varices severity using ordinal logistic regression (OLR):
Figure 2 and Table 3 summarize the predictive models for 4 grade outcomes. The training model that included four predictors (LSM, PLT, SSM, SSize) showed a moderate to good performance (AUC 0.70 – 0.80) in stratifying varices severity. By removing LSM and PLT as predictors, discriminative ability did not change significantly (we observed high collinearity between PLT and SSM or SSize). Instead, combining only LSM and platelet counts showed the lowest discriminative ability with poor to moderate diagnostic performance (AUC 0.60 - 0.70). This trend remains the same in the validation cohort. Overall, models that involved splenic parameters demonstrated a significantly higher accuracy in distinguishing the high-risk group and assessing severity of varices than that of LSM and PLT only (p<0.05 for all). In multivariate analysis, both SSM and SSize showed a higher impact on variceal grade assessment than that of PLT and LSM (likelihood ratio χ2 = 18.7, 8.9 versus 4.5, 1.1 in Table 3). There was no significant difference in diagnostic accuracy between two- and four-parameter models that involve splenic parameters (SSM+SSize vs. PLT+LSM+SSM+SSize).
Discussion:
This study suggested that MRE-based stiffness measurement of liver and spleen, combined with the platelet count and spleen size is promising for stratifying varices severity and identifying patients with low-risk varices to reduce the number of unnecessary invasive screening endoscopies. Our study also suggested that splenic parameters (SSM, SSize) played the most important role in detecting high-risk varices. From an imaging perspective, vascular abnormalities induced by portal hypertension are heterogeneous in their distribution and pattern. EGD findings only reflect the severity of esophageal varices but not the overall severity of portal hypertension. The gold standard for quantifying portal hypertension is the invasive portal pressure measurement which is not generally indicated.Some limitations of this study were: 1) no portal pressure measurement; 2) the reliability of 3D SSM is superior to 2D SSM that is used here, Therefore, future works need to consider multiparametric liver/spleen 3D-MRE for estimating PHTN severity.
Conclusion:
MRE-based assessment of the shear stiffness of the spleen shows promise for predicting the absence of high-risk varices in patients with advanced liver disease and is more accurate than measurement of liver stiffness and platelet count alone, potentially allowing for use of fewer endoscopy procedures in management of these patients. The multiparametric predictive model developed in this study has potential to improve longitudinal management of patients with portal hypertension.Acknowledgements
This work has been supported by grant funding from the National Institutes of Health (R01 DK059615, UH3 AA026887, R37 EB001981, R01 EB017197), the US Department of Defense (W81XWH-19-1-0583-01), and the Mayo Clinic.References
1. de Franchis R, Baveno VIF. Expanding consensus in portal hypertension: Report of the Baveno VI Consensus Workshop: Stratifying risk and individualizing care for portal hypertension. J Hepatol. 2015;63(3):743-52.
2. Garcia-Tsao G, Sanyal AJ, Grace ND, et al.Prevention and management of gastroesophageal varices and variceal hemorrhage in cirrhosis. Hepatology. 2007;46(3):922-38.
3. Imajo K, Kessoku T, Honda Y, et al. Magnetic Resonance Imaging More Accurately Classifies Steatosis and Fibrosis in Patients With Nonalcoholic Fatty Liver Disease Than Transient Elastography. Gastroenterology. 2016 Mar;150(3):626-637.e7.
4. Singh S, Venkatesh SK, Loomba R, et al. Magnetic resonance elastography for staging liver fibrosis in non-alcoholic fatty liver disease: a diagnostic accuracy systematic review and individual participant data pooled analysis. Eur Radiol. 2016;26(5):1431-1440.
5. Cui J, Ang B, Haufe W, et al.Comparative diagnostic accuracy of magnetic resonance elastography vs. eight clinical prediction rules for non-invasive diagnosis of advanced fibrosis in biopsy-proven non-alcoholic fatty liver disease: a prospective study. Aliment Pharmacol Ther. 2015 Jun;41(12):1271-80.
6. Loomba R, Wolfson T, Ang B, et al. Magnetic resonance elastography predicts advanced fibrosis in patients with nonalcoholic fatty liver disease: a prospective study. Hepatology (Baltimore, Md.). 2014 Dec;60(6):1920-1928.
7. Asrani SK, Talwalkar JA, Kamath PS, et al. Role of magnetic resonance elastography in compensated and decompensated liver disease. J Hepatol. 2014;60(5):934-9.
8. Idilman IS, Li J, Yin M, et al. MR elastography of liver: current status and future perspectives. Abdom Radiol (NY). 2020. Nov;45(11):3444-3462.
Figures
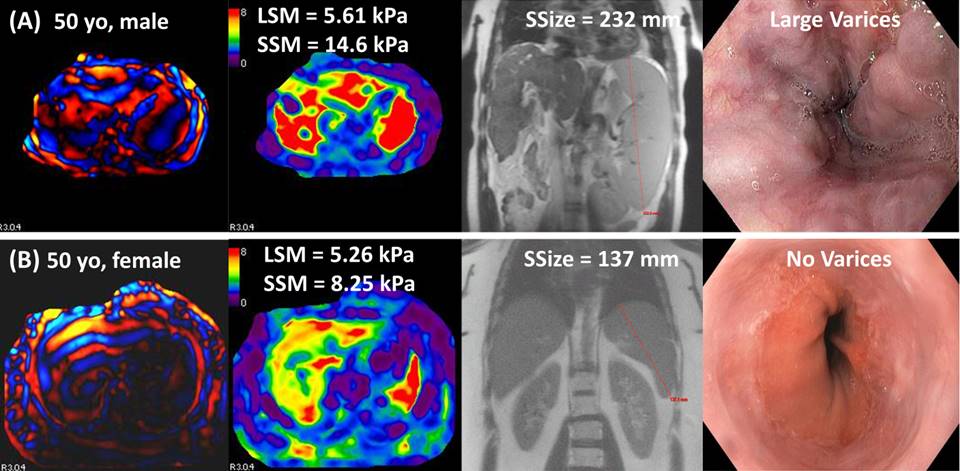
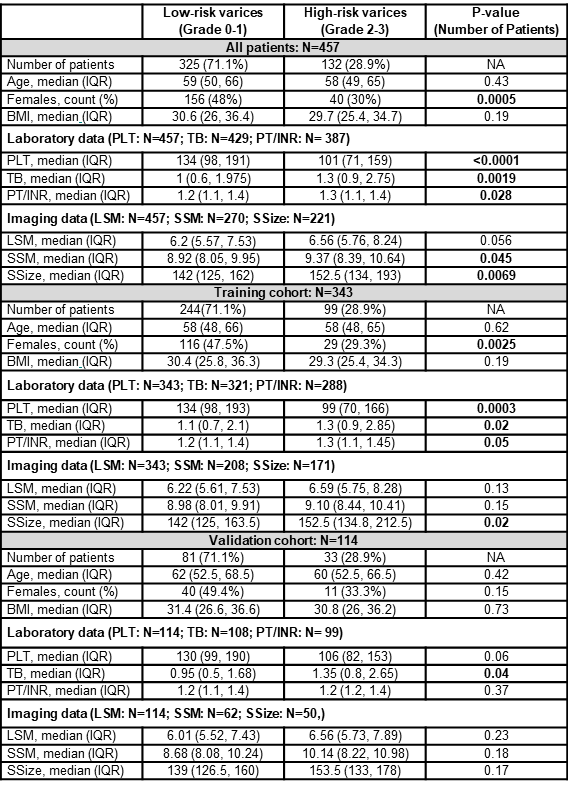
Table 1. Characteristics of clinical, laboratory and imaging data of patient cohorts.
Abbreviations: BMI (kg/m2): body mass index; LSM (kPa): liver stiffness measurement; SSM (kPa): spleen stiffness measurement; SSize (mm): spleen size; PT/INR: prothrombin time and international normalized ratio; PLT (cells x103/μl): platelet count; TB (mg/dL): total bilirubin
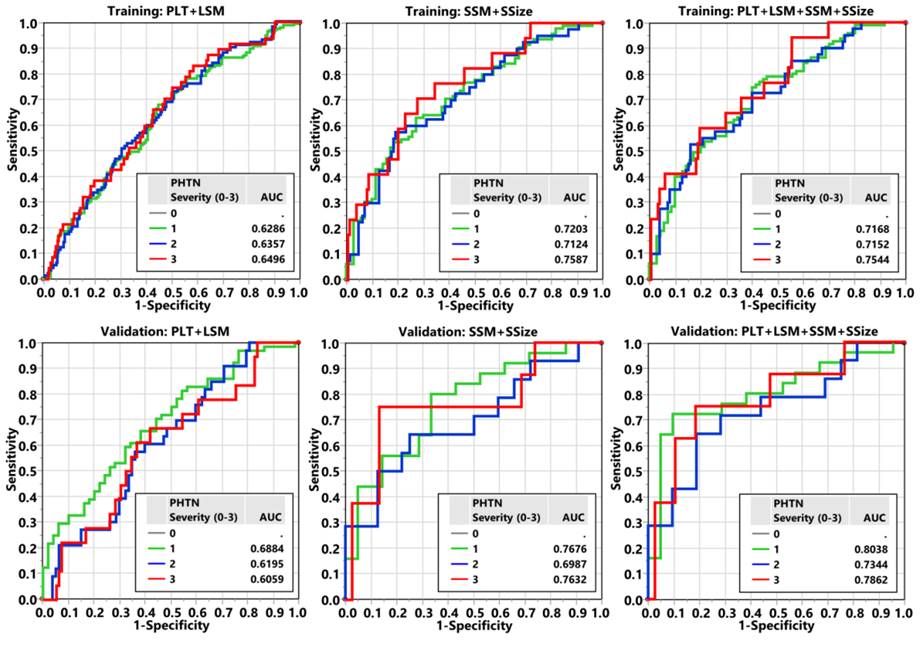
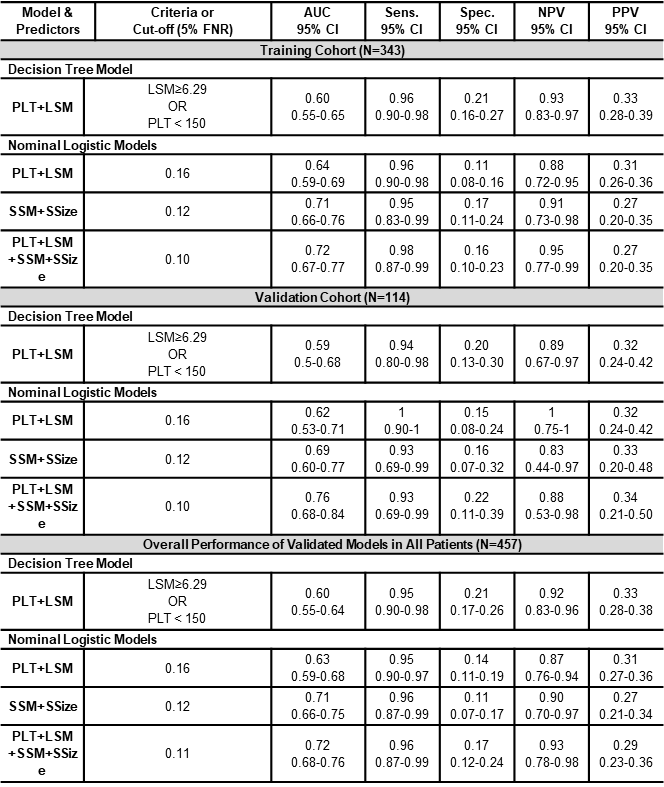
Table 2. Diagnostic performance of decision tree and nominal logistic models in distinguishing high-risk varices that need intervention with 5% false-negative rate (FNR).
Abbreviations: PLT (cells x103/μl): platelet count; LSM (kPa): liver stiffness measurement; SSM (kPa): spleen stiffness measurement; SSize (mm): spleen size
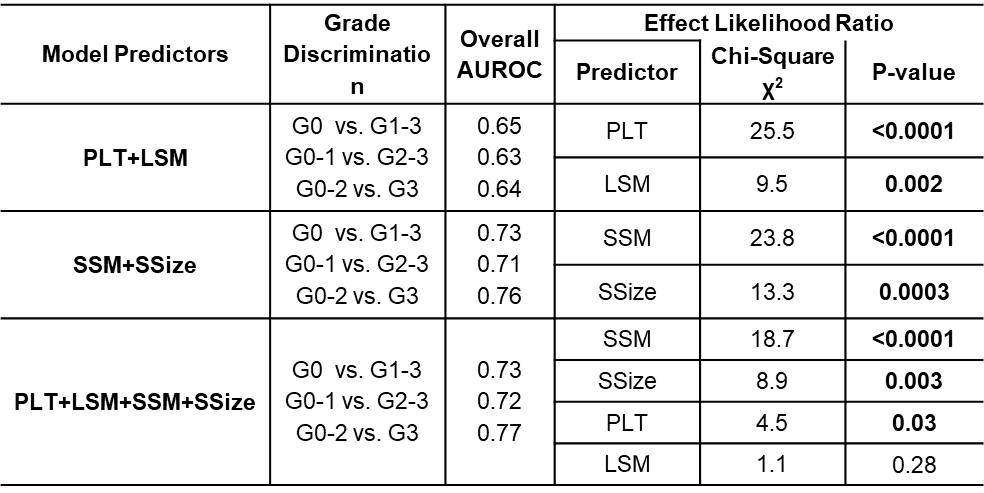
Table 3. Diagnostic performance of ordinal logistic models chosen after training and validating in predicting variceal grade severity (0-3) over the whole patient cohort.
Abbreviations: PLT (cells x103/μl): platelet count; LSM (kPa): liver stiffness measurement; SSM (kPa): spleen stiffness measurement; SSize (mm): spleen size