0312
Physics-informed deep neural network for tri-exponential intravoxel incoherent motion fitting in non-alcoholic fatty liver disease.1Department of Radiology and Nuclear Medicine, Amsterdam UMC, location AMC, Amsterdam, Netherlands, 2Department of Internal and Vascular Medicine, Amsterdam UMC, location AMC, Amsterdam, Netherlands, 3Department of Pathology, Amsterdam UMC, location AMC, Amsterdam, Netherlands
Synopsis
In this study we have developed an unsupervised physics-informed deep neural network (IVIM3-NET) to fit a tri-exponential model to intravoxel incoherent motion (IVIM) data from 35 non-alcoholic fatty liver disease (NAFLD) patients. Diagnostic performance was compared to a tri-exponential least squares (LSQ) fit. Visually, IVIM3-NET showed high-quality parameter maps with less noise than the LSQ-fit. IVIM3-NET showed slightly higher correlations between fit parameters and histology and more significant differences between levels of fibrosis and inflammation than the LSQ-fit. Correlations between f2 and fibrosis and inflammation grade, potentially highlighting NAFLD-induced vascular changes, warrant further investigation of the IVIM3-NET in NAFLD patients.
Introduction
Non-alcoholic fatty liver disease (NAFLD) is characterised by accumulation of lipids within hepatocytes, potentially causing hepatic ballooning, inflammation, and fibrosis[1]. The increasing prevalence of NAFLD[2] has brought a growing interest in non-invasive techniques for detecting the presence and severity of disease[3]. Intravoxel incoherent motion (IVIM) imaging has been proposed as a biomarker for assessing and staging NAFLD, particularly fibrosis[4]. While IVIM is typically fitted using bi-exponential models, the liver’s complex structure shows increased fit accuracy using tri-exponential models[5–7]. Herein, an extra exponent is added to improve fitting of rapid signal decay at very low b-values:S(b)/S(b=0s/mm2)=(1-f1-f2)*exp(-b*D)+f1*exp(-b*D1)+f2*exp(-b*D2)
where diffusion(D), slow(D*1) and fast pseudo-diffusion(D*2), and slow(f1) and fast perfusion fraction(f2) are estimated. Conventional nonlinear least squares (LSQ) fitting methods typically lead to noisy parameter maps. Recent work has shown considerable improvements in parameter map accuracy using an unsupervised physics-informed deep neural network for fitting the bi-exponential IVIM model (IVIM-NET)[8,9]. The aim of this study was to develop a similar approach for fitting a tri-exponential IVIM model and assess diagnostic performance compared to the conventional LSQ-fit in NAFLD patients.
Methods
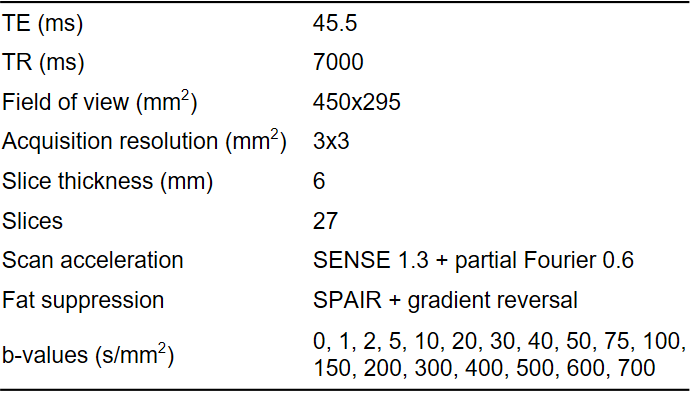
Thirty-five patients from the Amsterdam NAFLD cohort (ANCHOR) with known hepatic steatosis on ultrasound, BMI>25 and elevated ALAT/ASAT were included. All individuals underwent an MRI scan (3T Philips Ingenia) and liver biopsy. The IVIM scan consisted of a free-breathing multi-slice diffusion-weighted single-shot echo-planar imaging sequence. Scan parameters are listed in Table 1. The entire liver was manually segmented. A tri-exponential equivalent to IVIM-NET (IVIM3-NET) and LSQ tri-exponential model were fitted voxel-wise for segmented voxels.The LSQ-fit was fitted in three stages: (1) D and S0 were determined from a mono-exponential fit to data with b≥150s/mm2; (2) D*1 and f1 were determined for 150s/mm2≥b≥15s/mm2 (after subtracting (1); (3) D*2 and f2 were obtained for b≤30s/mm2 (idem). Constraints were implemented such that 0<D<5×10⁻³mm2/s, 5×10⁻³<D*1<80×10-3mm2/s, 60×10-3<D*2<0.5mm2/s and perfusion fractions were positive and summed to 1.
We developed IVIM3-NET based on IVIM-NET[9]: a fully-connected 4-layer network per IVIM parameter and a physics-informed loss function minimizing the root-mean-square error between input voxel signals and predicted signal decay. IVIM3-NET accommodated a tri-exponential fit in its loss function. A three-stage scheme similar to the LSQ-fit was implemented to guide training initialisation, training 15 epochs per parameter set. The network estimating D was trained considering b≥150s/mm2 while freezing network weights for other parameters. Then networks estimating D*1 and f1 were trained from data with 150s/mm2≥b≥15 s/mm2, etc. After these 3x15 initialisation epochs, the entire pre-trained network was trained normally and as a whole with all parameters unfrozen until the stopping criterion was met (no improvement for 10 consecutive epochs).
Histology specimens were analysed according to SAF[10] for levels of steatosis (0-3), ballooning (0-2), inflammation (0-2) and fibrosis (0-4). Correlations between IVIM and histology were assessed according to Spearman’s rank correlation. Kruskal-Wallis (KW) tests, followed by Dunn’s post-hoc analysis where appropriate, were used to assess difference in medians between histological grades for IVIM parameters.
Results
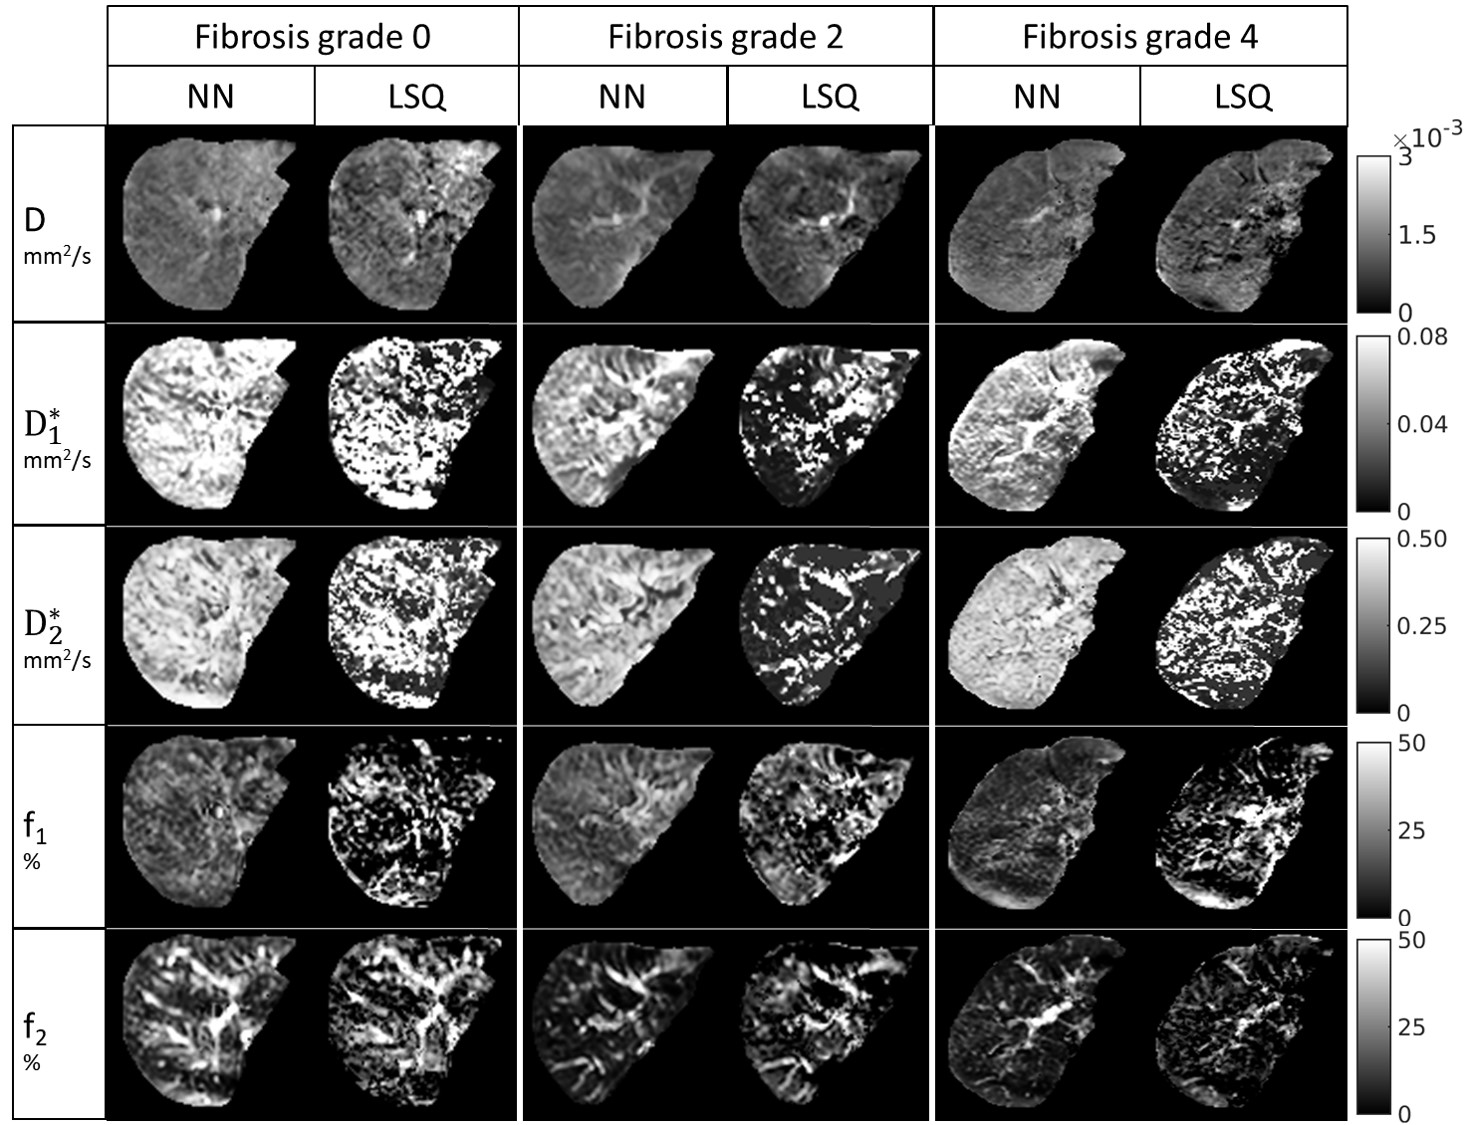
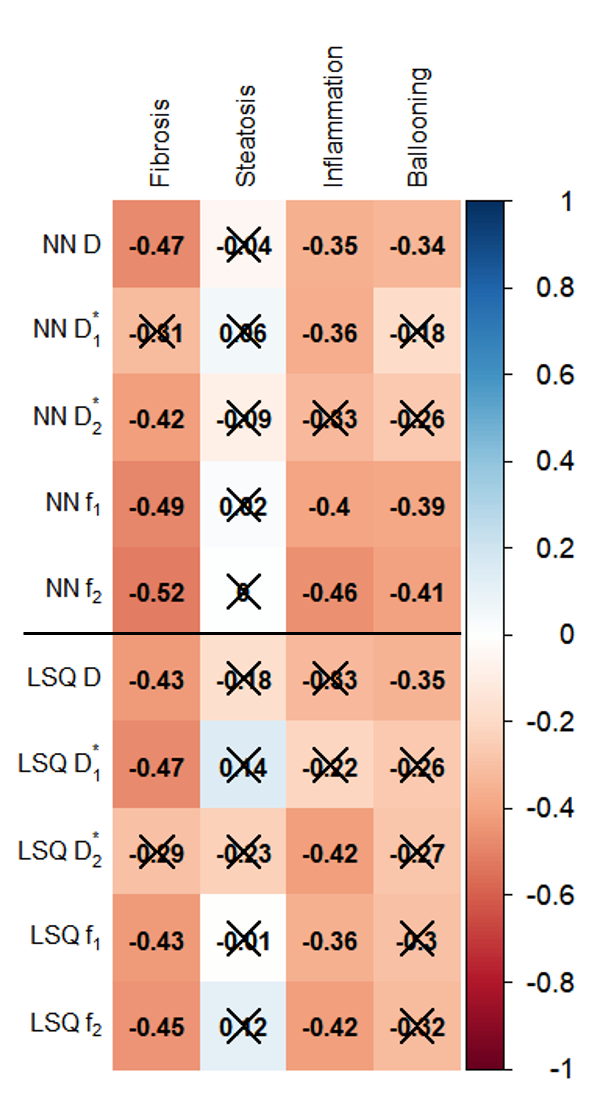
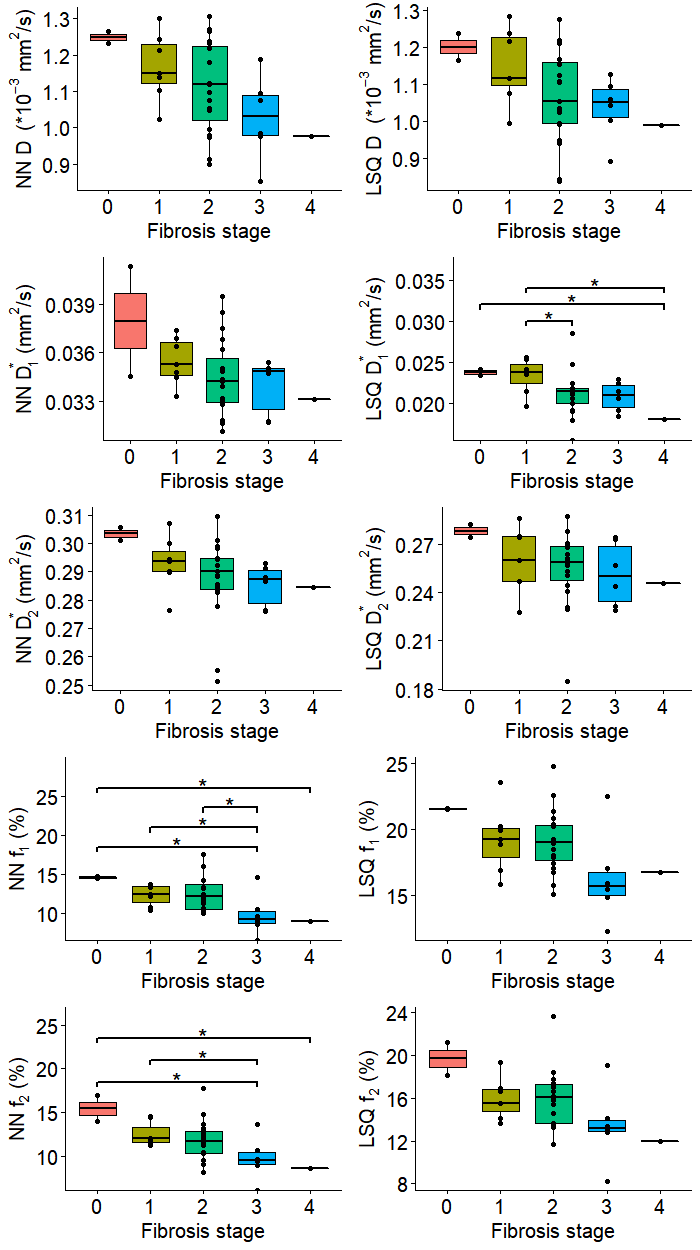
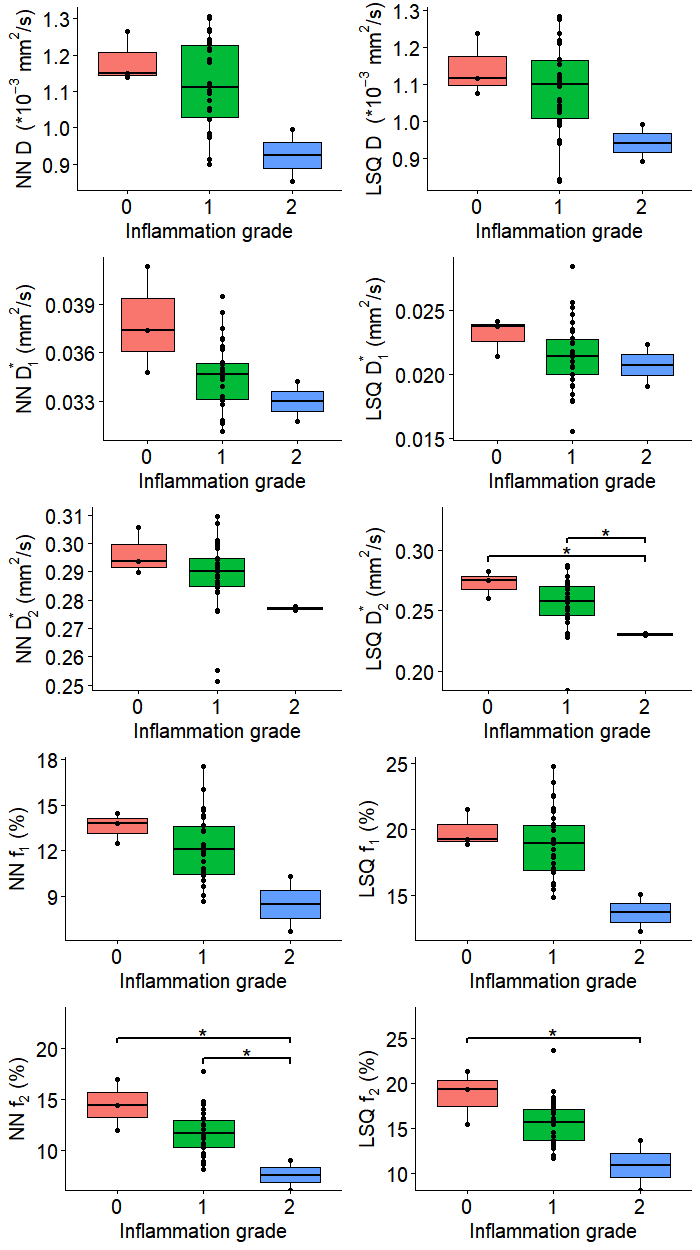
Example datasets of tri-exponential IVIM parameters for patients with varying levels of fibrosis can be found in Fig.1. Visual assessment revealed improvement in noise levels for all IVIM parameters using IVIM3-NET compared to the LSQ-fit. Furthermore, f2 visually decreased with increasing fibrosis grade. IVIM3-NET and LSQ-fit both showed significant correlations with histology, with slightly stronger correlations for the IVIM3-NET (Fig.2). KW tests showed significant differences in medians between fibrosis and f1 and f2 for the IVIM3-NET and D*1 for the LSQ-fit (Fig.3), as well as between inflammation grade and f2 (Fig.4) for both IVIM3-NET and LSQ-fit.Discussion
In this study we implemented IVIM3-NET which fitted a tri-exponential model to IVIM data and showed its clinical relevance. IVIM3-NET provided parameter maps that were substantially less noisy than the LSQ-fit, potentially allowing for assessment of qualitative images at an individual patient level. Furthermore, IVIM3-NET had slightly higher correlation between fit parameters and histology and more significant differences between histological grades. KW tests showed a significant difference in medians between fibrosis and IVIM3-NET f1 and f2, as well as inflammation and IVIM3-NET f2. Although LSQ-fit also showed similar correlations with D* parameters, the use of IVIM3-NET f parameter maps is more desirable, as D* maps were noisy, thus raising questions about reliability and clinical applicability.In this cohort we found the strongest correlations between f2 and fibrosis and to a lesser extent inflammation grade, thus providing clinically relevant information exclusively attainable from a tri-exponential fit and previously unexplored in patients with NAFLD. The precise origins of both perfusion components are yet unclear, however, f1 could potentially be attributed to slower incoherent capillary perfusion typically aimed at with IVIM whereas f2 could account for rapid dephasing of coherent flow in opposing directions or laminar flow profiles in larger vessels[7]. NAFLD is known to lead to vascular changes, causing reduced liver perfusion even in the absence of cirrhosis[11]. This phenomenon may explain the decreasing f1 and f2 values as disease severity increases.
Conclusion
The novel IVIM3-NET enabled generation of high-quality parameter maps of tri-exponential IVIM data in NAFLD patients. Promising correlations between f2 and fibrosis and inflammation grade, potentially caused by NAFLD-induced vascular changes, warrant further investigation of the tri-exponential IVIM model in NAFLD patients.Acknowledgements
MN is supported by a personal ZONMW-VIDI grant 2013 [016.146.327]. The work was also partly supported by an IMI 2 LITMUS grant (777377) and a Le Ducq consortium grant (17CVD01). AGH is supported by the Amsterdam UMC fellowship, the Gilead Research Scholarship and Health~Holland.References
1. Parthasarathy G, Revelo X, Malhi H. Pathogenesis of Nonalcoholic Steatohepatitis: An Overview. Hepatol Commun. 2020;4(4):478-492. doi:10.1002/hep4.1479
2. Younossi ZM, Koenig AB, Abdelatif D, Fazel Y, Henry L, Wymer M. Global epidemiology of nonalcoholic fatty liver disease-Meta-analytic assessment of prevalence, incidence, and outcomes. Hepatology. 2016;64(1):73-84. doi:10.1002/hep.28431
3. Stefan N, Häring HU, Cusi K. Non-alcoholic fatty liver disease: causes, diagnosis, cardiometabolic consequences, and treatment strategies. Lancet Diabetes Endocrinol. 2019;7(4):313-324. doi:10.1016/S2213-8587(18)30154-2
4. Li YT, Cercueil J-P, Yuan J, Chen W, Loffroy R, Wáng YXJ. Liver intravoxel incoherent motion (IVIM) magnetic resonance imaging: a comprehensive review of published data on normal values and applications for fibrosis and tumor evaluation. Quant Imaging Med Surg. 2017;7(1):59-78. doi:10.21037/qims.2017.02.03
5. Cercueil J-P, Petit J-M, Nougaret S, et al. Intravoxel incoherent motion diffusion-weighted imaging in the liver: comparison of mono-, bi- and tri-exponential modelling at 3.0-T. Eur Radiol. 2015;25(6):1541-1550. doi:10.1007/s00330-014-3554-6
6. Chevallier O, Zhou N, Cercueil J, He J, Loffroy R, Wáng YXJ. Comparison of tri‐exponential decay versus bi‐exponential decay and full fitting versus segmented fitting for modeling liver intravoxel incoherent motion diffusion MRI. NMR Biomed. 2019;32(11):1-11. doi:10.1002/nbm.4155
7. Riexinger A, Martin J, Wetscherek A, et al. An optimized b‐value distribution for triexponential intravoxel incoherent motion (IVIM) in the liver. Magn Reson Med. 2020;(June):mrm.28582. doi:10.1002/mrm.28582
8. Barbieri S, Gurney-Champion OJ, Klaassen R, Thoeny HC. Deep learning how to fit an intravoxel incoherent motion model to diffusion-weighted MRI. Magn Reson Med. 2020;83(1):312-321. doi:10.1002/mrm.27910
9. Kaandorp MPT, Barbieri S, Klaassen R, et al. Improved unsupervised physics-informed deep learning for intravoxel-incoherent motion modeling and evaluation in pancreatic cancer patients. November 2020. http://arxiv.org/abs/2011.01689.
10. Bedossa P. Utility and appropriateness of the fatty liver inhibition of progression (FLIP) algorithm and steatosis, activity, and fibrosis (SAF) score in the evaluation of biopsies of nonalcoholic fatty liver disease. Hepatology. 2014;60(2):565-575. doi:10.1002/hep.27173
11. Pasarín M, Abraldes JG, Liguori E, Kok B, Mura V La. Intrahepatic vascular changes in non-alcoholic fatty liver disease: Potential role of insulin-resistance and endothelial dysfunction. World J Gastroenterol. 2017;23(37):6777-6787. doi:10.3748/wjg.v23.i37.6777
Figures