0311
Diagnostic Performance of Multiparametric Models Using Fat Fraction, Liver Stiffness, and T1 for Detection of Nonalcoholic Steatohepatitis1Department of Radiology, Mayo Clinic, Rochester, MN, United States, 2Gastroenterology and Hepatology, Mayo Clinic, Rochester, MN, United States, 3Anatomic Pathology, Mayo Clinic, Rochester, MN, United States, 4Division of Gastroenterology and Hepatology, Mayo Clinic, Rochester, MN, United States
Synopsis
NASH is traditionally diagnosed by liver biopsy, limited by subjective scoring and sampling error. This motivates identifying imaging-based biomarkers that might quantitatively characterize the pathophysiologic features of NASH. This prospective study established a streamlined imaging protocol for acquiring three candidate biomarkers ( fat fraction, liver stiffness, and T1 ) in a cohort of 66 patients with suspected NASH who underwent biopsy. The results indicate that a two-parameter model using fat fraction and liver stiffness has superior accuracy in diagnosing NASH, including ones that include the T1 relaxation time, which was found to have high collinearity with the fat fraction.
Introduction
Metabolically associated fatty liver disease (MAFLD, previously termed nonalcoholic fatty liver disease or NAFLD) affects 25% of the global population [1]. It is a leading cause of cirrhosis, transplantation, and cancer [2]. Nonalcoholic steatohepatitis (NASH) is an aggressive form of MAFLD marked by liver inflammation and hepatocellular injury, with or without fibrosis [3]. NASH is traditionally diagnosed by liver biopsy and is affected by sampling error. This motivates identifying imaging-based biomarkers that might be used in a multiparametric model to provide a quantitative and less-expensive method for diagnosing NASH. 6-point Dixon-based proton density fat fraction (PDFF) is a rapid, accurate, quantitative imaging biomarker [4]. MR elastography (MRE) liver stiffness measurement (LSM) has emerged as the most accurate noninvasive biomarker for detecting and grading fibrosis [5] and is also a candidate biomarker for diagnosing NASH [6]. T1 mapping has also been identified as a possible biomarker for NASH [7,8]. Therefore, it is reasonable to speculate that a multiparametric model incorporating these three biomarkers may be more effective in predicting the presence of NASH than any single biomarker [9]. The relationships among these imaging parameters and histopathologic features have not been well studied. This study aimed to explore the potential collinearity and information redundancy of these parameters to establish a streamlined imaging protocol for detecting NASH more efficiently. It compared the diagnostic accuracies of combinations of these imaging biomarkers for diagnosing NASH in patients with liver biopsy within one month of MRI/MRE examination.Methods
This was a prospective clinical trial (NCT02565446) of 66 patients with suspected or diagnosed MAFLD who underwent liver biopsy and non-contrast multiparametric MRI/MRE within 30 days at our institution. 16 of 66 patients had both baseline and 1-year follow-up biopsy and imaging. Biopsy results included a diagnosis of NASH (Y/N); steatosis, inflammation, and ballooning grades; and fibrosis stage. Implemented on several 1.5T MR imagers (GE Healthcare) across our institution, the imaging protocol contains 6-point Dixon imaging (IDEAL-IQ), MRE imaging (60-Hz spin-echo EPI 3D MRE), and T1 mapping (SMART1Map). Imaging parameters are illustrated in Figure 1. LSM and PDFF were measured as described by Allen et al. [10]. The T1 relaxation time of the liver was calculated using four slices that matched the MRE acquisition. We compared variations in four imaging parameters (R2* (1/T2*, the relaxation rates of observable or effective T2), PDFF, LSM, and T1) across different stages/grades of steatosis, inflammation, ballooning, fibrosis, and NASH diagnosis with Dunn’s or Kruskal-Wallis tests as appropriate. The correlations between PDFF, LSM, and T1 were also analyzed. We combined three imaging parameters (PDFF, LSM, and T1) in a nominal logistic model to diagnose NASH. Effect likelihood and odds ratio tests were performed to determine the impact of the three imaging parameters in predicting NASH. We compared AUROCs with the DeLong test for three predictive nominal logistic models using the following combinations: 1) PDFF+LSM+T1; 2) PDFF+LSM; 3) PDFF+T1.Results
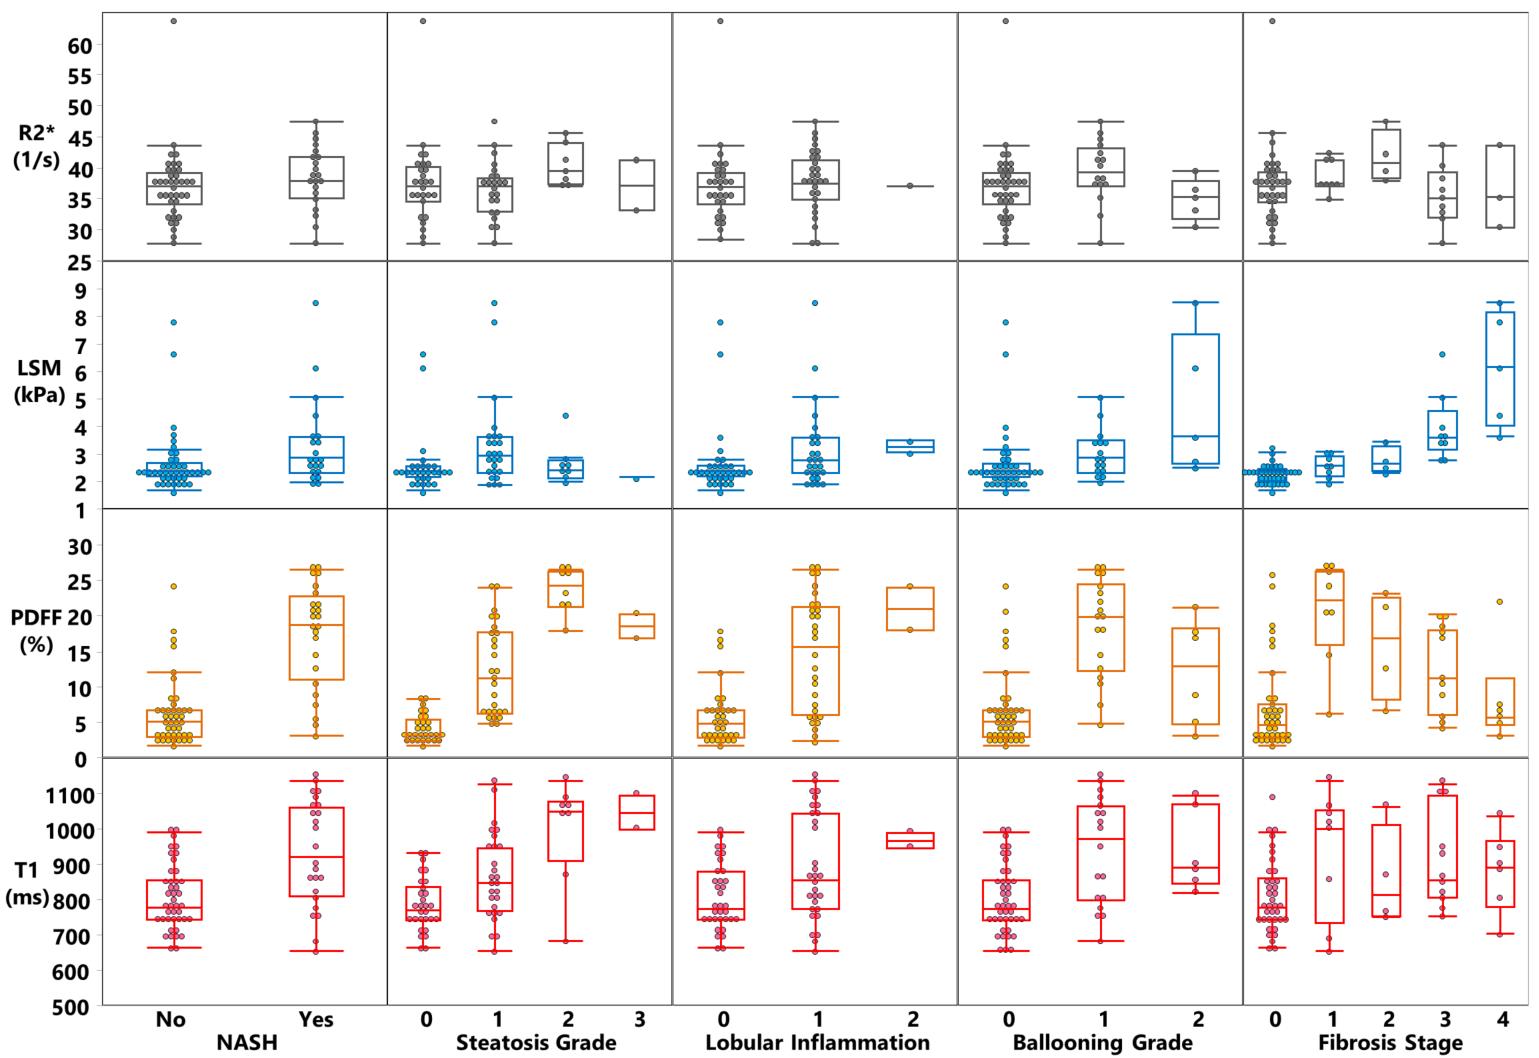
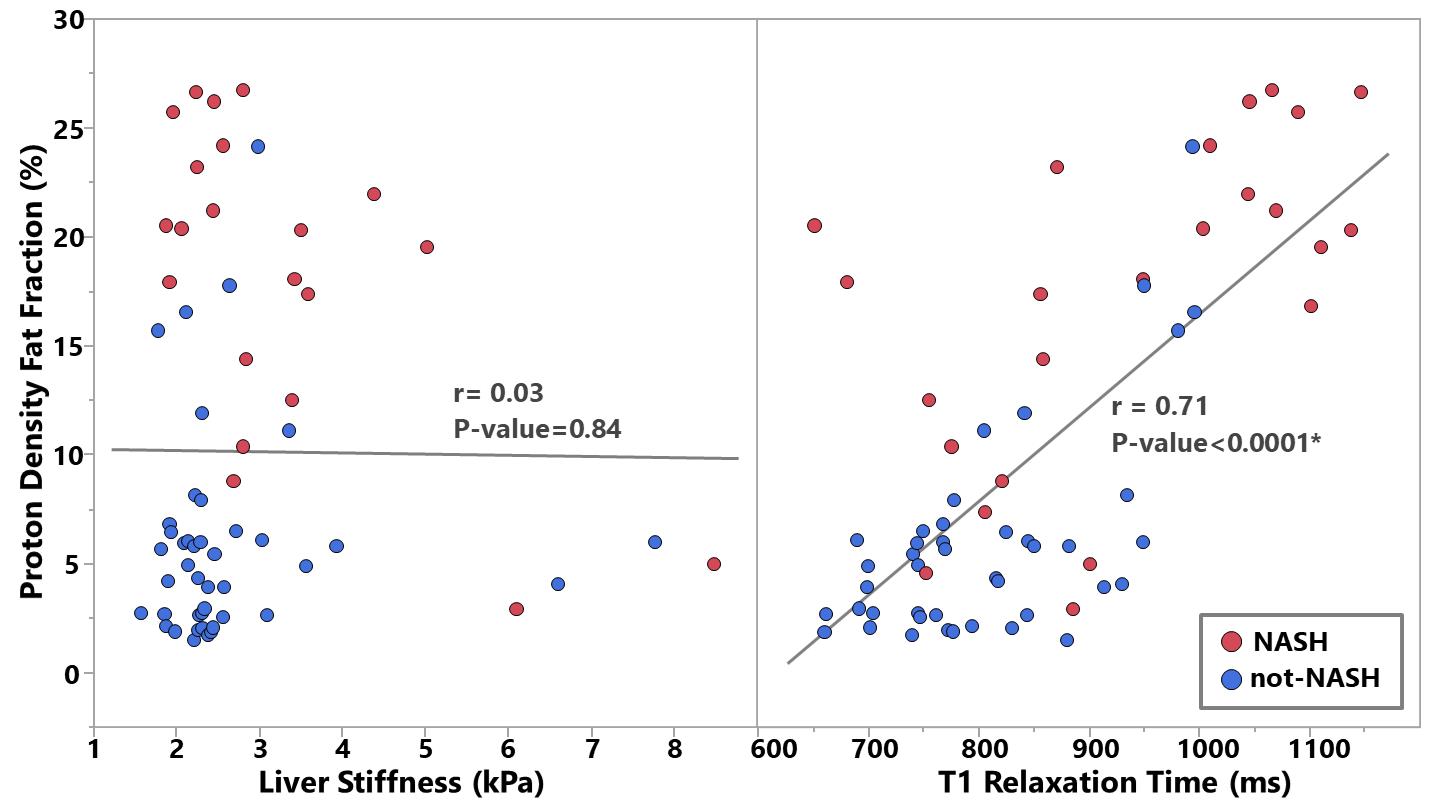
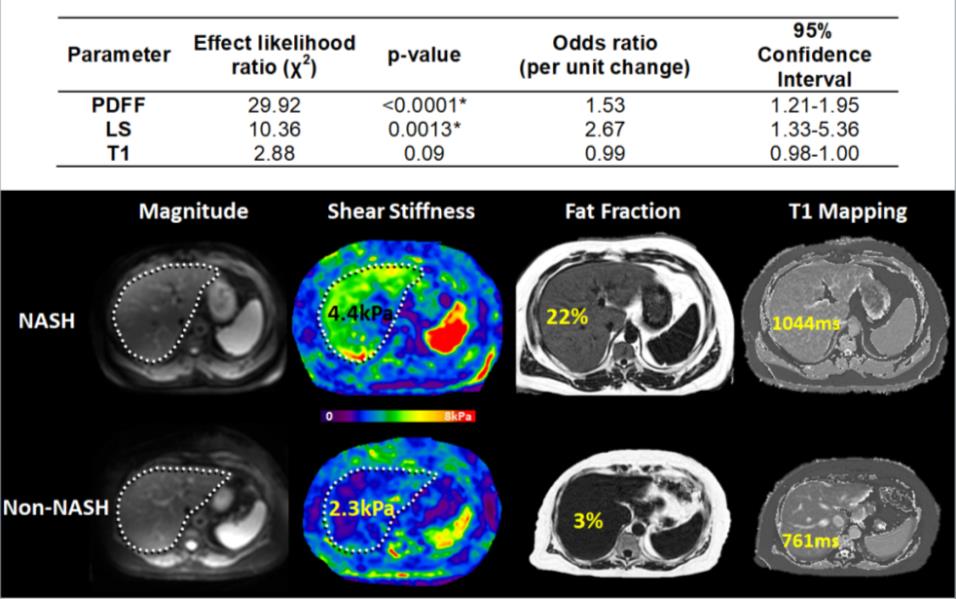
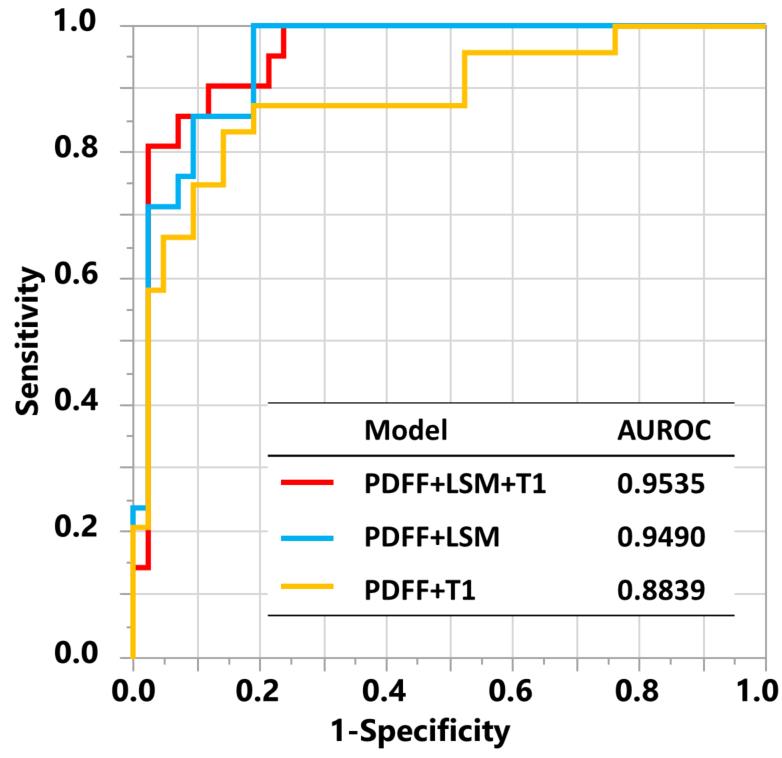
24 out of 66 biopsies were histologically diagnosed with NASH. The median PDFF, T1, and LSM were found to be different between the patients with and without NASH (Figure 1). Figure 2 includes multiple scatter plots demonstrating distributions of PDFF, LSM, T1, and R2* for NASH diagnosis and different grades/stages of steatosis, inflammation, ballooning, and fibrosis. In brief, PDFF, LSM, and T1 were significantly elevated in the NASH group. R2* was not associated with any pathophysiologic outcome and showed no evidence of clinically significant, iron-overloaded livers in this study cohort. PDFF and T1 both increased with steatosis grade, lobular inflammation, and ballooning grade. PDFF increased with early fibrosis and then decreased with severe fibrosis. T1 did not show an obvious trend with fibrosis. LSM increased with fibrosis grade. Figure 3 shows no significant relationship between LSM and PDFF (r=0.03, p=0.84) but excellent correlation between T1 and PDFF (r=0.71, p<0.0001). As illustrated in Figure 4, in the nominal logistic regression model, both PDFF and LSM show significant effects in diagnosing NASH (p<0.002 for all), while T1 does not affect the diagnostic performance significantly (p=0.09). The effect likelihood ratio (chi-square) of PDFF, LSM, and T1 is about 30,10, and 3, respectively. The odds ratio of T1 was also inferior to that of PDFF and LSM. Figure 5 shows that both PDFF+LSM+T1 and PDFF+LSM have comparably high accuracies of 0.95, while PDFF+T1 has a substantially decreased accuracy of 0.88 (p=0.08). All of the single-parameter models have inferior performance compared to the multiparameter models(Not shown).Discussion
Based on our group comparisons and correlation analyses, steatosis/PDFF does not affect LSM. The information provided by PDFF and LSM is independent with minimal redundancy. T1 highly correlates with PDFF and indicates potential collinearity with substantially overlapping information in NASH prediction. In our regression models, only PDFF and LSM had significant effects on NASH diagnosis. This supports the PDFF-T1 collinearity concern and explains the equivalent diagnostic accuracy in the PDFF+LSM models with and without the T1 measurements.Conclusion
Our study provides evidence that the two-parameter model using PDFF and MRE-based LSM is sufficient for a streamlined non-contrast liver imaging protocol dedicated to NASH diagnosis. Including the T1 relaxation time as an additional parameter does not provide additional information to improve diagnostic accuracy.Acknowledgements
NIH
R37 EB001981 (R.L.E.)
R01 EB017197 (M.Y.)
K23 DK115594 (A.M.A.)
References
1. Chaim, F.D.M., et al., Histological grading evaluation of non-alcoholic fatty liver disease after bariatric surgery: a retrospective and longitudinal observational cohort study. Sci Rep, 2020. 10(1): p. 8496.
2. Duma, N., R. Santana-Davila, and J.R. Molina, Non-Small Cell Lung Cancer: Epidemiology, Screening, Diagnosis, and Treatment. Mayo Clinic Proceedings, 2019. 94(8): p. 1623-1640.
3. Oseini, A.M. and A.J. Sanyal, Therapies in non-alcoholic steatohepatitis (NASH). Liver Int, 2017. 37 Suppl 1: p. 97-103.
4. Bonekamp, S., et al., Spatial distribution of MRI-Determined hepatic proton density fat fraction in adults with nonalcoholic fatty liver disease. J Magn Reson Imaging, 2014. 39(6): p. 1525-32.
5. Chen, J., et al., Early detection of nonalcoholic steatohepatitis in patients with nonalcoholic fatty liver disease by using MR elastography. Radiology, 2011. 259(3): p. 749-56.
6. Duma, N., R. Santana-Davila, and J.R. Molina, Non-Small Cell Lung Cancer: Epidemiology, Screening, Diagnosis, and Treatment. Mayo Clin Proc, 2019. 94(8): p. 1623-1640.
7. Yokoo, T., et al., Estimation of hepatic proton-density fat fraction by using MR imaging at 3.0 T. Radiology, 2011. 258(3): p. 749-59.
8. Kang, G.H., et al., Reproducibility of MRI-determined proton density fat fraction across two different MR scanner platforms. J Magn Reson Imaging, 2011. 34(4): p. 928-34.
9. Kim, B.H., et al., MR elastography for noninvasive assessment of hepatic fibrosis: experience from a tertiary center in Asia. J Magn Reson Imaging, 2011. 34(5): p. 1110-6.
10. Allen, A.M., et al., The Role of Three-Dimensional Magnetic Resonance Elastography in the Diagnosis of Nonalcoholic Steatohepatitis in Obese Patients Undergoing Bariatric Surgery. Hepatology, 2020. 71(2): p. 510-521.
Figures
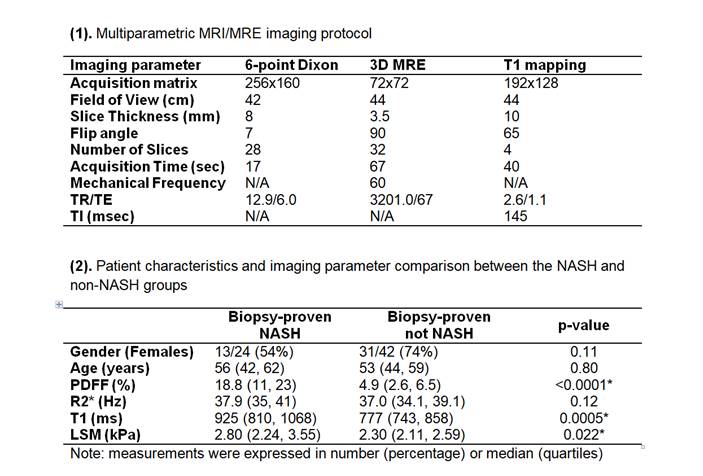
Figure 1. (1). Multiparametric MRI/MRE imaging protocol (2). Patient characteristics and imaging parameter comparison between the NASH and non-NASH groups. *:P-value<0.05 is considered statistically significant.