0306
Novel Stochastic 4D Flow Signatures of time-resolved 3D left atrial flow-field alterations in atrial fibrillation1Radiology, Northwestern University, Chicago, IL, United States, 2Biomedical Engineering, Northwestern University, Chicago, IL, United States, 3Medicine (Cardiology), Northwestern University, Chicago, IL, United States, 4Preventative Medicine, Northwestern University, Chicago, IL, United States
Synopsis
4D Flow MRI studies have shown an association between atrial fibrillation (AF) with altered left atrial (LA) blood flow. Nevertheless, LA flow dynamics changes can be complex (vortex flow, jets, stagnations, etc.). Existing quantitative 4D flow metrics only characterize parts of the overall complex interacting LA flow dynamics. Here, we propose a novel stochastic 4D Flow signature technique to quantify the unique composition of normal and altered LA flow dynamics utilizing the entire 4D three-directional velocity-field from 4D Flow MRI. We demonstrate the excellent reproducibility and the feasibility of the technique in quantifying distinctly altered LA signatures in AF patients.
Purpose
4D Flow MRI studies have shown an association of atrial fibrillation (AF) with altered left atrial (LA) blood flow1-3. However, LA blood flow dynamics can be complex, including an interacting mixture of vortex flow, jets, and stagnations. Existing quantitative 4D flow metrics (e.g., vorticity, stasis, kinetic energy) individually characterize only a partial component of the overall complex LA flow dynamics' alterations. A new stochastic 3D Flow signature technique was recently developed to quantify flow dynamics in the aorta while utilizing the entire 4D Flow MRI velocity field data4. This technique stochastically derives a unique profile (signature) of pairwise velocity vector disparities over the 3D aorta at a predefined time point (e.g., peak systole). Here, we extend this 3D technique to 4D to derive stochastic signatures of the time-resolved 3D velocity-field changes throughout the LA volume and the entire systole. This study aimed to evaluate 1) the feasibility and reproducibility of the proposed technique in healthy controls. 2) its potential in detecting altered signatures in AF patients versus controls.Methods
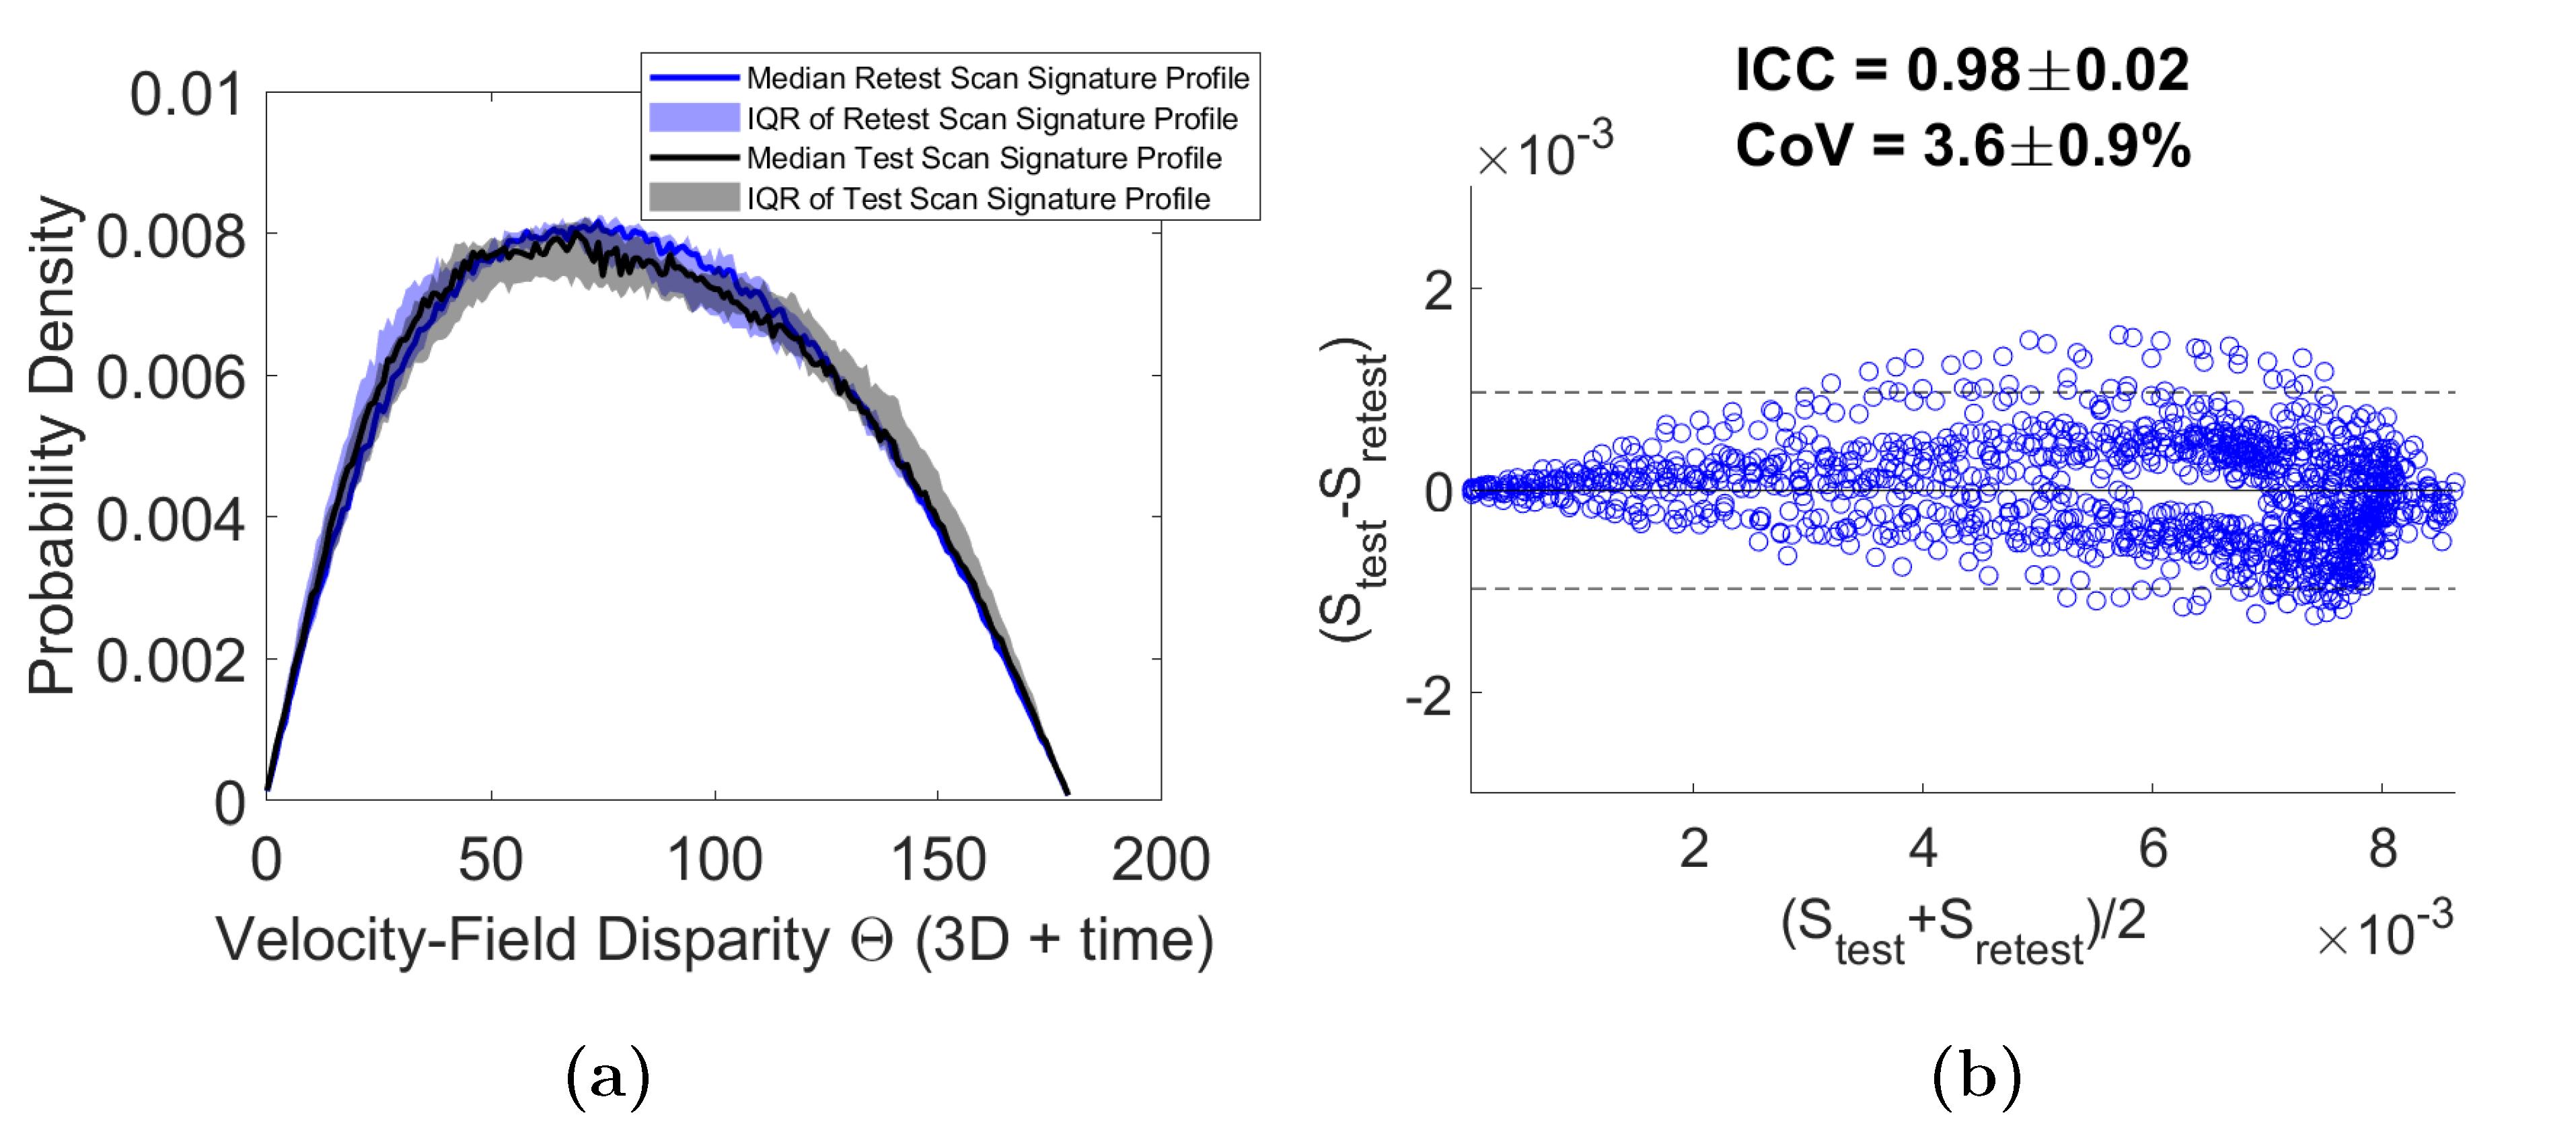
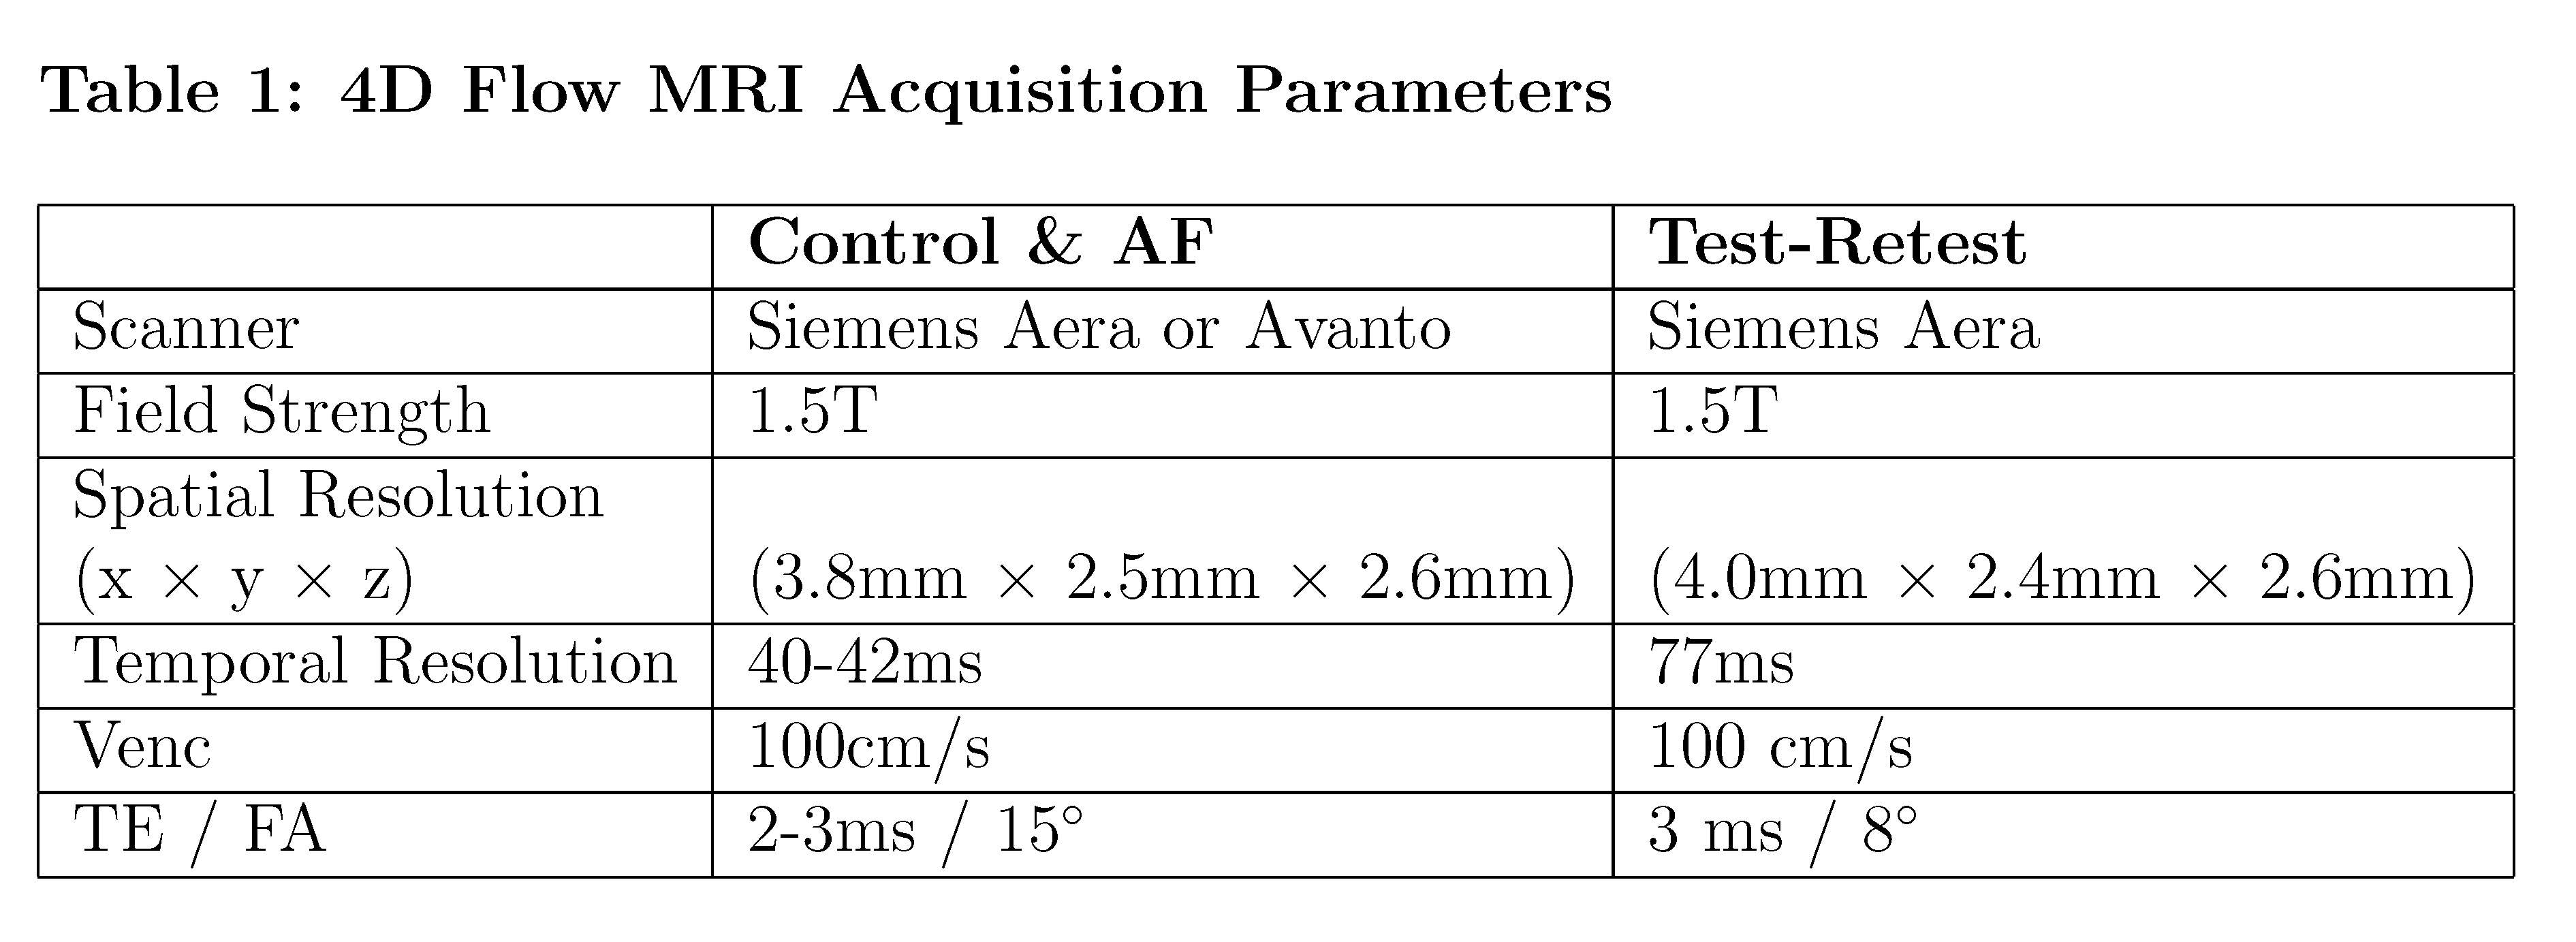
We analyzed left atrial 4D Flow MRI scans from 40 subjects consisting of 30 AF patients (Age=63±9 years, 8 women) and 10 healthy controls (Age=68±2 years, 5 women, age p-value=0.07) from an ongoing IRB-approved study. To test reproducibility, 7 healthy volunteers (Age=64±17 years, 3 women) underwent test-retest 4D Flow MRI within 2 to 3 weeks.Stochastic 4D Flow Signatures
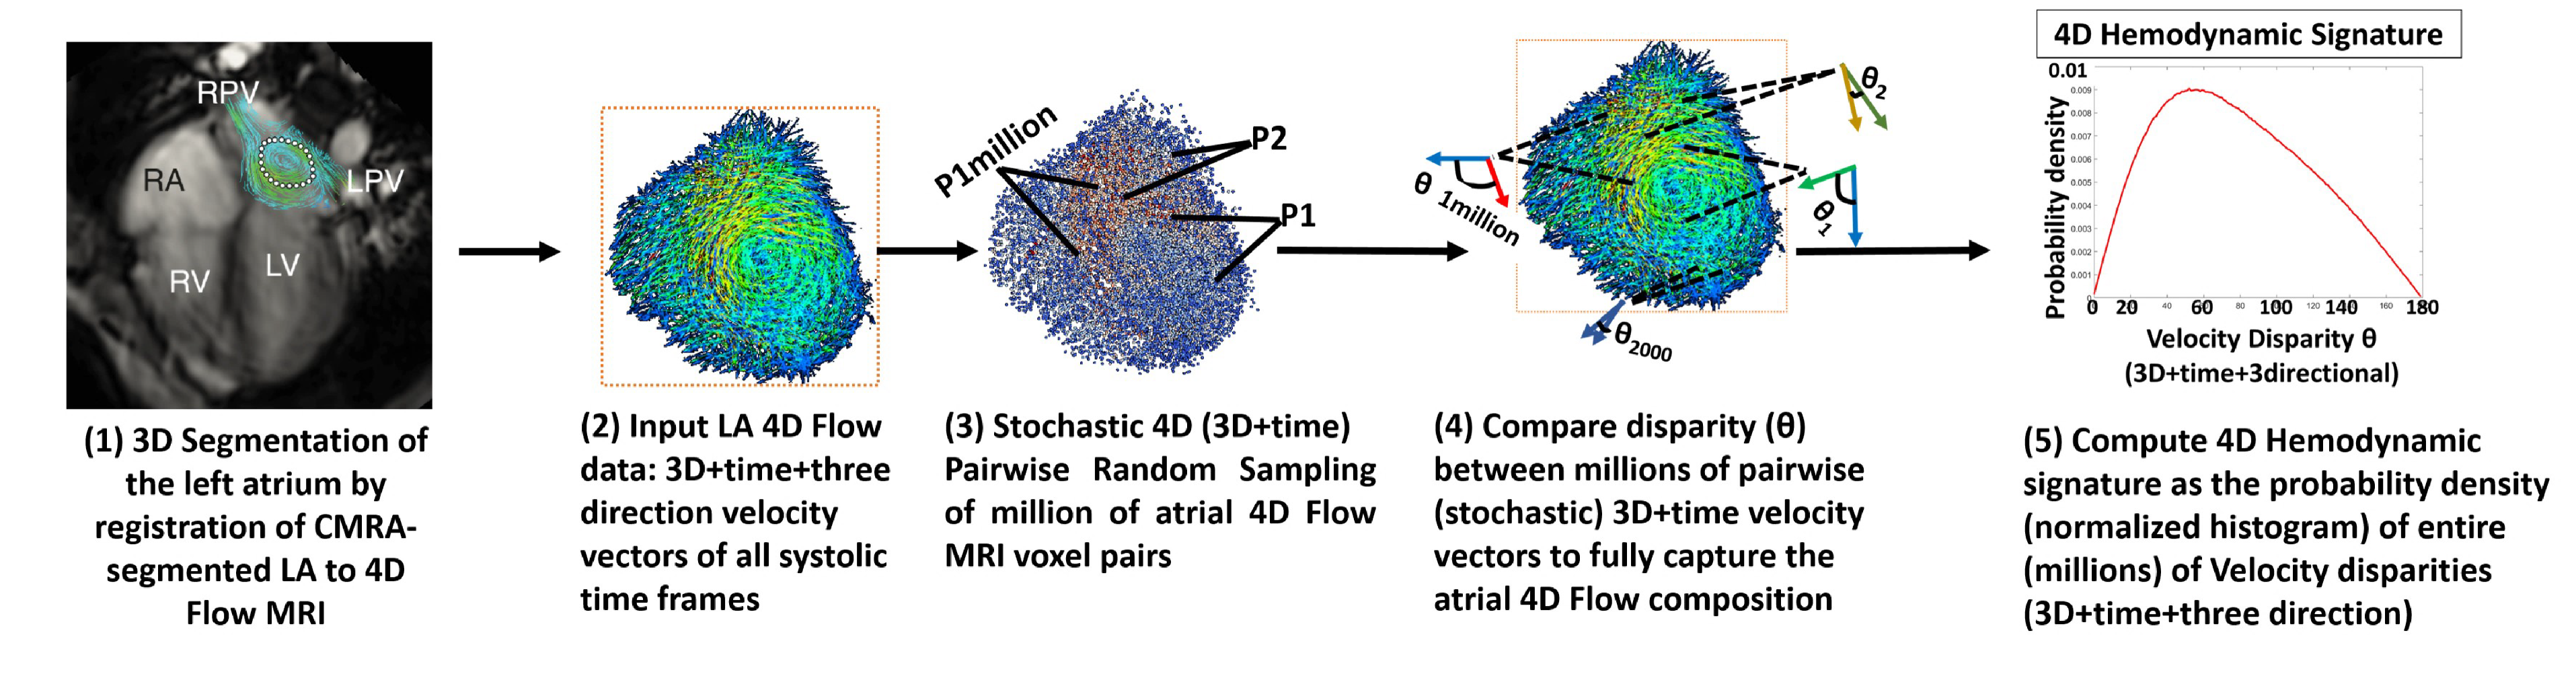
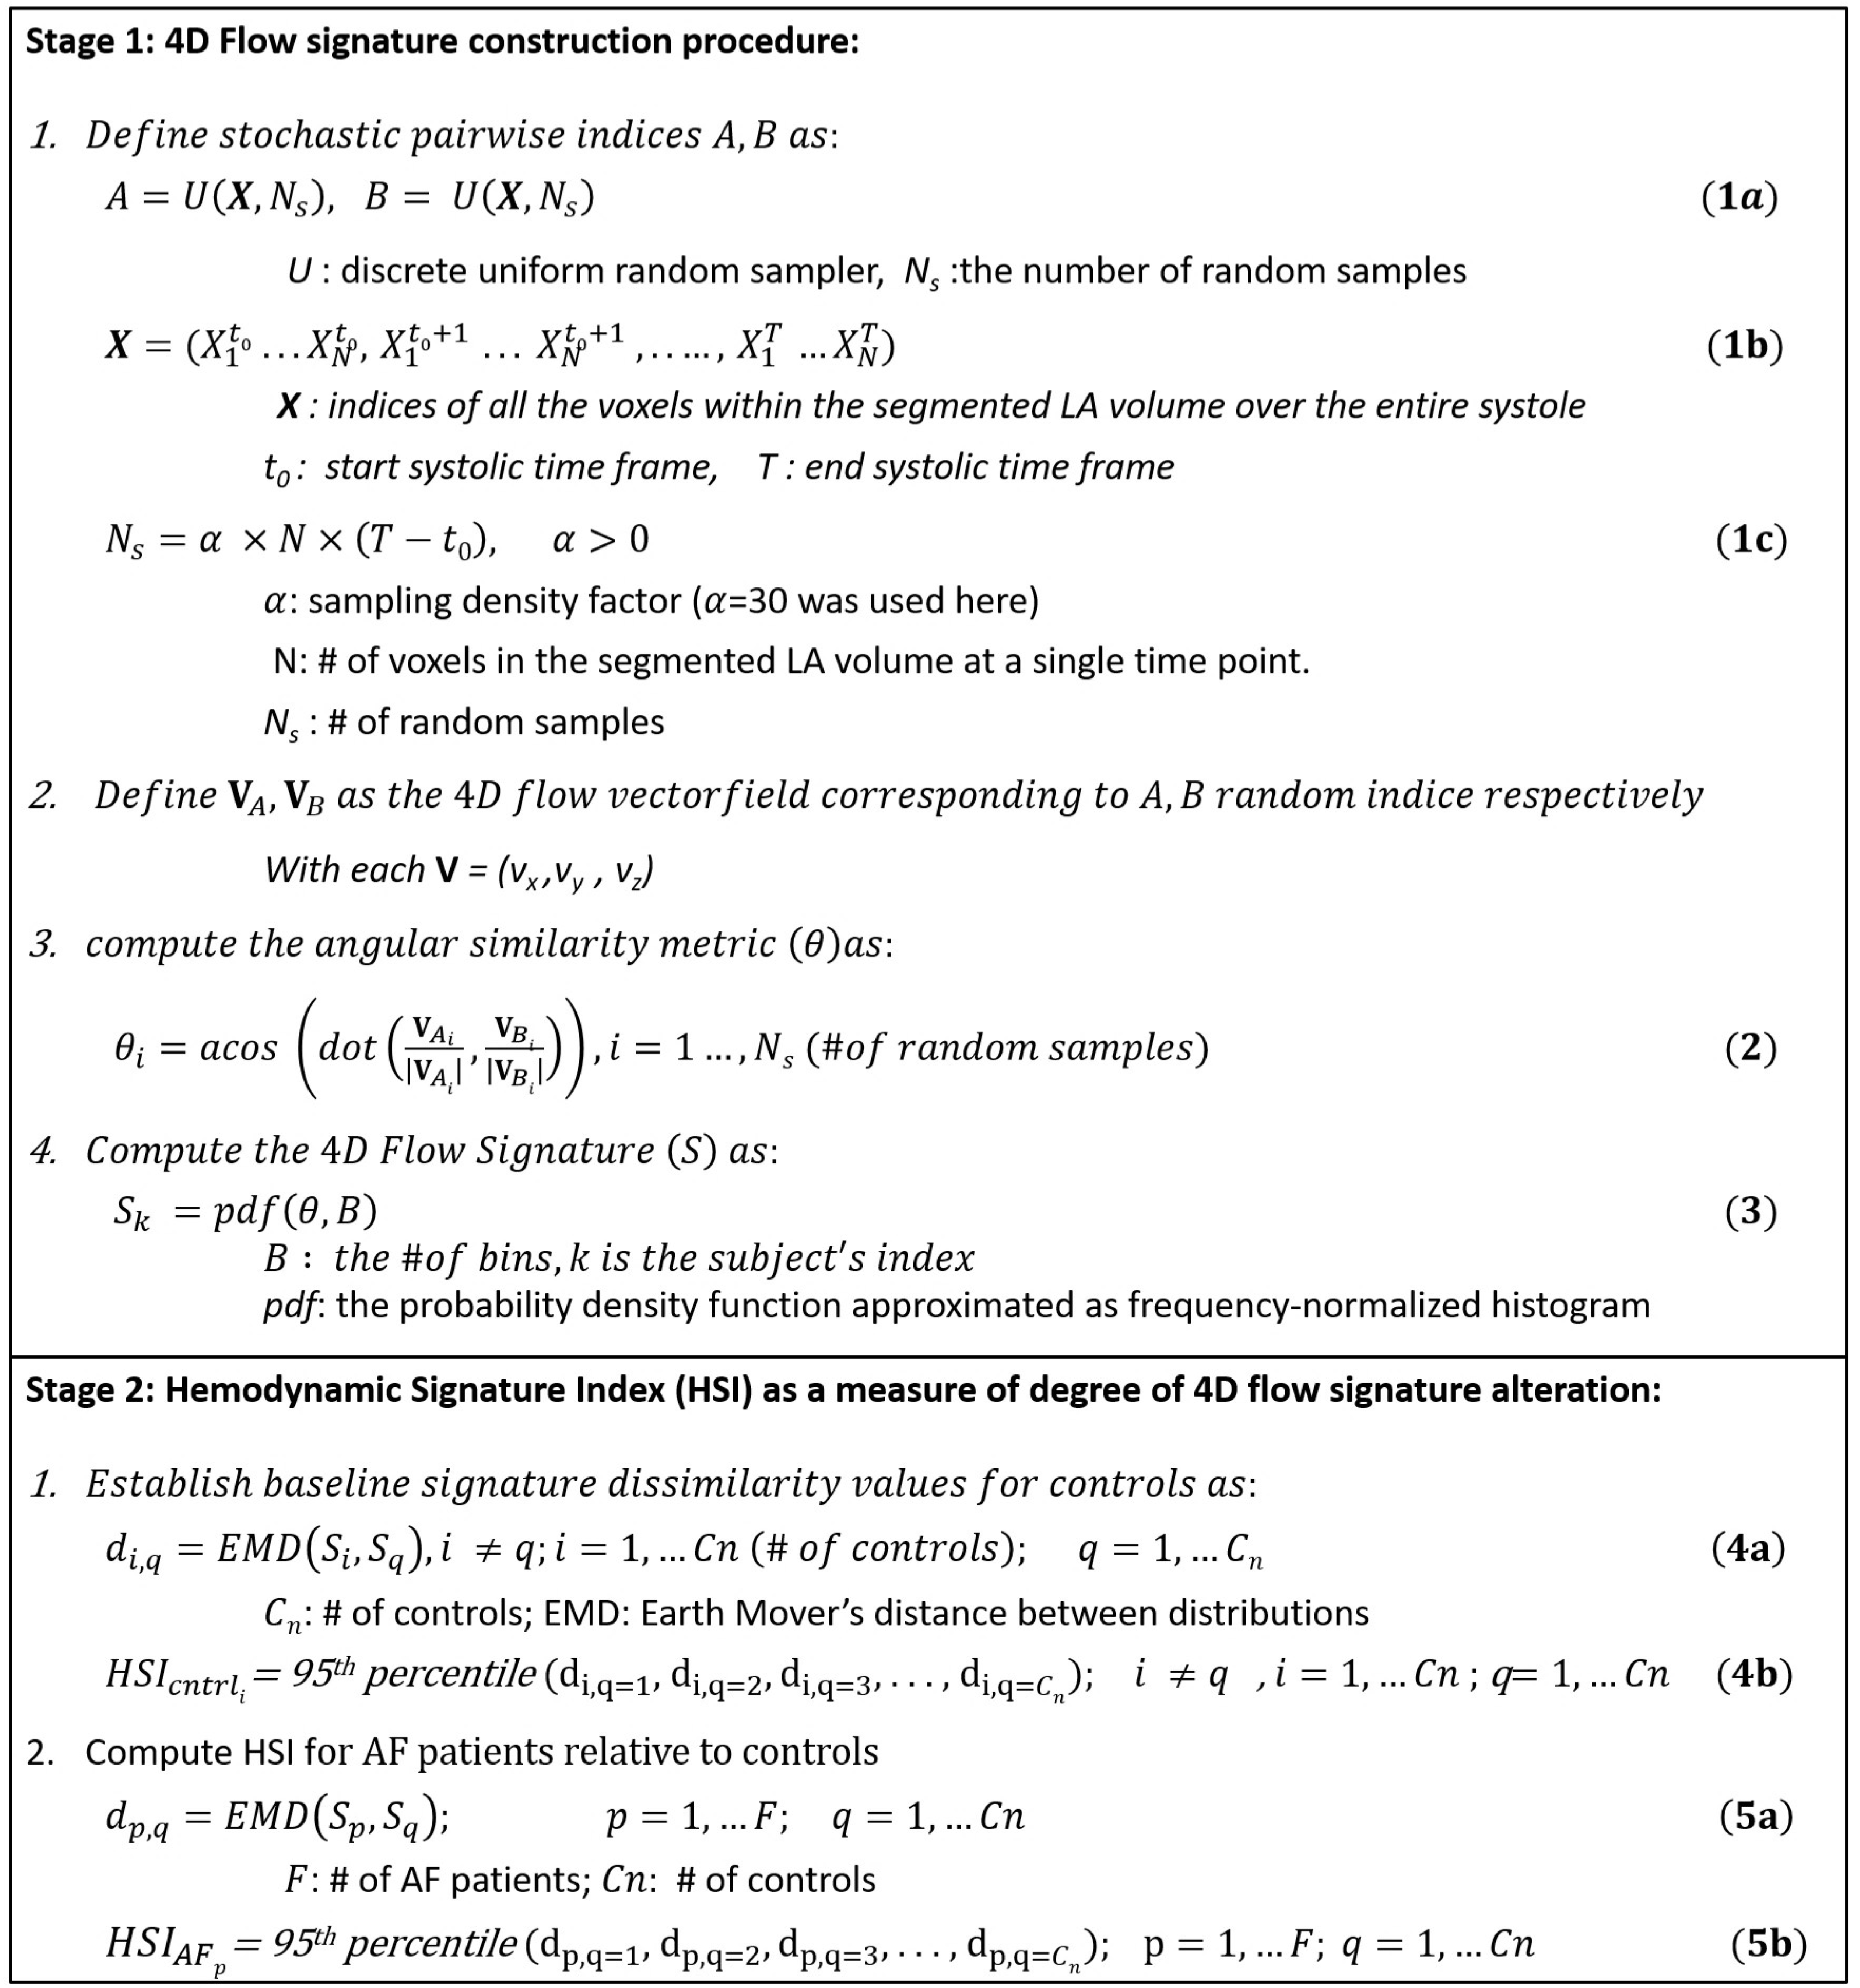
Our proposed two-stage technique is summarized in Fig. 1 and Fig. 2:4D Flow Signature Construction
1) Segment the 3D LA from 4D Flow MRI (Fig. 1). 2) Identify the range of time frames in the cardiac cycle to be analyzed. Here, we analyzed LA over the entire systolic time frames (9±2 time frames) identified from flow time-curves. 3) Perform stochastic discrete uniform random sampling of NS point (voxel) pairs over the entire segmented LA volume and time range (Fig. 2, Eq. 1). Note that NS is defined as a function of each patient’s LA volume. NS = 1.9±0.9 million points were used here. 4) For each pair of samples, compare the disparity between their corresponding 4D Flow-derived 3-directional velocity vector-field using the co-disparity function of the angular similarity metric (θ) with θ=0° as a perfect match and θ=180° as a complete mismatch between each velocity vector pair (Fig. 2, Eq. 2). Note that the θ metric is scale-invariant. 5) Compute the subject’s standardized signature (S) as the probability density function of θ values as estimated using a frequency-normalized histogram of B bins. B = 180 equally spaced bins was used (Fig. 2, Eq. 3).Hemodynamic Signature Index (HSI)
To enable consistent comparison of 4D Flow signature profiles between patients, we introduce this index as follows: 1) Define a dissimilarity metric to compare the derived signatures of different subjects. Here, we used the Earth Mover’s Distance (EMD) of distributions5. 2) Per control, derive baseline normal signature dissimilarity value (HSIcntrl) compared to all other controls. This allows deriving and accounting for the normal inter-individual physiologic differences in the signature (Fig. 2, Eq. 4). 3) Per AF patient, compute the HSI value, which is a measure of the cumulative (95%tile) difference between the individual patient’s 4D Flow signature from all matched controls’ (Fig. 2, Eq. 5). A smaller HSI value means more similarity of the patient’s signature to controls, while larger values correspond to higher alterations (altered flow-field dynamics).Results
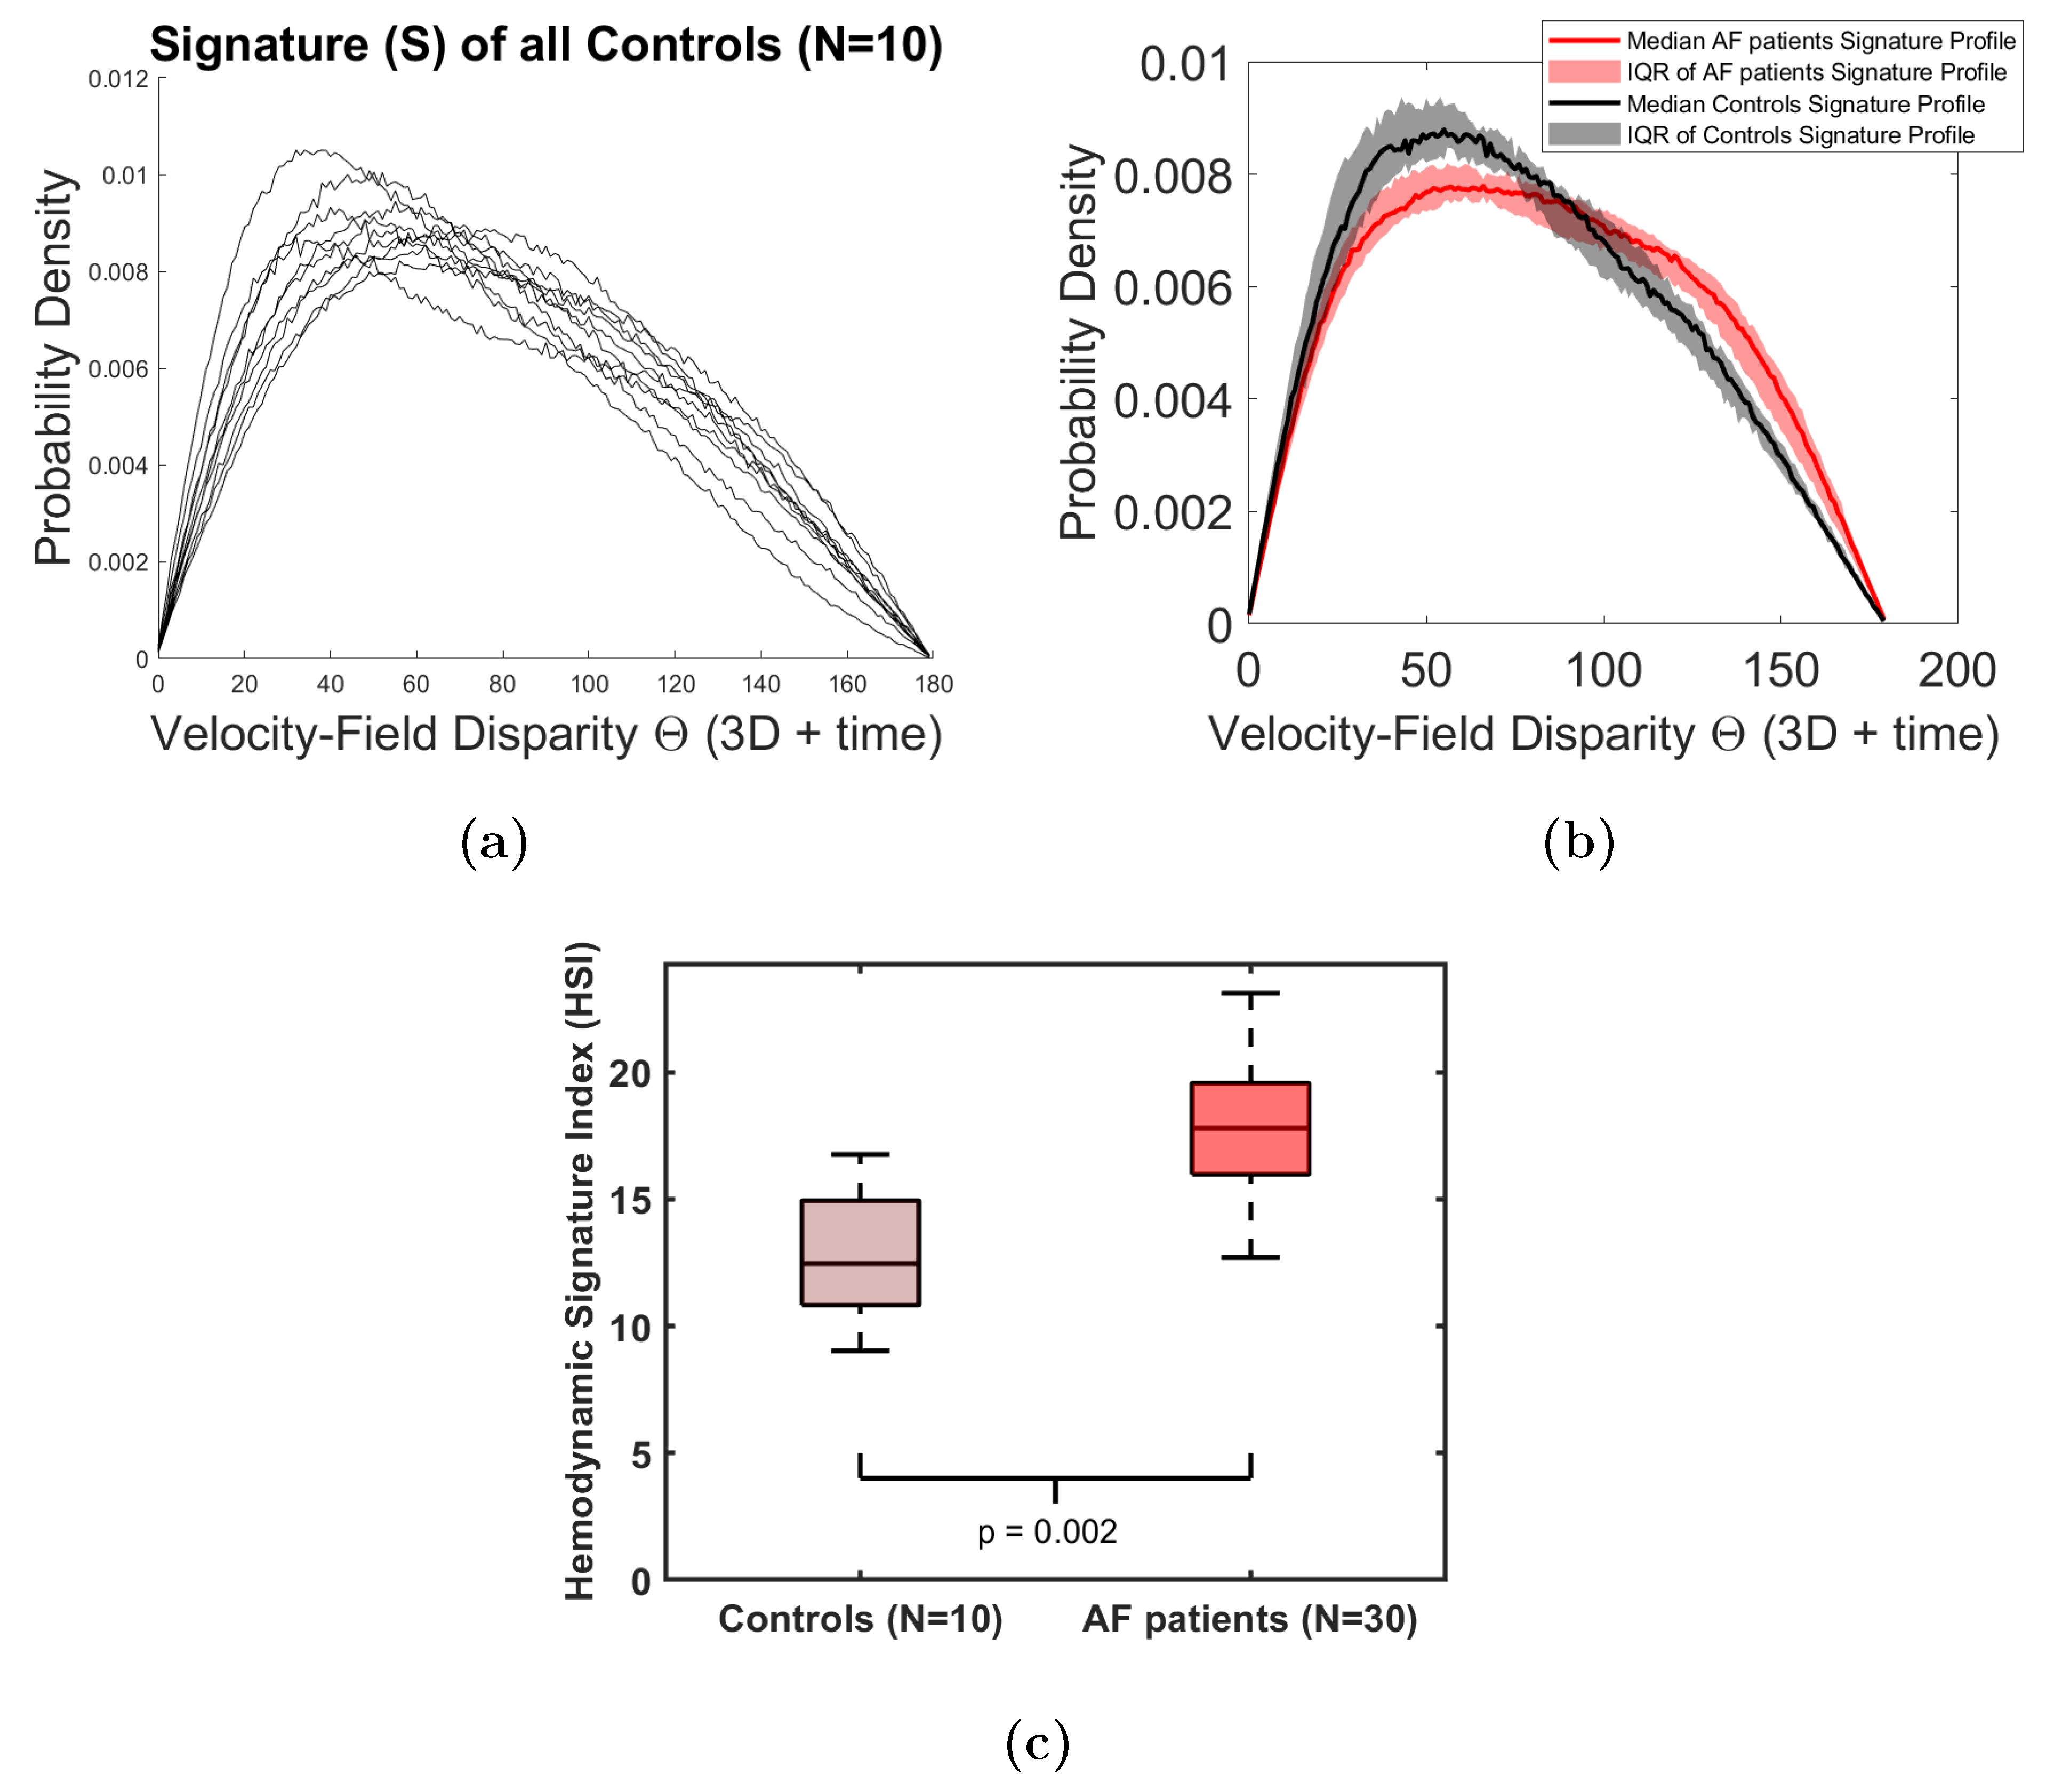
Signature construction was successful for all patients and controls. The controls’ 4D Flow signatures were consistent (Fig 3a), while AF patient signatures were distinctly altered (Fig 3b). AF signature profiles (Fig 3b) showed an increase in velocity vector disparities indicated by higher probability density of the high θ values (i.e., mismatching vectors) and a decrease in the probability density of low θ values (matching vectors). These differences were reflected in a significantly higher HSI in AF patients versus controls (Fig 3c, p=0.002). This highlights higher alterations in AF 4D Flow signatures versus normal/physiologic inter-signature variability in controls’ HSI. Figure 4 shows the excellent test-retest reproducibility of 4D Flow signatures (Intra-class correlation (ICC)=0.98±0.02, Coefficient of variation (CoV) =3.6±0.9%).Discussion and Conclusions
This study demonstrated the feasibility and reproducibility of a novel patient-specific stochastic 4D Flow signatures technique. The proposed quantitative signature stochastically encodes the individual’s complex LA flow dynamics' unique profile from millions of pairwise disparity associations of the 3D time-resolved three-directional velocity-field. The pilot results showed the technique's high potential in detecting significantly altered signatures of the complex LA flow dynamics over the entire systole in AF patients compared to controls. Notably, the signature definition as a probability density function makes it 1) intrinsically standardized (area under the curve = 1), 2) scale-invariant (independent of LA size), and 3) robust to small-frequency noise and errors. Hence, allowing for robust, standardized patient comparison. The signature is derived directly from the entire 3D three-directional 4D Flow MRI velocity field, enabling a comprehensive utilization and highly automated analysis. In the future, we will expand this technique to assess dynamic flow changes over the entire cardiac cycle in a large cohort of AF patients and various other cardiovascular diseases.Acknowledgements
This work is supported in part by the American Heart Association (AHA) Transformational project Award # 20TPA35490311 and the Northwestern Sylvia Wolff Award for Arrhythmia ResearchReferences
1. Markl, Michael, et al. "Left atrial and left atrial appendage 4D blood flow dynamics in atrial fibrillation." Circulation: Cardiovascular Imaging 9.9 (2016): e004984.
2. Garcia, Julio, et al. "Left atrial vortex size and velocity distributions by 4D flow MRI in patients with paroxysmal atrial fibrillation: Associations with age and CHA2DS2‐VASc risk score." Journal of Magnetic Resonance Imaging 51.3 (2020): 871-884.
3. Costello, Benedict T., et al. "Measuring atrial stasis during sinus rhythm in patients with paroxysmal atrial fibrillation using 4 Dimensional flow imaging: 4D flow imaging of atrial stasis." International Journal of Cardiology (2020).
4. Elbaz MSM, et al. Stochastic Flow Co-expression Signatures: A novel concept for volumetric 4D flow assessment with application to aortic valve disease. International Society of Magnetic Resonance in Medicine (ISMRM) 27th Annual Meeting, Montreal, Canada, 11-16 May 2019.
5. Rubner Y, Tomasi C, and Guibas LJ. The earth mover's distance as a metric for image retrieval. International journal of computer vision. 2000;40:99-121.
Figures