0302
Phase-contrast MR angiography at 7 Tesla revealed reduced lenticulostriate artery blood flow velocity in patients with small vessel disease1State Key Laboratory of Brain and Cognitive Science, Institute of Biophysics, Chinese Academy of Sciences, Beijing, China, 2The Innovation Center of Excellence on Brain Science, Chinese Academy of Sciences, Beijing, China, 3University of Chinese Academy of Sciences, Beijing, China, 4Department of Neurology, Peking University First Hospital, Beijing, China, 5MR Collaboration, Siemens Healthcare Ltd, Beijing, China, 6Siemens Shenzhen Magnetic Resonance Ltd, Shenzhen, China
Synopsis
In this study, we demonstrated a technique that could non-invasively quantify lenticulostriate artery (LSA) flow velocities in cerebral small vessel disease (CSVD). With phase-contrast magnetic resonance angiography (PC-MRA) at 7T, LSA blood flow velocities were detected in patients with CADASIL (a hereditary CSVD). LSA flow velocities decreased in patients compared with healthy individuals. We also found good associations between velocities and clinical characteristics among patients with CADASIL. These results suggest that PC-MRA at 7T is a valuable technique to assess small arterial dysfunction in patients with CSVD.
Introduction
Cerebral autosomal dominant arteriopathy with subcortical infarcts and leukoencephalopathy (CADASIL) is an inherited small vessel disease (SVD) that mainly affects vascular smooth muscle cells (VSMCs) and causes small arterial damage.1,2 Conventional non-invasive methods, such as transcranial Doppler sonography (TCD) and phase-contrast magnetic resonance angiography (PC-MRA), failed to detect small vessel blood flow velocity due to limited spatial resolution and sensitivity issues.3 Therefore, it remains unclear whether the blood flow velocity of cerebral small arteries changes with VSMCs disfunction in CADASIL arteriopathy.Benefiting from higher signal-to-noise ratios and stronger in-flow effect at ultra-high field, the accuracy and superiority of 7T PC-MRA for examining the velocity4 and pulsatility5 of blood flow in lenticulostriate arteries (LSAs) have been demonstrated. In this study, we investigated the potential changes in LSA flow velocities in patients with CADASIL using 7T PC-MRA and correlated the potential changes with clinical characteristics.
Methods
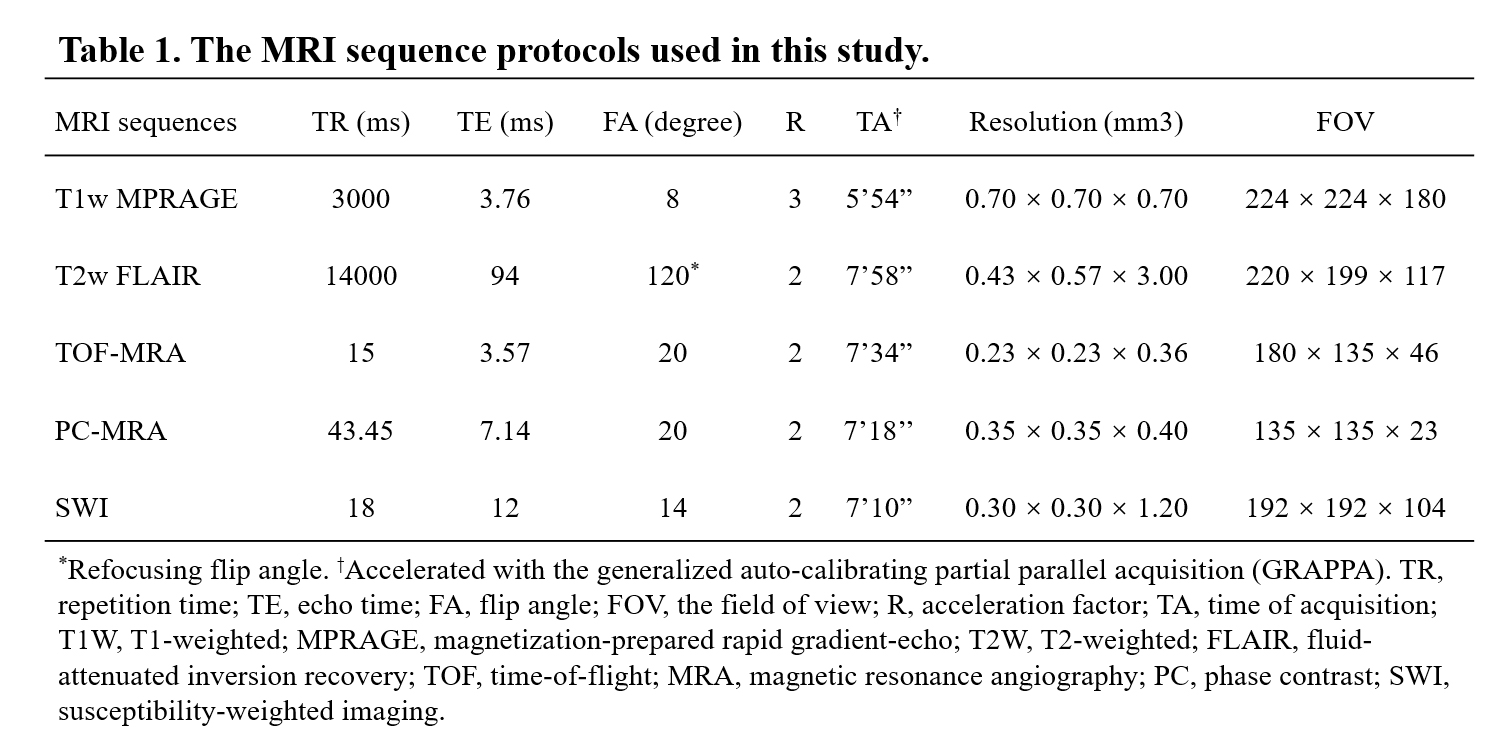
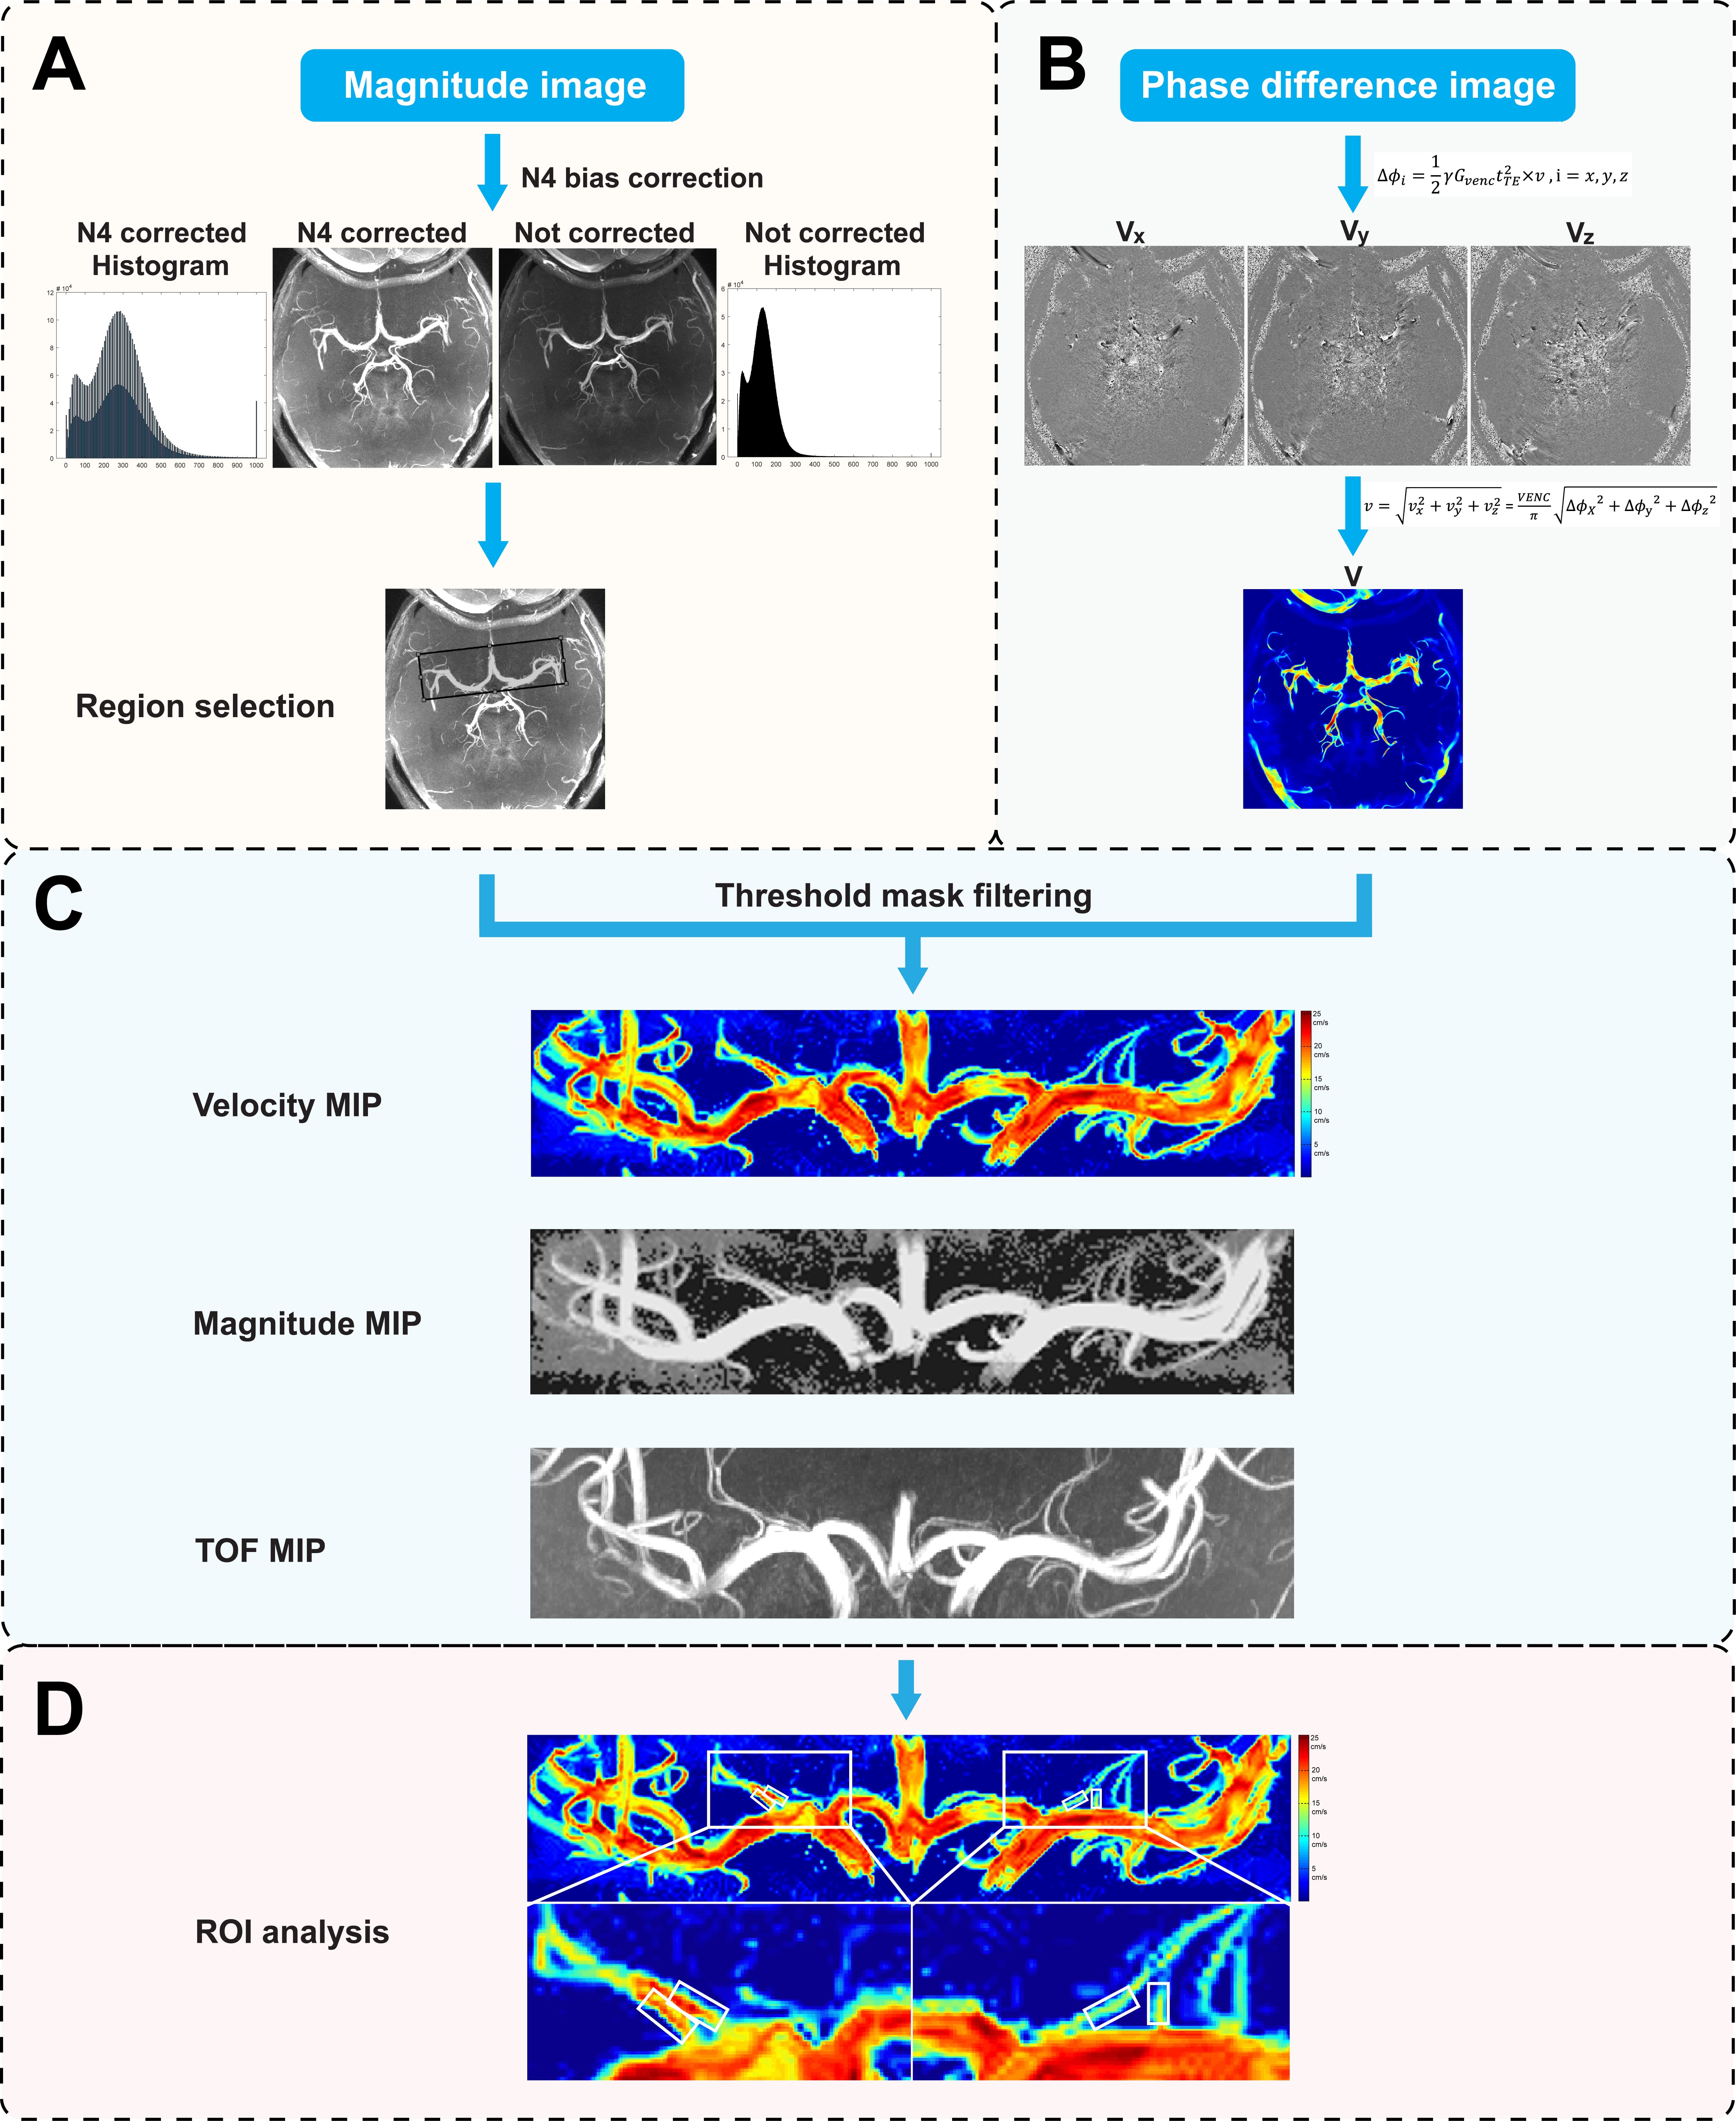
A total of thirty-one CADASIL patients and thirty-one sex and age-matched healthy controls (HC) were included in this study after excluding subjects with poor image quality. The magnetic resonance imaging (MRI) scans were performed on a prototype 7T MRI system (MAGNETOM 7T, Siemens Healthineers, Erlangen, Germany). The protocols included T1-weighted magnetization-prepared rapid gradient echo (T1w-MPRAGE), T2-weighted fluid-attenuated inversion recovery (T2w-FLAIR), time-of-flight (TOF) MRA, PC-MRA, and susceptibility-weighted imaging (SWI). The key parameters of the imaging sequences are shown in Table 1. Clinical evaluations were performed using the following questionnaires: Mini-Mental State Examinations (MMSEs) and Montreal Cognitive Assessment (MOCA) for neurocognitive functions, Modified Rankin Scale (mRS) and Barthel Index (BI) for the degrees of dependence, and the Hamilton Anxiety Scale (HAMA) and Hamilton Depression Scale (HAMD) for mood assessments.Three-dimensional, high-resolution PC-MRA was acquired to measure blood flow velocities, targeting the LSAs that were hard to display with conventional PC-MRA. The velocity encoding (VENC) value was set at 15.00 cm/s along each axis to achieve optimal sensitivity for small vessels4. The velocity map was calculated via a custom-built program using MATLAB R2018b software that includes: (1) reconstruction of velocity components from phase-difference images; (2) intensity bias corrections using the N4ITK algorithm6; (3) region extraction on axial maximum intensity projection (MIP) of magnitude reference images; (4) threshold-based noise-masking; (5) coronal MIP for velocity map creations. As shown in Figure 1(C), the velocity map clearly depicted LSAs originating from the trunks of the middle cerebral artery (MCA) and anterior cerebral artery (ACA). To measure the LSAs blood flow velocity, rectangular ROIs with a fixed size (4×6 voxels, 1.4×2.4 mm2) were placed on the dominant branches of the LSAs from the left and right ACA or MCA and covered the LSAs initial segments.
LSA mean velocities were compared between the patients and HCs. The associations between the velocities, structural MRI lesions, and clinical characteristics were analyzed.
Results
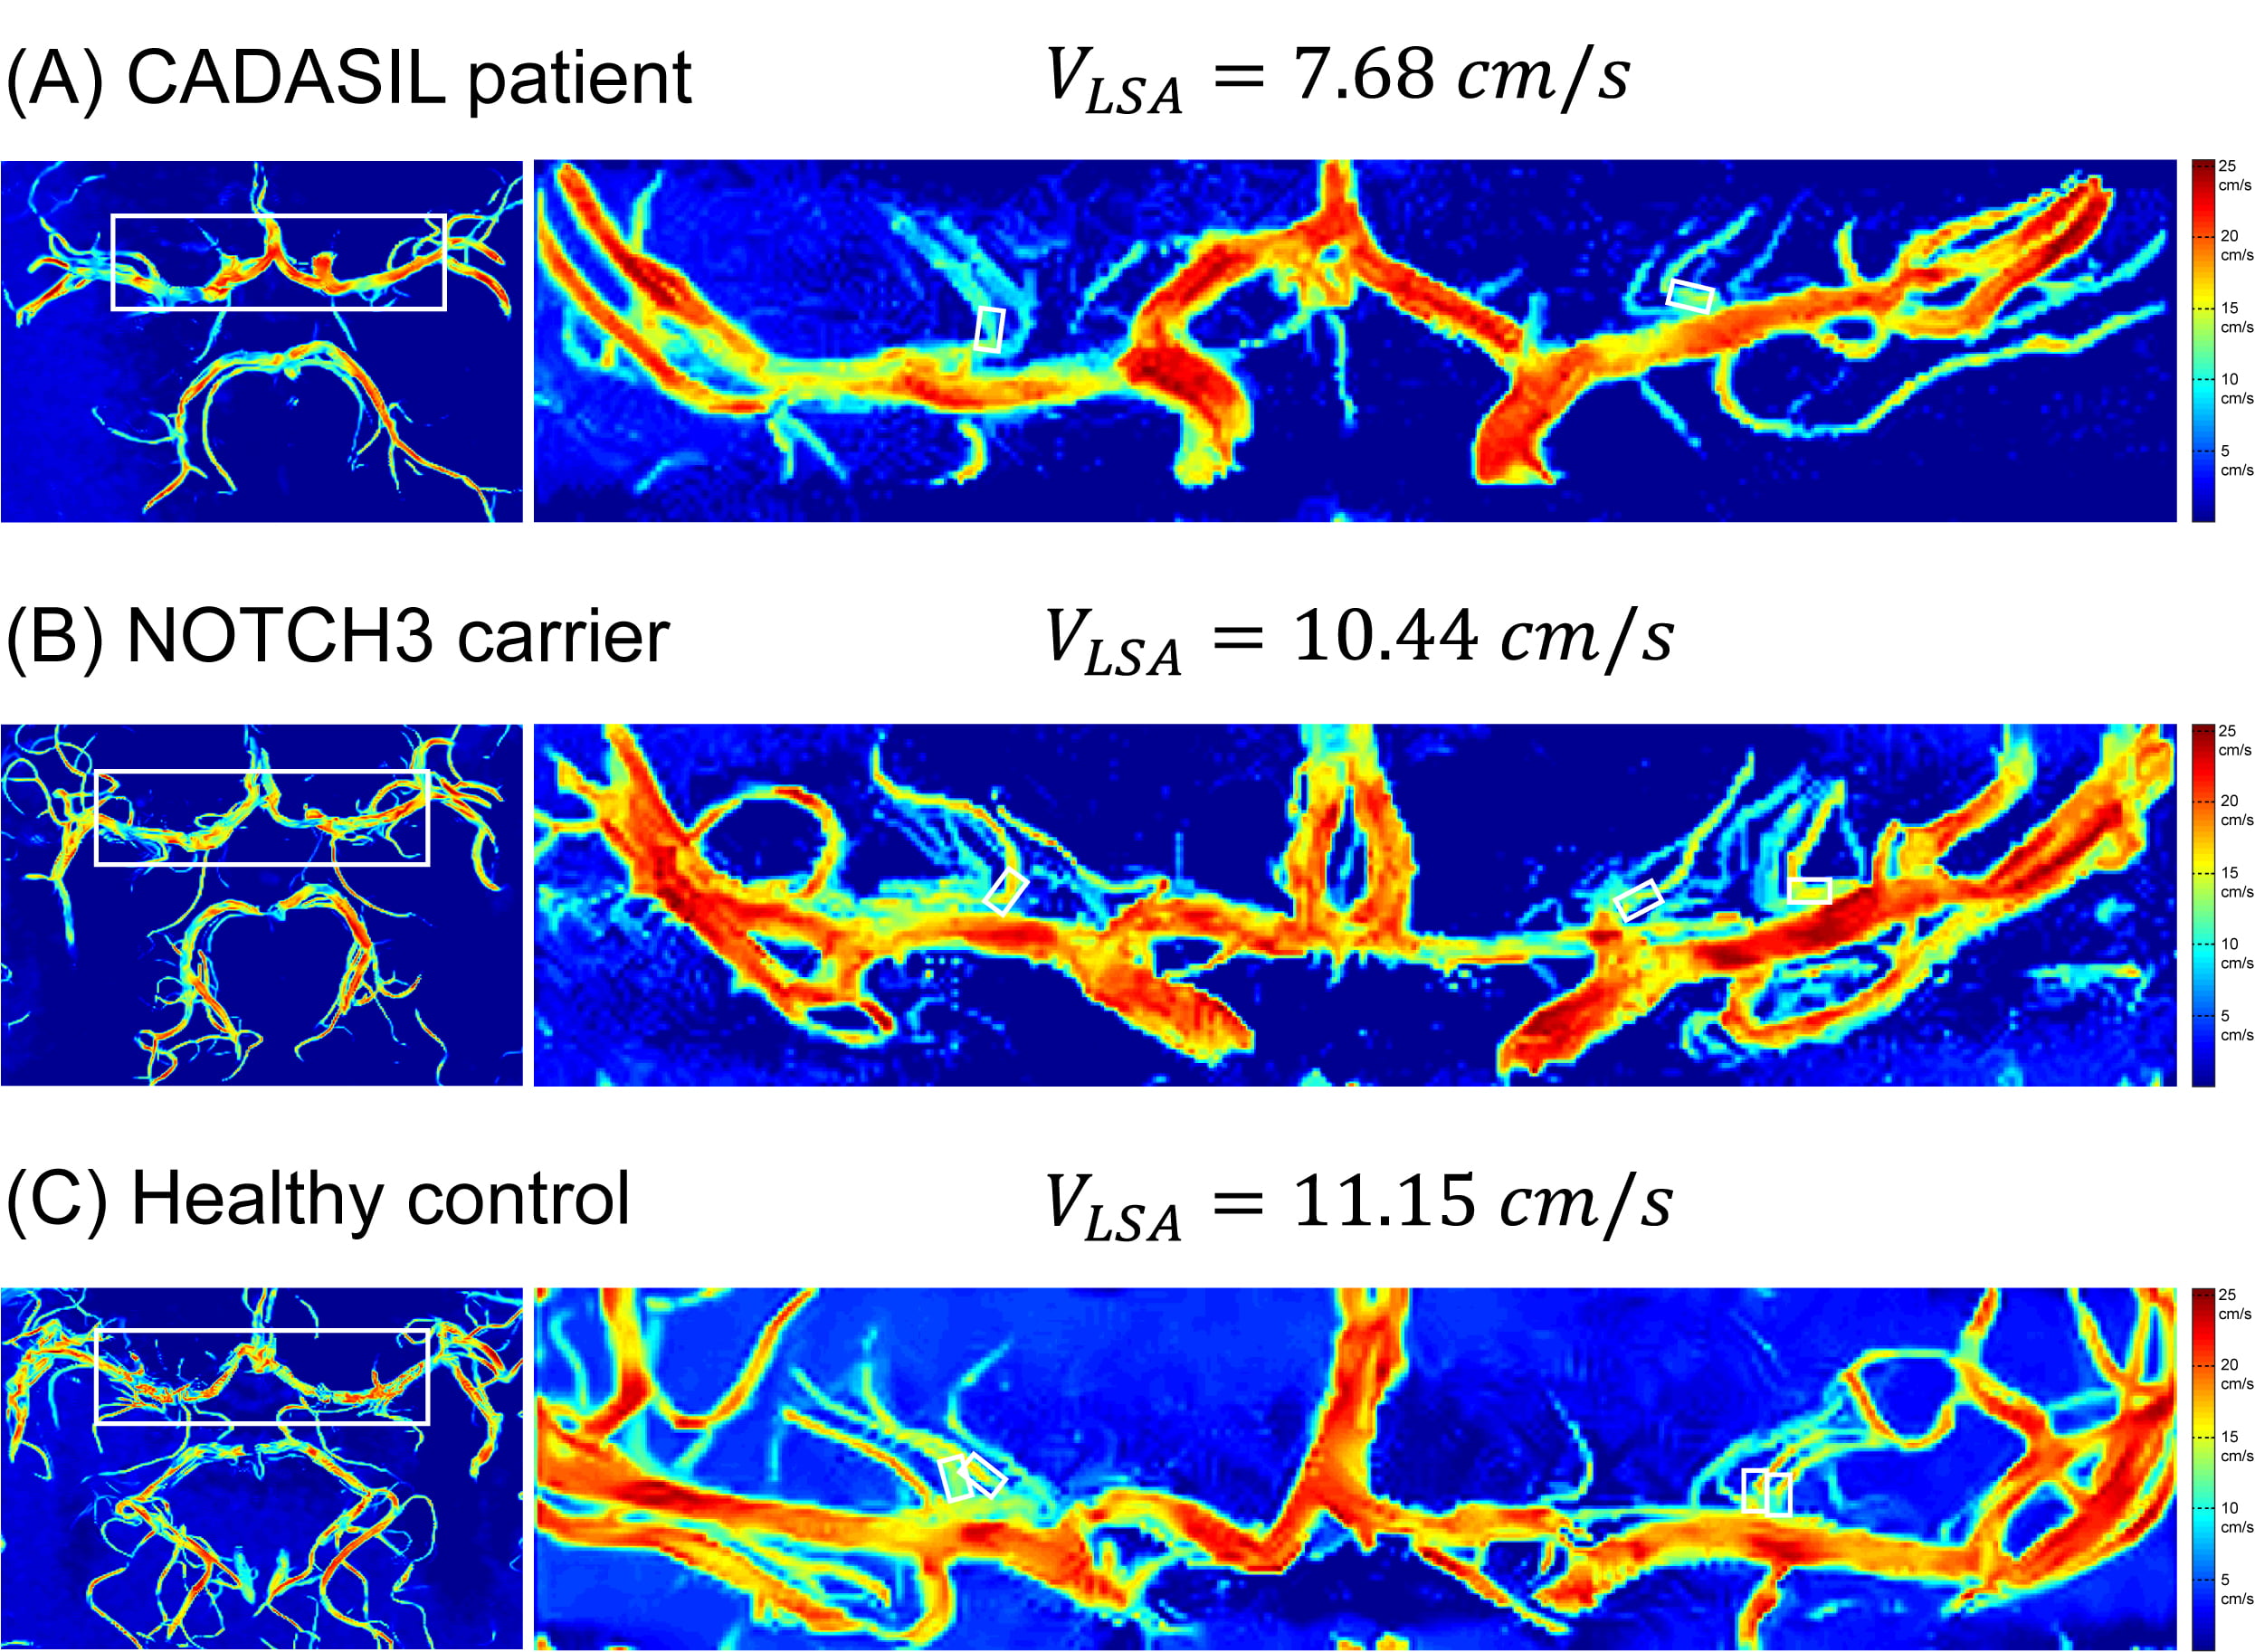
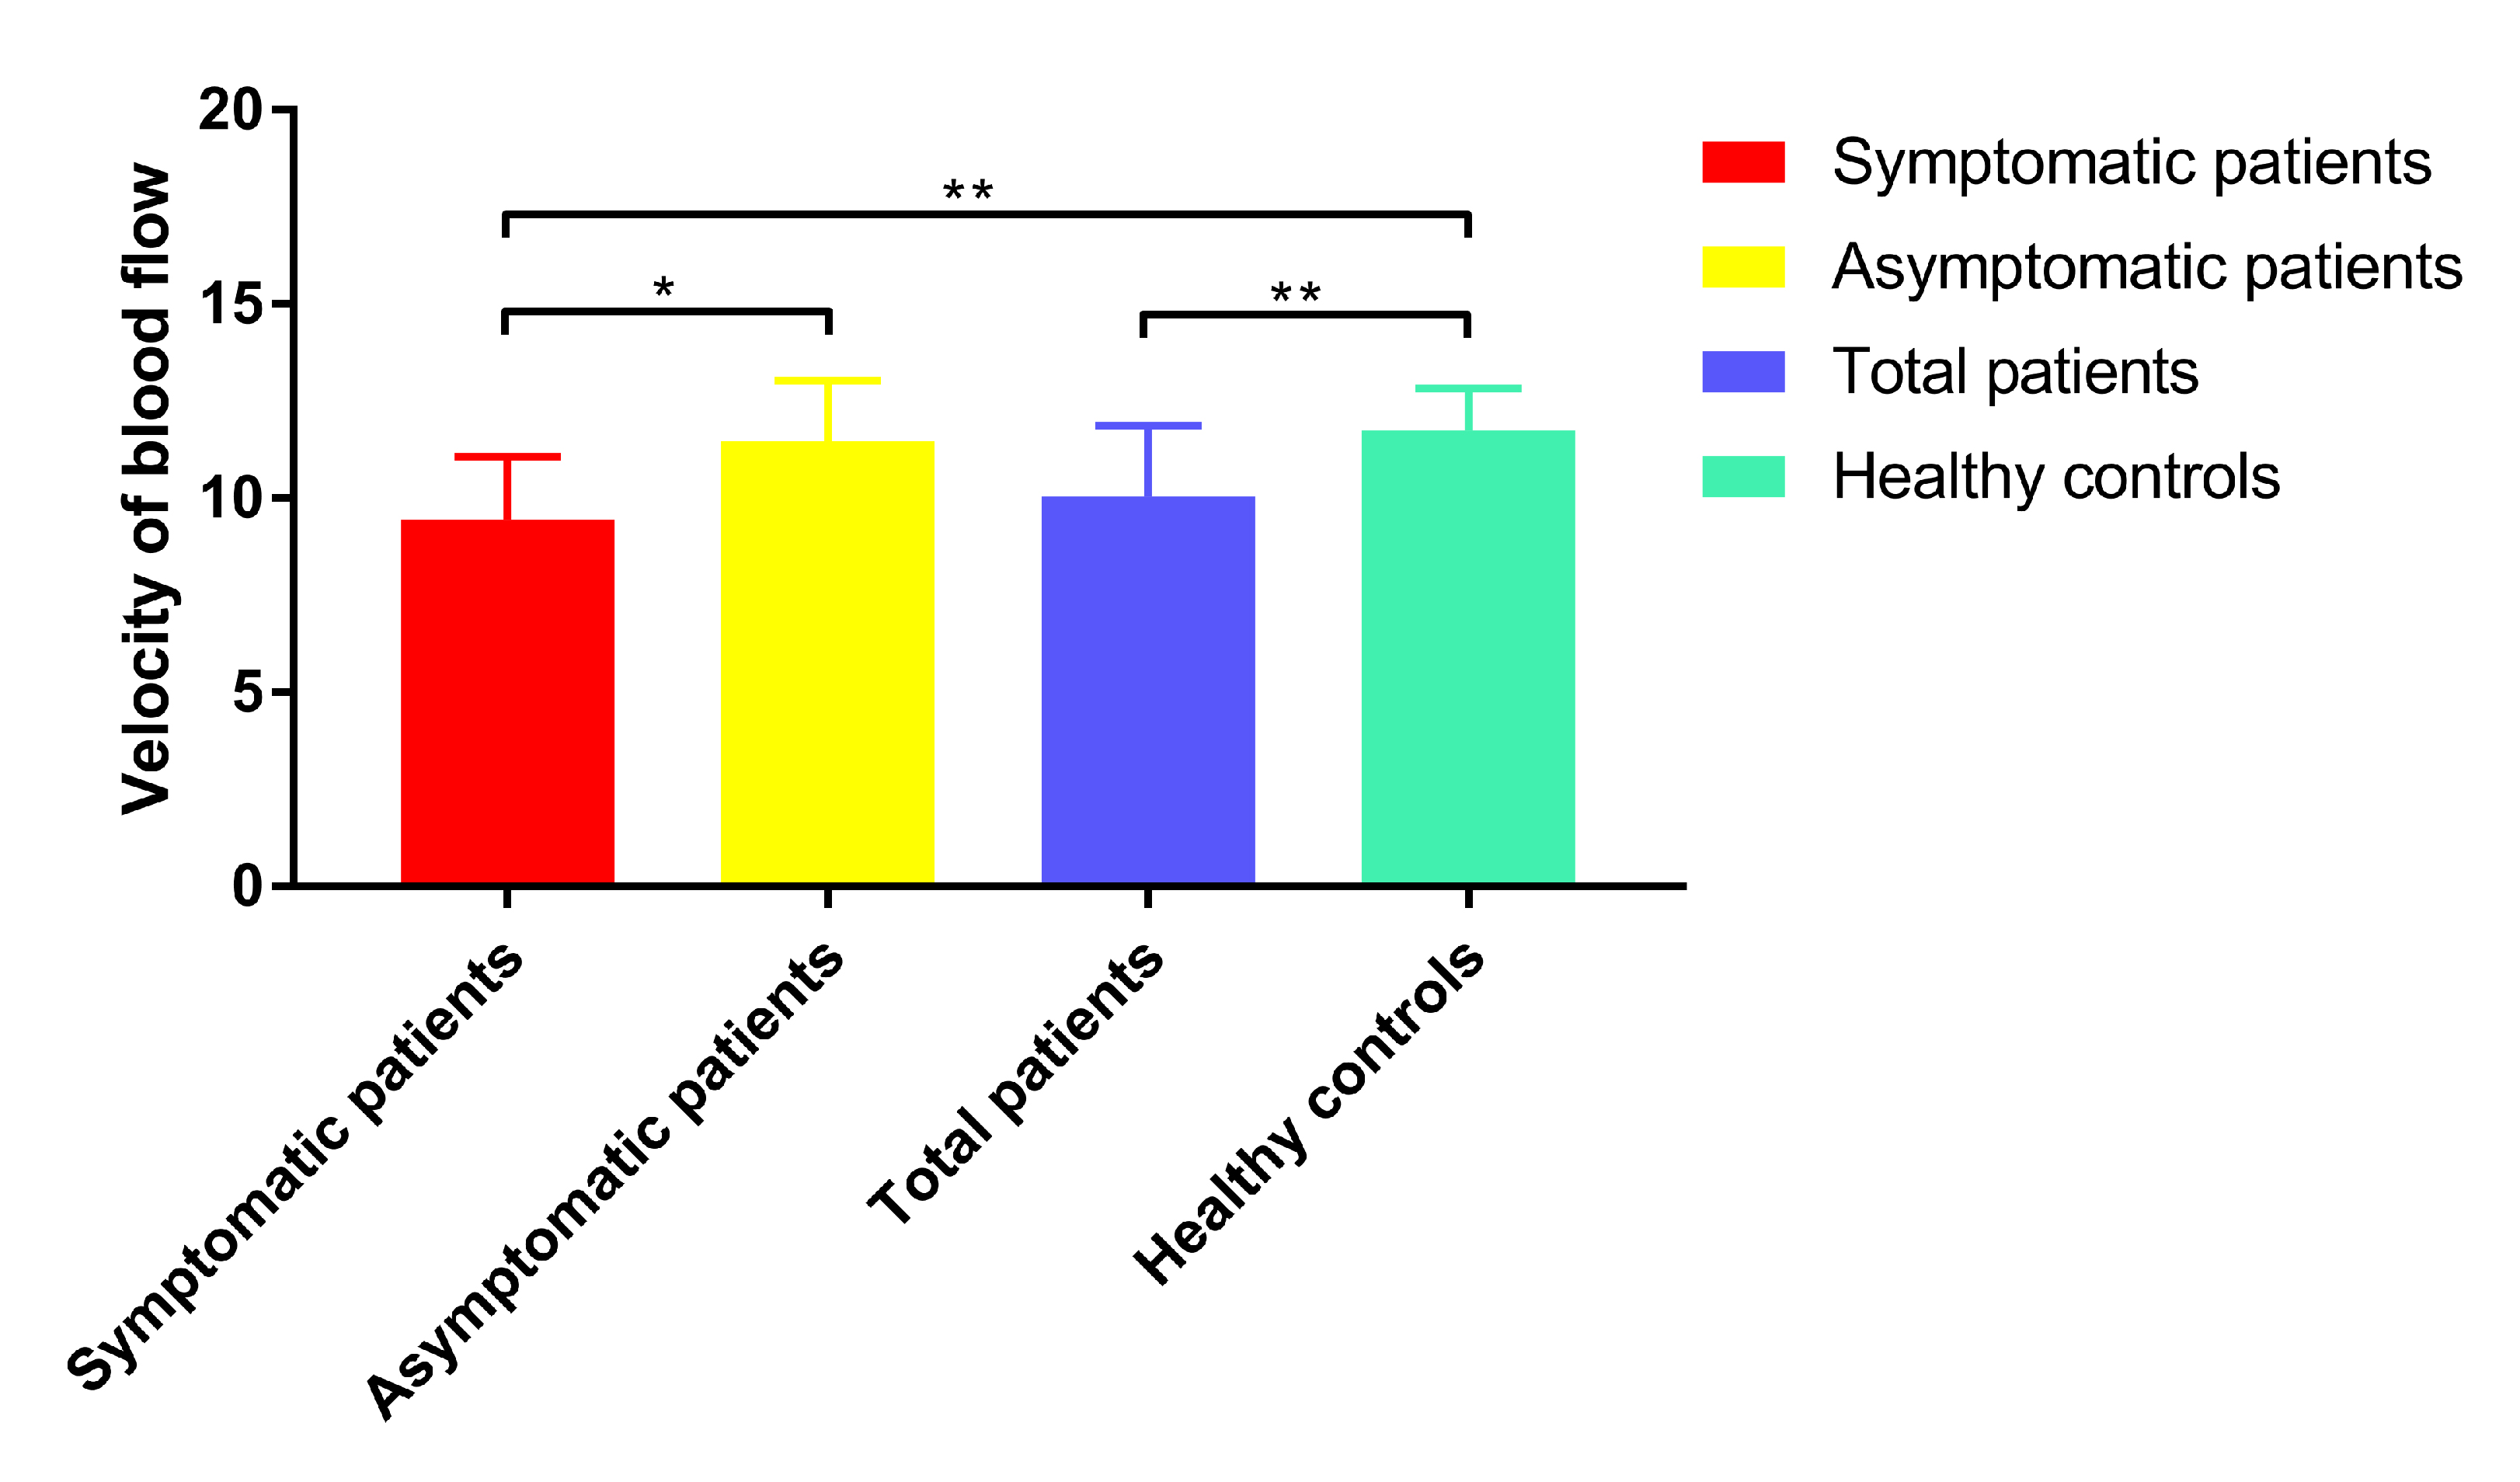
The representative velocity maps of different groups are shown in Figure 2. The LSA flow velocities were lower in patients with CADASIL than that in healthy controls (10.04±1.82 cm/s vs. 11.75±1.07 cm/s, t=-4.517, P<0.001, Figure 3), and velocities decreased with age (ρ=-0.408; P=0.023).Moreover, Figure 4 demonstrates that LSA blood flow velocities were negatively associated with age-related white matter change (ARWMC) scores in the basal ganglia (ρ=-0.683; P<0.001), supratentorial regions (ρ=-0.628; P<0.001), and global brain (ρ=-0.657; P<0.001). They were also negatively correlated with the number of lacunar infarctions (LIs) in the basal ganglia (ρ=-0.656; P<0.001), supratentorial regions (ρ=-0.778; P<0.001), and global brain (ρ=-0.760; P<0.001); the number of cerebral microbleeds (CMBs) in deep regions (ρ=-0.506; P=0.004), supratentorial regions (ρ=-0.484; P=0.006), and global brain (ρ=-0.484; P=0.006); and the SVD scores (ρ=-0.696; P<0.001). Furthermore, significant correlations were found between the LSA velocities and the mRS (OR=0.357; P=0.001), BI (β=0.489; P=0.016), MMSE (β=0.489; P=0.025), MoCA (β=0.461; P=0.043), and SVD scores (OR=0.323; P<0.001) after adjusting for age and disease duration.
Discussion
This study presents a method that non-invasively detects the flow velocities of small intracranial perforating arteries using 7T PC-MRA in patients with CADASIL. It is the first study that demonstrated the potential utility and feasibility of this modality in patients with CSVD. Compared with healthy controls, we found that the LSA blood flow velocities were lower in patients with CADASIL and correlated with the MRI lesions and clinical conditions, indicating the presence of small arterial dysfunction.Accumulating evidence has demonstrated cerebral hemodynamics, including cerebral blood flow and cerebrovascular reactivity impairments in patients with SVD without revealing the underlying mechanisms 7,8. Our findings provided novel insights into CSVD progression. Further studies, including multi-VENC, time-resolved velocity measurements of small arteries, and longitudinal clinical studies, need to be performed in the future.
Conclusions
7T PC-MRA revealed significant reductions in LSA blood flow velocities which indicated the presence of small arterial dysfunction. Reduced LSA blood flow velocities were correlated with brain parenchymal lesions and resultant clinical characteristics. The results proved that high-resolution PC-MRA at 7T is a promising method for the quantification of small vessel velocity changes in patients with CSVD.Acknowledgements
This work was supported by the National Natural Science Foundation of China (82001804, 8191101305), the Natural Science Foundation of Beijing Municipality (7191003), the National Key Research and Development of China (2016YFC1300605, 2017YFC1307904), the capital health research and development of special (2020-2-5115), and the Strategic Priority Research Program of Chinese Academy of Science (XDB32010300).References
1. Goate AM, Morris JC. Notch3 mutations and the potential for diagnostic testing for CADASIL. The Lancet. 1997;350(9090):1490.
2. Ling C, Fang X, Kong Q, et al. Lenticulostriate Arteries and Basal Ganglia Changes in Cerebral Autosomal Dominant Arteriopathy With Subcortical Infarcts and Leukoencephalopathy, a High-Field MRI Study. Front Neurol. 2019;10.
3. Stalder AF, Russe MF, Frydrychowicz A, et al. Quantitative 2D and 3D phase contrast MRI: Optimized analysis of blood flow and vessel wall parameters. Magnetic Resonance in Medicine. 2008;60(5):1218-1231.
4. Kang C-K, Park C-A, Lee DS, et al. Velocity measurement of microvessels using phase-contrast magnetic resonance angiography at 7 tesla MRI: Velocity Measurement of Microvessels. Magnetic Resonance in Medicine. 2016;75(4):1640-1646.
5. Schnerr RS, Jansen JFA, Uludag K, et al. Pulsatility of Lenticulostriate Arteries Assessed by 7 Tesla Flow MRI—Measurement, Reproducibility, and Applicability to Aging Effect. Front Physiol. 2017;8.
6. Tustison NJ, Avants BB, Cook PA, et al. N4ITK: Improved N3 Bias Correction. IEEE Trans Med Imaging. 2010;29(6):1310-1320.
7. Shi Y, Thrippleton MJ, Makin SD, et al. Cerebral blood flow in small vessel disease: A systematic review and meta-analysis. J Cereb Blood Flow Metab. 2016;36(10):1653-1667.
8. Chabriat H., Pappata S., Ostergaard L., et al. Cerebral Hemodynamics in CADASIL Before and After Acetazolamide Challenge Assessed With MRI Bolus Tracking. Stroke. 2000;31(8):1904-1912.
Figures