0299
Column-based cortical depth analysis of the diffusion anisotropy in submillimeter whole-brain DTI of the human gray matter1Brain Imaging and Analysis Center, Duke University, Durham, NC, United States, 2Medical Physics Graduate Program, Duke University, Durham, NC, United States, 3Institute for Radiological Research, Chang Gung University and Chang Gung Memorial Hospital, Taoyuan, Taiwan
Synopsis
High-resolution diffusion tensor imaging (DTI) can noninvasively probe the microstructural integrity of cortical gray matter in vivo. We propose a column-based method that samples submillimeter isotropic whole-brain DTI data along radially oriented cortical columns to achieve a quantitative analysis of the fractional anisotropy and radiality index dependence on the cortical depth, curvature, and brain regions across the whole brain. This method is robust across repeated scans and healthy subjects, and can capture characteristic diffusion anisotropy and radiality patterns in the cortical gray matter, potentially providing quantitative biomarkers for various neurological disorders.
Introduction
High-resolution diffusion tensor imaging (DTI) can noninvasively probe the microstructural integrity of cortical gray matter. Previous in vivo studies1-4 have shown that DTI-metrics such as fractional anisotropy (FA) and radiality index (RI) vary with the cortical depth, curvature, and region-of-interest (ROI), but none has analyzed the FA/RI dependence on all three variables in the whole brain. Such characteristic features could be used as quantitative biomarkers to study brain development and detect subtle early changes in neurodegenerative diseases. Here, we use a multi-band multiplexed sensitivity-encoding (MB-MUSE) technique5,6 to acquire submillimeter whole-brain DTI data and we propose a column-based analysis that samples the FA/RI on radially oriented cortical columns, enabling a quantitative analysis of the FA/RI dependence on the cortical depth, curvature, and ROI across the brain. We investigate the robustness of this method across repeated scans and healthy subjects, with the long-term goal of using it to provide quantitative biomarkers for various neurological disorders.Methods
Data acquisition and post-processing: Four healthy subjects were scanned on a 3T scanner (GE Premier UHP, 115 mT/m gradients), with one subject scanned twice on different days. Whole-brain MB-MUSE DTI (2 bands, 4 shots, TR/TE 8538/64 ms, 4 b0 + 38 diffusion directions, ~24 min) and T1-weighted anatomical (MPRAGE) images were acquired with a 0.9-mm isotropic resolution. After denoising7,8, Gibbs artifact removal9, susceptibility10 and eddy current-induced11 distortion correction, and bias field correction12,13 with MRtrix3 and FSL, the DTI images were used to generate FA, principal eigenvector (V1), and RI maps (Fig.1A-C) with MRtrix314. The anatomical images were registered to the DTI images using a deformable registration with ANTs15, then used to generate pial surface and white matter (WM)/gray matter (GM) meshes with FreeSurfer16, along with the curvature and normal vector17 to the cortical surface at each vertex.Column-based cortical depth analysis: Cortical “columns” (Fig.1D,E) were generated by connecting corresponding pairs of vertices from the pial surface mesh to the WM/GM surface mesh, with 21 equidistant sampling points at different cortical depths. The FA map was sampled along each column to generate FA vs. cortical depth profiles (Fig.1F, white), with FAdiff denoting the difference between the local maximum and minimum. The dot product between the normal to the WM/GM surface and the sampled eigenvectors from the V1 map was calculated to generate RI vs. cortical depth profiles (Fig.1F, green), with RImax denoting the maximum. The FA/RI at the pial, middle, and WM/GM surfaces (Fig.4B-D,F-H) and FAdiff/RImax (Fig.4E,I) were displayed on cortical surfaces.
ROI-based cortical depth analysis: FA/RI vs. cortical depth profiles of single cortical columns were averaged (Fig.2) in each of the 1000, 448, 219, 119, and 68 ROIs from the 5 atlases (Fig.3A) of the Lausanne cortical parcellation18. For each ROI, correlation coefficients of these profiles were calculated between both scans of subject 1 (Fig.3B,D) and across the 4 subjects (Fig.3C,E).
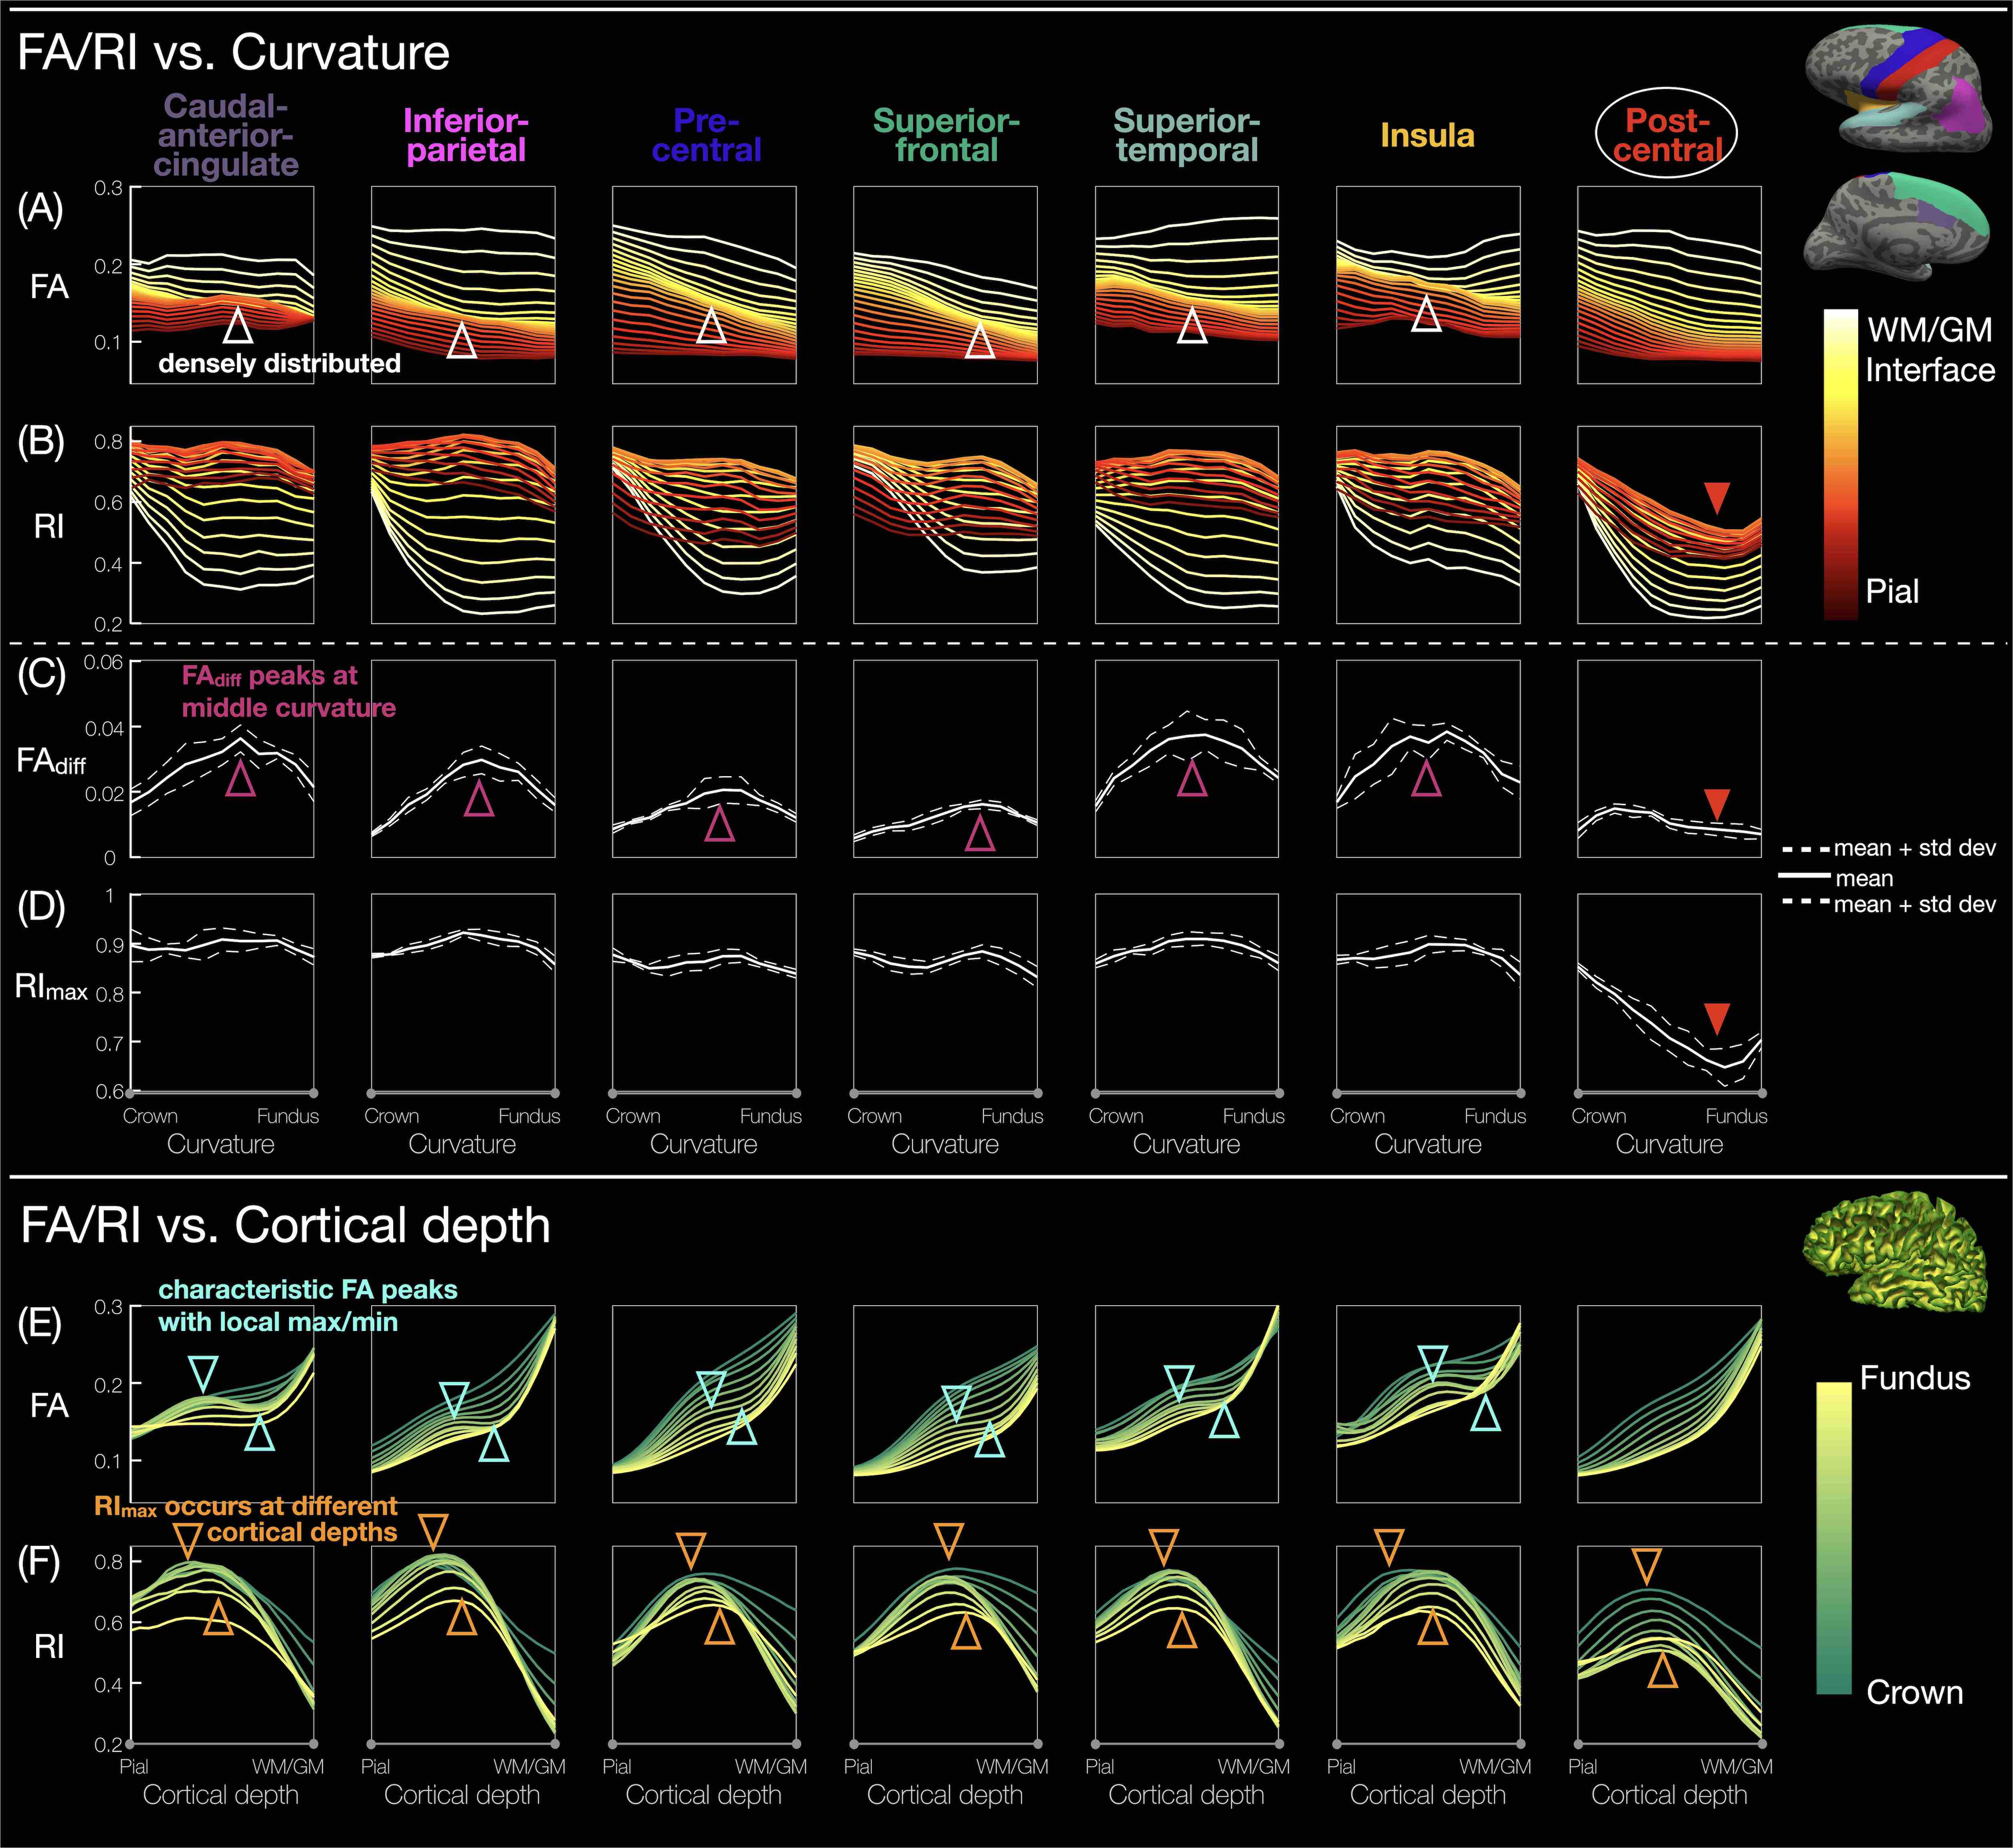
ROI-based curvature analysis: For each hemisphere, the cortical columns in each of the 68 ROIs were equally binned into 11 curvature bins from crown to fundus according to the curvature at the corresponding vertices3. The FA/RI was averaged across 8 hemispheres from 4 subjects, at each cortical depth and within each curvature bin, to generate FA/RI vs. cortical depth or curvature profiles (Fig.5A,B,E,F). FAdiff and RImax were also averaged within each curvature bin (Fig.5C,D).
Results and Discussion
Fig.1A-C shows a band of low FA and a radial diffusion orientation in most cortical regions, but a tangential orientation and lower RI in the post-central gyrus1,2,4. The FA/RI vs. cortical depth profiles show FA/RI peaks at the middle cortical depth2,3, which decrease as the ROI size increases (Fig.2B-G), since more cortical columns are averaged in larger ROIs. The post-central ROI shows no FA peaks and a lower RI for all 5 atlases (Fig.2H). These profiles are highly correlated across scans and subjects for all 5 atlases (Fig.3), demonstrating the robustness of this method. The mean correlation coefficient generally increases with the ROI size (Fig.3F).The distribution of FA/FAdiff and RI/RImax on cortical surfaces shows similarities across scans and subjects (Fig.4). For example, the post-central gyrus shows thin bands of high FA/RI at the crown (white arrowheads) next to a wide band of low RI1,4 (magenta arrowheads). At the middle curvature and cortical depths, the FA vs. curvature profiles are densely distributed and overlapped (Fig.5A, white arrowheads), corresponding to the FA peaks in the FA vs. cortical depth profiles (Fig.5E, green arrowheads) and the FAdiff peak in the FAdiff vs. curvature profiles (Fig.5C, magenta arrowheads). RI decreases from the crown to the fundus more drastically at larger cortical depths3 (Fig.5B), while RImax occurs at smaller cortical depths when moving from the fundus to the crown (orange arrowheads). Finally, the post-central ROI shows unique profiles with a lower RI/RImax and FAdiff (red arrowheads).
Conclusion
We used a column-based analysis of 0.9-mm isotropic whole-brain DTI data to achieve a quantitative analysis of the FA/RI dependence on the cortical depth, curvature, and ROI across the brain of healthy subjects. This method provides robust and consistent, but also novel, results compared to previous studies1-4 and can potentially be used to provide quantitative biomarkers for various neurological disorders.Acknowledgements
This work was in part supported by a Wrenn Fellowship in Alzheimer’s Disease Research, a grant from the Foundation of the American Society of Neuroradiology, and grants R01 EB028644, R01 NS075017, and S10 OD021480 from the National Institutes of Health.References
[1] McNab, Jennifer A., et al. "Surface based analysis of diffusion orientation for identifying architectonic domains in the in vivo human cortex." Neuroimage 69 (2013): 87-100.
[2] Truong, Trong-Kha, Arnaud Guidon, and Allen W. Song. "Cortical depth dependence of the diffusion anisotropy in the human cortical gray matter in vivo." PloS one 9.3 (2014): e91424.
[3] Kleinnijenhuis, Michiel, et al. "Diffusion tensor characteristics of gyrencephaly using high resolution diffusion MRI in vivo at 7T." Neuroimage 109 (2015): 378-387.
[4] Gulban, Omer F., et al. "Cortical fibers orientation mapping using in-vivo whole brain 7 T diffusion MRI." NeuroImage 178 (2018): 104-118.
[5] Chen, Nan-kuei, et al. "A robust multi-shot scan strategy for high-resolution diffusion weighted MRI enabled by multiplexed sensitivity-encoding (MUSE)." Neuroimage 72 (2013): 41-47.
[6] Bruce, Iain P., et al. "3D-MB-MUSE: A robust 3D multi-slab, multi-band and multi-shot reconstruction approach for ultrahigh resolution diffusion MRI." Neuroimage 159 (2017): 46-56.
[7] Veraart, Jelle, et al. "Denoising of diffusion MRI using random matrix theory." Neuroimage 142 (2016): 394-406.
[8] Veraart, Jelle, Els Fieremans, and Dmitry S. Novikov. "Diffusion MRI noise mapping using random matrix theory." Magnetic resonance in medicine 76.5 (2016): 1582-1593.
[9] Kellner, Elias, et al. "Gibbs‐ringing artifact removal based on local subvoxel‐shifts." Magnetic resonance in medicine 76.5 (2016): 1574-1581.
[10] Andersson, Jesper LR, Stefan Skare, and John Ashburner. "How to correct susceptibility distortions in spin-echo echo-planar images: application to diffusion tensor imaging." Neuroimage 20.2 (2003): 870-888.
[11] Andersson, Jesper LR, and Stamatios N. Sotiropoulos. "An integrated approach to correction for off-resonance effects and subject movement in diffusion MR imaging." Neuroimage 125 (2016): 1063-1078.
[12] Zhang, Yongyue, Michael Brady, and Stephen Smith. "Segmentation of brain MR images through a hidden Markov random field model and the expectation-maximization algorithm." IEEE transactions on medical imaging 20.1 (2001): 45-57.
[13] Smith, Stephen M., et al. "Advances in functional and structural MR image analysis and implementation as FSL." Neuroimage 23 (2004): S208-S219.
[14] Tournier, J-Donald, et al. "MRtrix3: A fast, flexible and open software framework for medical image processing and visualisation." NeuroImage 202 (2019): 116137.
[15] Avants, Brian B., Nick Tustison, and Gang Song. "Advanced normalization tools (ANTS)." Insight j 2.365 (2009): 1-35.
[16] Fischl, Bruce, et al. "High‐resolution intersubject averaging and a coordinate system for the cortical surface." Human brain mapping 8.4 (1999): 272-284.
[17] Viessmann, Olivia, et al. "Dependence of resting-state fMRI fluctuation amplitudes on cerebral cortical orientation relative to the direction of B0 and anatomical axes." NeuroImage 196 (2019): 337-350.
[18] Cammoun, Leila, et al. "Mapping the human connectome at multiple scales with diffusion spectrum MRI." Journal of neuroscience methods 203.2 (2012): 386-397.
Figures