0297
The spectral tilt plot (STP) – new microstructure signatures from spectrally anisotropic b-tensor encoding1Danish Research Centre for Magnetic Resonance, Centre for Functional and Diagnostic Imaging and Research, Copenhagen University Hospital Hvidovre, Copenhagen, Denmark, 2Random Walk Imaging, Lund, Sweden, 3Clinical Sciences, Lund University, Lund, Sweden, 4Department of Applied Mathematics and Computer Science, Technical University of Denmark, Copenhagen, Denmark
Synopsis
Tensor-valued diffusion encoding can probe diffusion tensor distribution unconfounded by orientation and heterogeneity. Since different cell morphologies may yield similar apparent diffusion tensors, inferring specific microstructural features remains challenging. Further information can be accessed by considering time-dependent diffusion. We show that rotational dependence of spherical tensor encoding, caused by spectral anisotropy, can be prominent on a preclinical scanner. The presented analysis may reveal different microstructural signatures depending on cell shape, which could be relevant for tissue modelling. Our results on fixed monkey brain suggest that brain cells exhibit anisotropic restricted diffusion along all directions, unlike in the cylindrical diffusion model.
Introduction
Tensor-valued diffusion encoding employs b-tensors of varying shapes such as in linear tensor encoding (LTE) or spherical tensor encoding (STE) to probe diffusion tensor distribution unconfounded by orientation and heterogeneity1-10. However, inferring specific cell morphologies from apparent diffusion tensors remains challenging.Time-dependent diffusion (TDD) can confound microstructure assessments when different b-tensors are not tuned, i.e. have different sensitivities to TDD11,12. We have shown how STE combined with tuned/detuned LTE can simultaneously asses size and anisotropy11.
TDD may cause STE to not be rotationally invariant12-14, which may add to the intra-compartmental kurtosis in the second-order attenuation14,15. However, rotational dependence of STE, detectable also at low b, is a consequence of orientation dependent sensitivity to TDD or spectral anisotropy12,16.
In clinical setting, a preliminary study has shown that STE is rotationally invariant in healthy brain17. However, our pre-clinical experiments enabling much shorter encoding times reveal strong TDD on a fixed monkey brain11.
Here we account for the spectral principle axes system (SPAS), identify the low frequency axis ($$$\mathbf{u}_\mathrm{LF}$$$) and sort apparent diffusivities ($$$D$$$) based on the angles $$$\sigma$$$ between $$$\bf{u}_\mathrm{LF}$$$ and the main diffusion tensor axes ($$$\boldsymbol{\mu}$$$). With simplistic restricted diffusion models we illustrate how the "spectral tilt plot" (STP), i.e. $$$D$$$ vs. $$$\sigma$$$, could reveal different microstructural signatures. The microstructures sensed in the monkey brain can be inferred from comparison with our models.
Theory
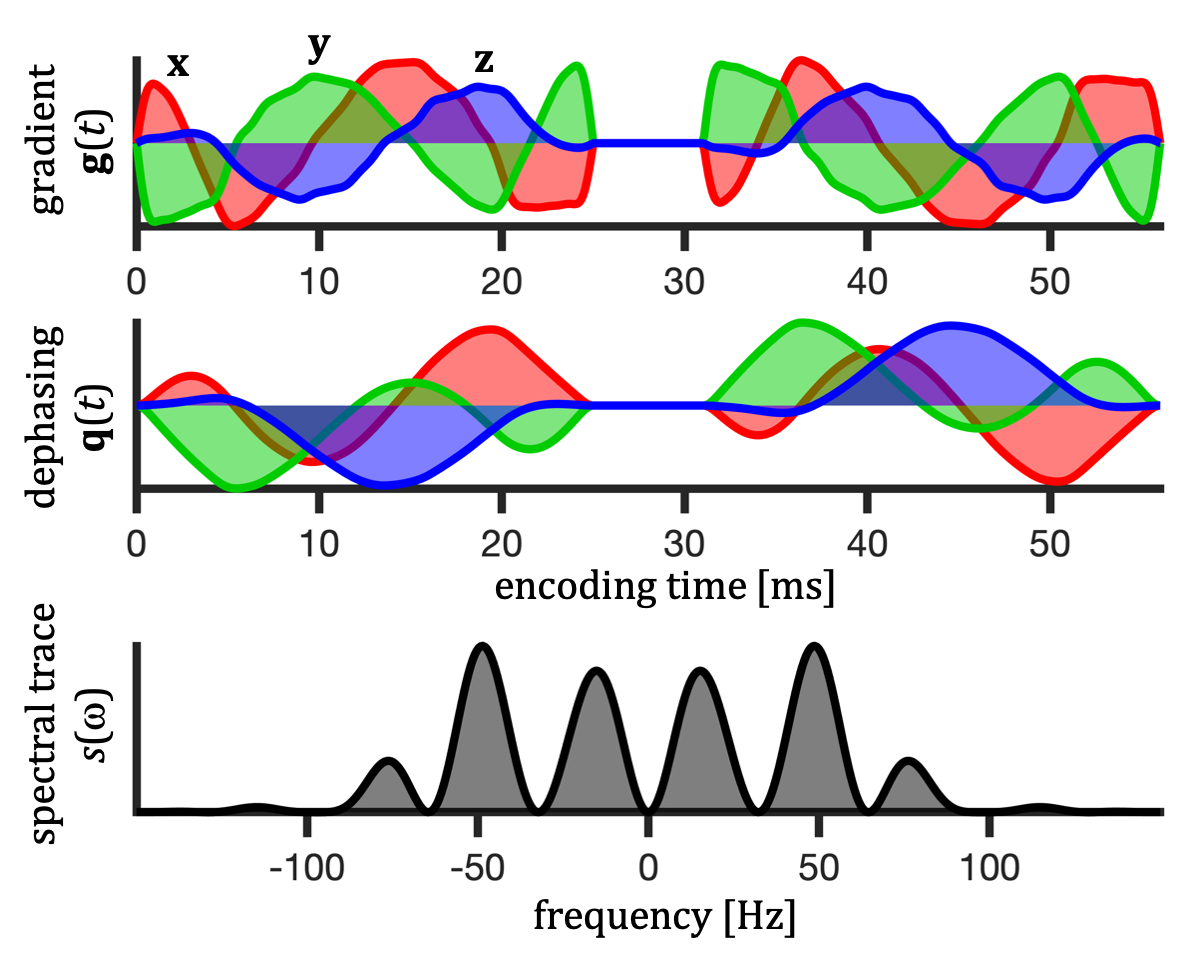
For a given diffusion spectrum $$$D_{ij}(\omega)$$$, the apparent diffusivity ($$$D$$$) can be calculated based on the encoding spectra $$$s_{ij}(\omega)$$$ defined in terms of the Fourier transforms of dephasing waveforms $$$\mathbf{q}(t)$$$ (see Fig. 1), $$ s_{ij}(\omega) \equiv q_i(\omega)\bar{q}_j(\omega). $$In calculations (Fig. 3) we used axisymmetric $$$D_{ij}(\omega)$$$ for restricted diffusion with known eigen-spectra12,18 $$$\lambda_1(\omega) = \lambda_2(\omega)\neq \lambda_3(\omega)$$$. $$$D$$$ can in this case be expressed with polar and azimuthal angles $$$\theta$$$ and $$$\phi$$$ as \begin{equation} \begin{split} D(\theta,\phi) = (\sin^2\phi+\cos^2\phi \cos^2\theta) \Lambda_{111} + \cos^2{\phi} \sin^2\theta \Lambda_{113} + \\ (\cos^2{\phi} + \sin^2\phi \cos^2\theta) \Lambda_{221} + \sin^2\phi \sin^2\theta \Lambda_{223} + \\ \sin^2\theta \Lambda_{331} + \cos^2\theta \Lambda_{333} + \\ 2 \, \cos{\phi} \, \cos{\theta} \, \sin{\theta} \, \Delta_{13} + 2 \, \cos{\phi} \, \sin{\phi} \, \sin^2\theta \, \Delta_{12} + 2 \, \sin{\phi} \, \cos{\theta} \, \sin{\theta} \, \Delta_{23}, \end{split} \end{equation} where $$ \Lambda_{ijk} \equiv \frac{1}{b} \frac{1}{2\pi} \int_{-\infty}^{\infty} s_{ij}(\omega) \lambda_k(\omega) d\omega,$$ $$ \Delta_{ij} \equiv \Lambda_{ij3} - \Lambda_{ij1}$$ and the b-value is given by the spectral trace $$$s(\omega)$$$12 as $$ b=\frac{1}{2\pi}\int_{-\infty}^{\infty}s(\omega)d\omega.$$
Calculations
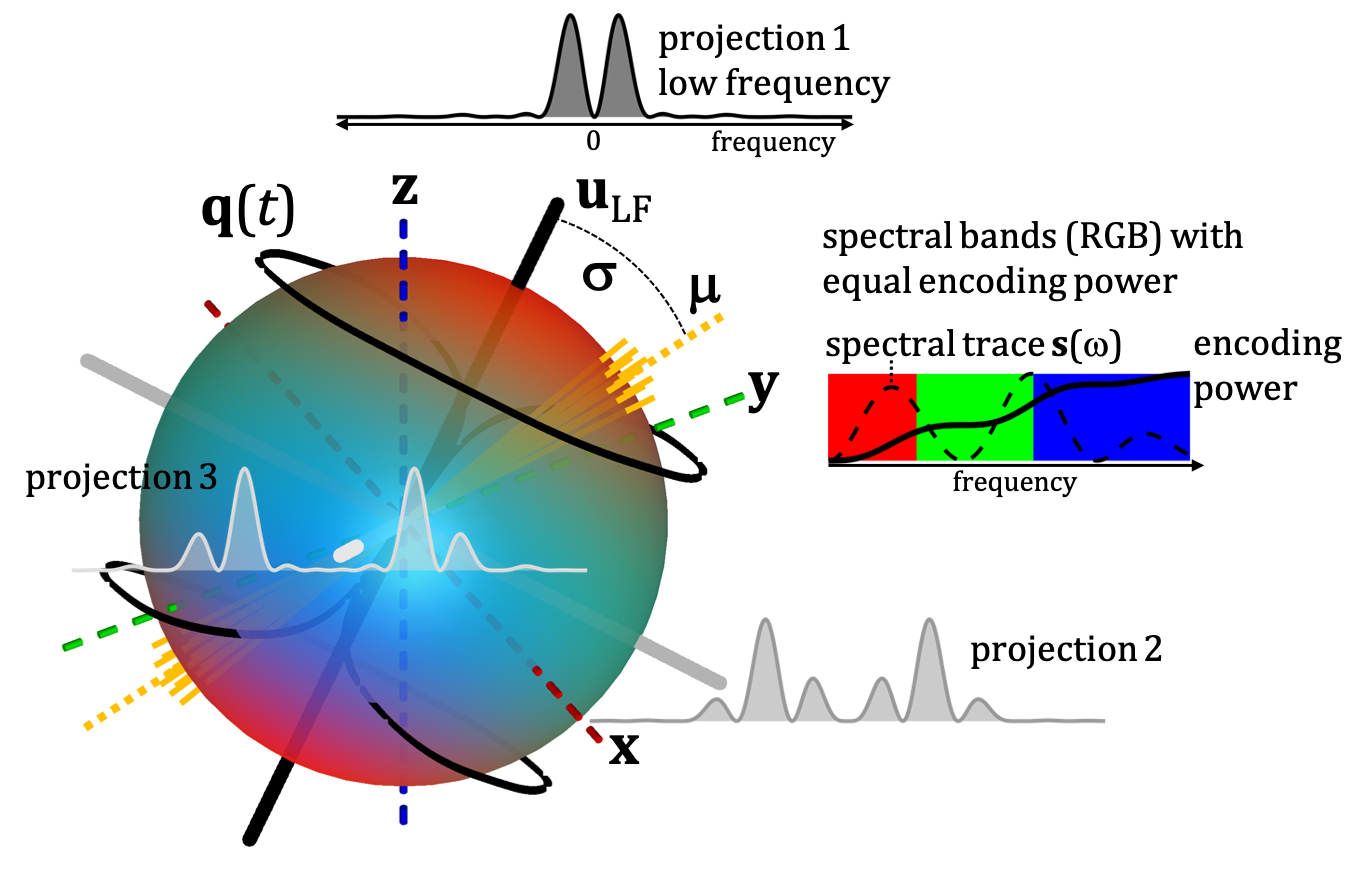
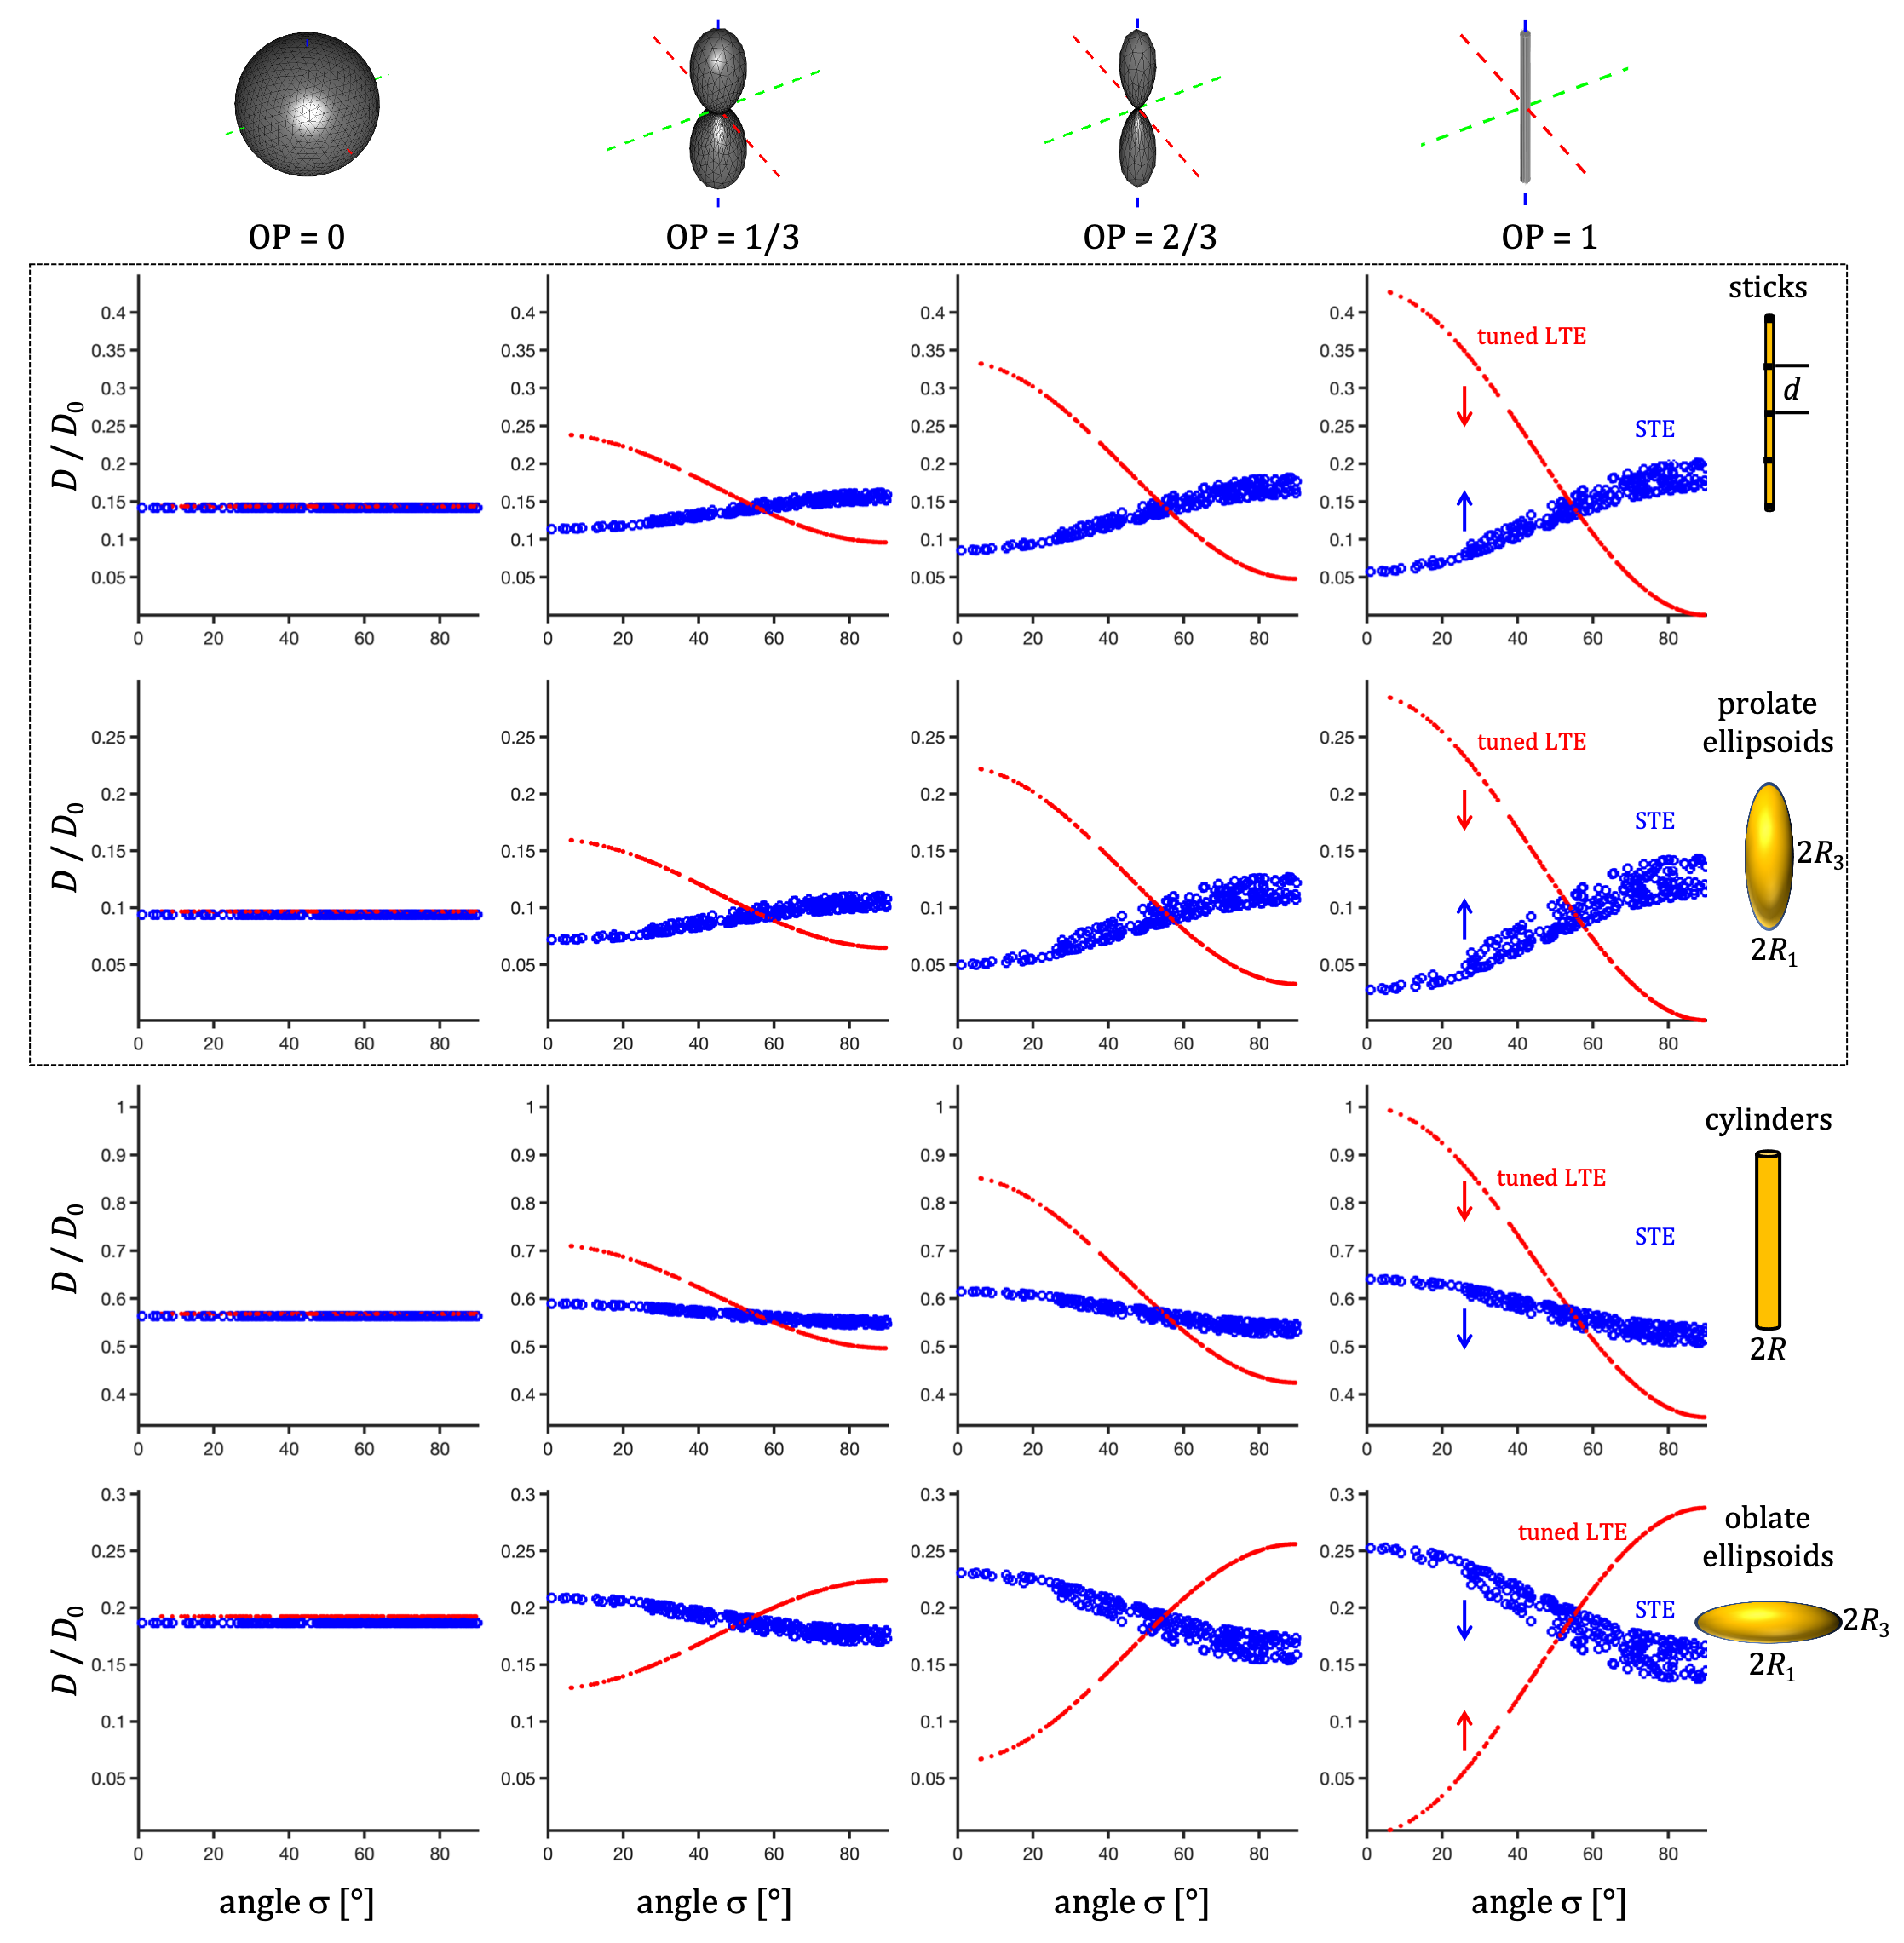
Spectral anisotropy was color coded based on weighting given by projections of encoding spectra12. The low frequency band was adjusted based on $$$s(\omega)$$$ to account for the cumulative power of $$$b/3$$$. The SPAS was determined by the eigenvectors of the low band filtered b-tensors (Fig. 2), where $$$\bf{u}_\mathrm{LF}$$$ corresponds to the largest eigenvalue. The angle relative to the main diffusion axis $$$\boldsymbol{\mu}$$$ is given by $$$\sigma = \arccos{(\boldsymbol{\mu} \cdot \bf{u}_\mathrm{LF})}$$$.$$$\lambda(\omega)$$$ were calculated for compartments with varying degrees of normalized apparent diffusion anisotropy ($$$D_\Delta$$$)5,6, i.e. thin sticks with longitudinal restricted diffusion, prolate and oblate ellipsoids, and cylinders (see details in the Fig. 3 caption).
Watson orientation distribution function (ODF) was used with order parameters (OP)5,6 of 0, 1/3, 2/3 and 1. To cover the full range of $$$\sigma$$$, $$$\boldsymbol{\mu}$$$ was rotated along 15 uniform directions.
Experiment
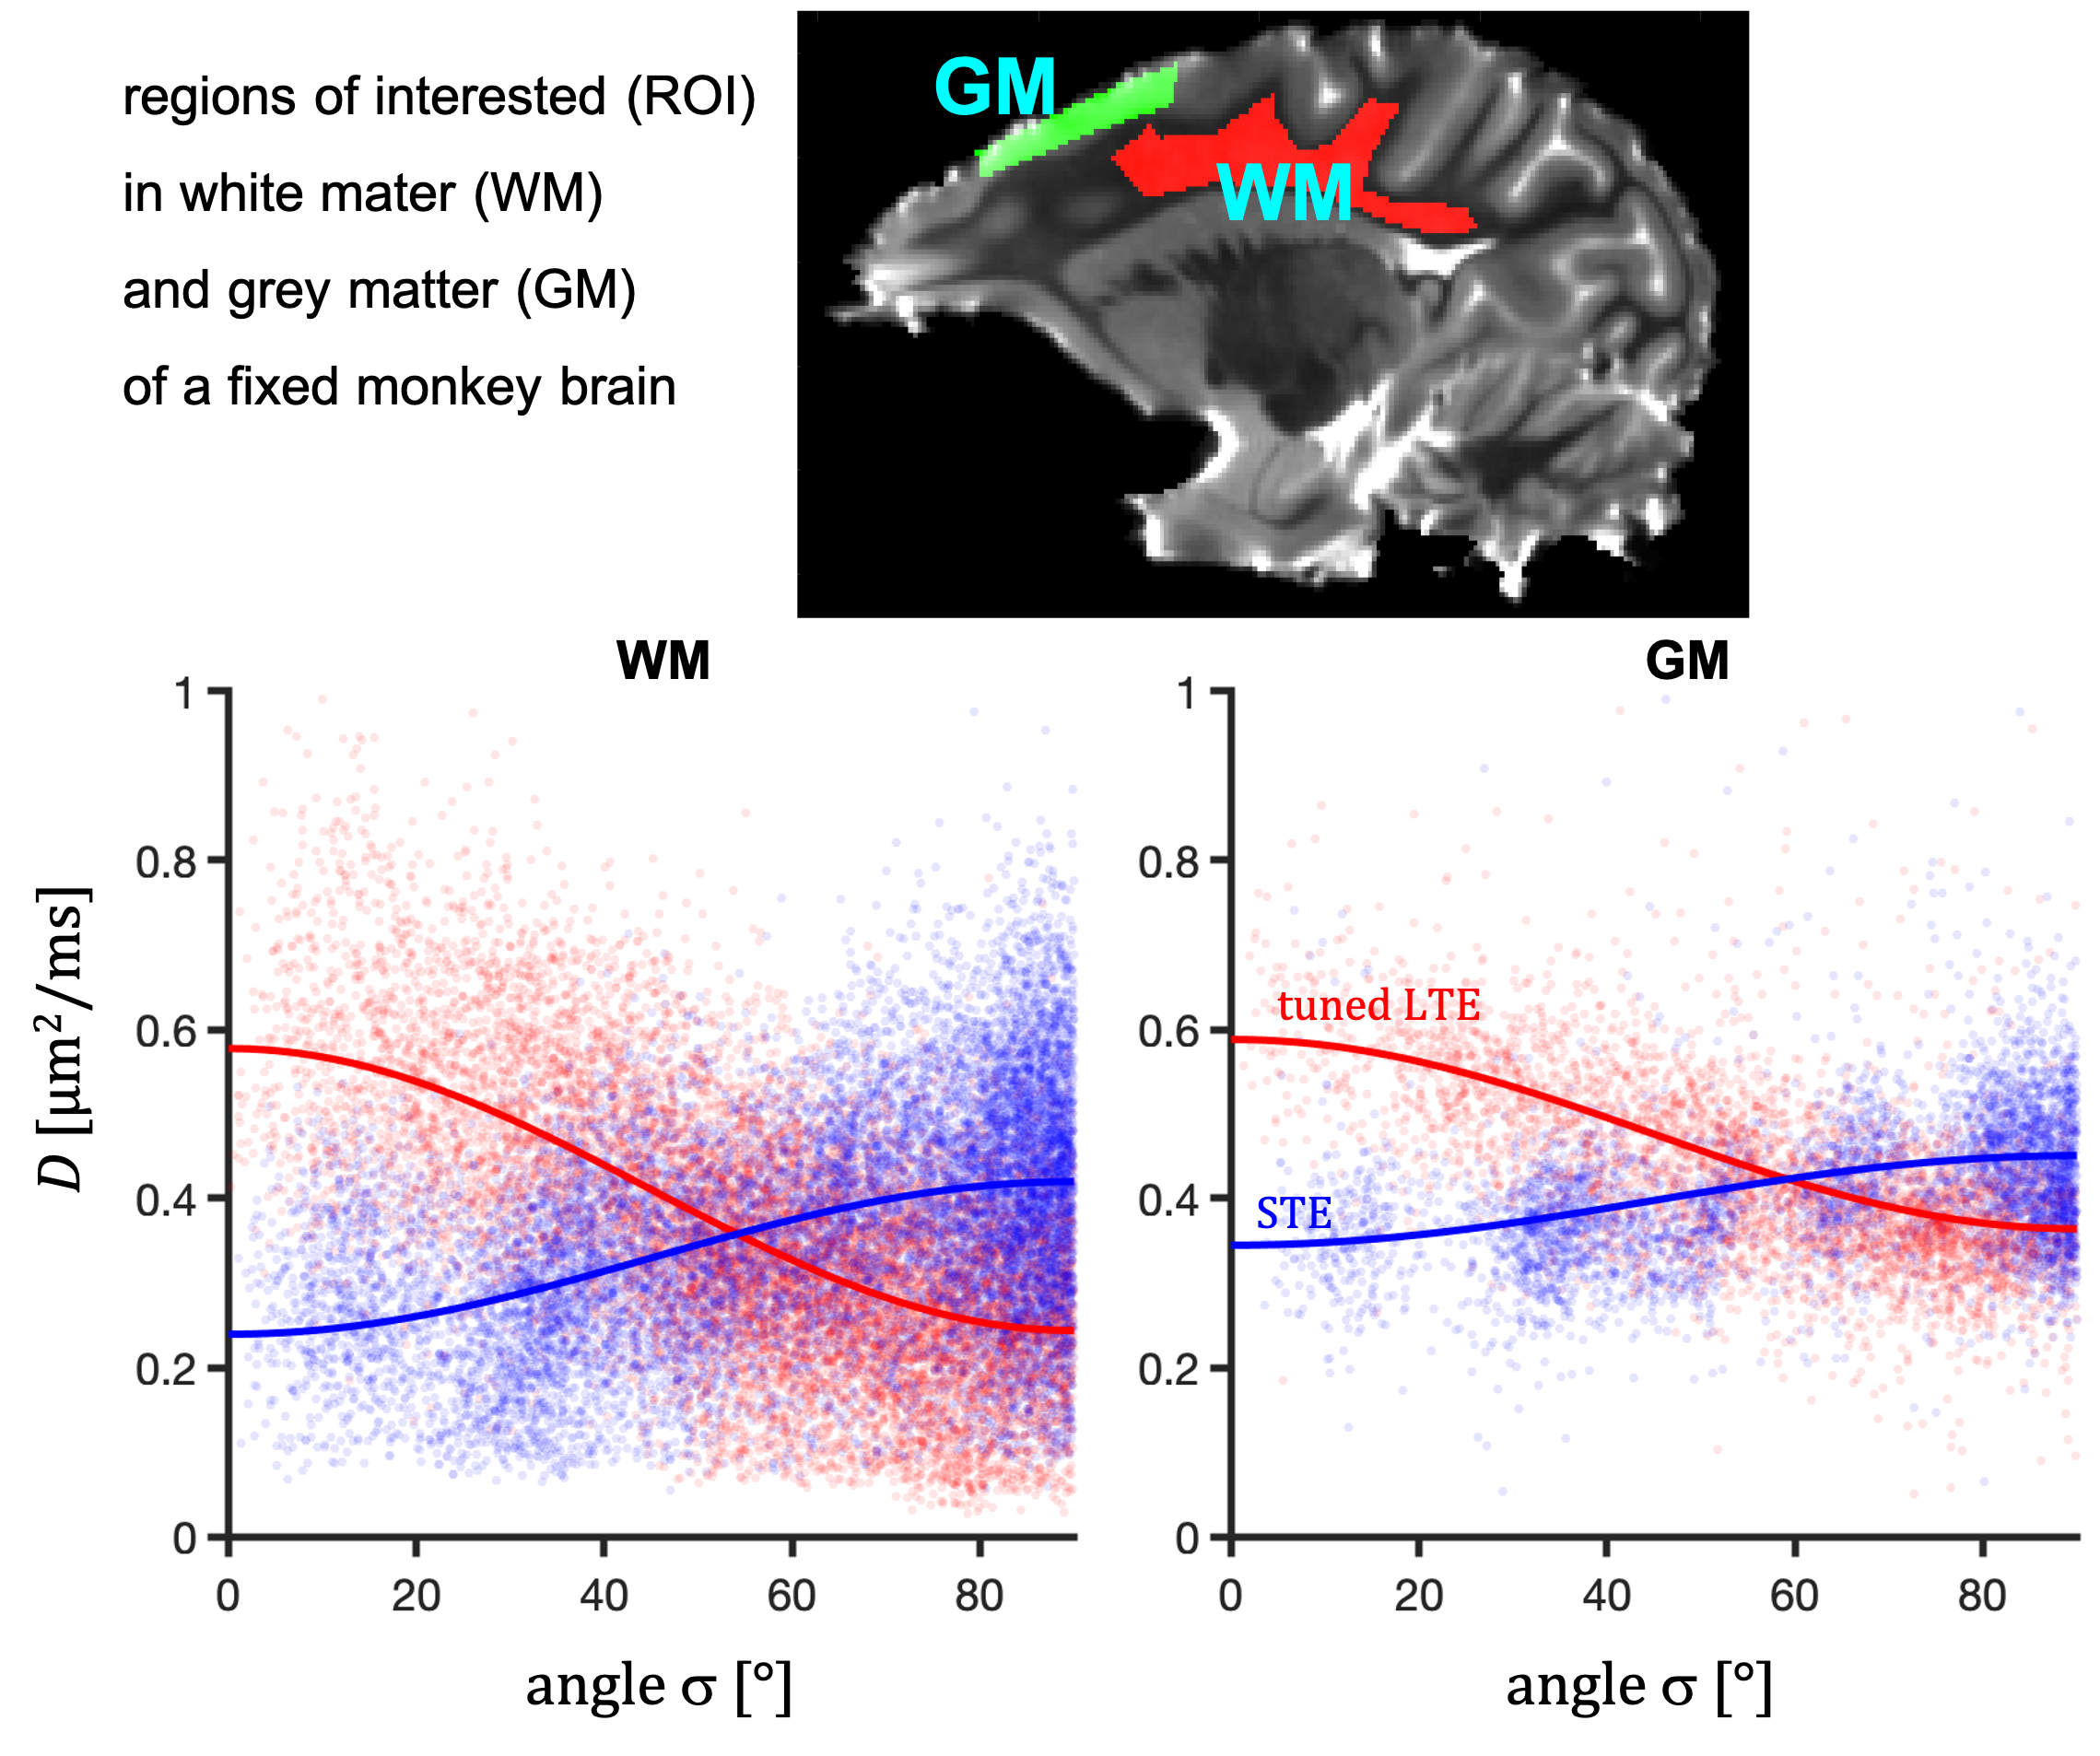
Data from an excised brain of a 3.5 year old vervet monkey were acquired on a 4.7 T preclinical system at 23.0 $$$\pm$$$ 0.2 $$$^\circ$$$C as previously described11. The same 12 b-values between 240 and 4800 $$$\mathrm{s/mm^2}$$$ were used for STE and tuned LTE. $$$\bf{u}_\mathrm{LF}$$$ was rotated along 15 uniform directions (Fig. 1). STE employed q-MAS19 and the LTE was given by a single channel from STE (projection 2 in Fig. 2). Apparent diffusivities were obtained from low b-values.Results and Discussion
Spectral anisotropy can be assessed by determining the SPAS, i.e. by finding the eigen representation of the filtered b-tensor. The low frequency band is most sensitive to restricted diffusion. Projections along the SPAS show that our STE is spectrally nearly axisymmetric with significantly more low frequency power along $$$\bf{u}_\mathrm{LF}$$$ (projection 1, Fig. 2).Fig. 3 illustrates different predicted signatures for $$$D$$$ vs. $$$\sigma$$$. As expected, the modulation increases with increasing OP. Importantly, TDD leads to modulation also for STE. At larger $$$\sigma$$$, STE yields increasingly wider range of $$$D$$$ due to small differences in spectral content between the tangential axes (projections 2 and 3 in Fig. 2).
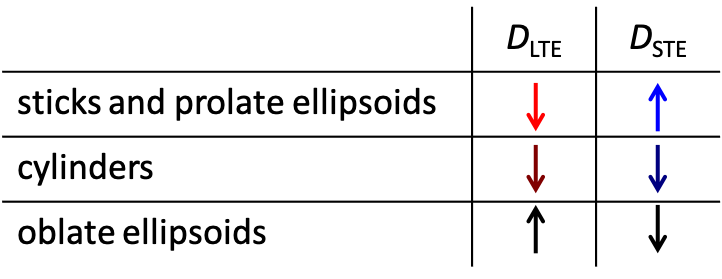
Three distinct modulation patterns are visible in Fig. 3 and summarized in Table 1: (1) For sticks and prolate ellipsoids, $$$D$$$ decrease/increase with $$$\sigma$$$ for LTE/STE. (2) For cylinders, $$$D$$$ decrease with $$$\sigma$$$ for LTE and STE. (3) For oblate ellipsoids $$$D$$$ increase/decrease for LTE/STE. We can see that in all cases STE and LTE yield similar diffusivities at approximately $$$\sigma \approx 54.7^{\circ}$$$, which corresponds to the projection where LTE and STE have equivalent power spectra.
Conclusion
Considering spectral anisotropy in tensor-valued encoding reveals different microstructural signatures depending on the shape of restricted compartments. The suggested analysis could be useful in identifying relevant tissue models. Our results on fixed monkey brain suggest that brain cells exhibit anisotropic restricted diffusion along all directions, unlike in the cylindrical diffusion model. Future work will focus on more quantitative analysis and possibilities to further experimentally exploit spectral anisotropy.Acknowledgements
This project has received funding from the European Research Council (ERC) under the European Union’s Horizon 2020 research and innovation programme (grant agreement No 804746). SL is also supported by Random Walk Imaging.References
1. S. Eriksson, S. Lasič, and D. Topgaard, Isotropic diffusion weighting in PGSE NMR by magic- angle spinning of the q-vector., Journal of Magnetic Resonance 226, 13 (2013).
2. S. Lasič, F. Szczepankiewicz, S. Eriksson, M. Nilsson, and D. Topgaard, Microanisotropy imaging: quantification of microscopic diffusion anisotropy and orientational order parameter by diffusion MRI with magic-angle spinning of the q-vector, Frontiers in Physics 2, 1 (2014).
3. F. Szczepankiewicz, S. Lasič, D. van Westen, P. C. Sundgren, E. Englund, C.-F. Westin, F. Ståhlberg, J. Lätt, D. Topgaard, and M. Nilsson, Quantification of microscopic diffusion anisotropy disentangles effects of orientation dispersion from microstructure: applications in healthy volunteers and in brain tumors., NeuroImage 104, 241 (2015).
4. C.-F. Westin, H. Knutsson, O. Pasternak, F. Szczepankiewicz, M. Kubicki, D. Topgaard, and M. Nilsson, Q-space trajectory imaging for multidimensional diffusion MRI of the human brain, Neuroimage 135, 345 (2016).
5. D. Topgaard, Multidimensional diffusion MRI, Journal of Magnetic Resonance 275, 98 (2017).
6. D. Topgaard, NMR methods for studying microscopic diffusion anisotropy, in Diffusion NMR of confined systems: fluid transport in porous solids and heterogeneous materials, New Devel- opments in NMR no. 9, edited by R. Valiullin (Royal Society of Chemistry, Cambridge, UK, 2017).
7. F. Szczepankiewicz, D. van Westen, E. Englund, C. F. Westin, F. Ståhlberg, J. Lätt, P. C. Sundgren, and M. Nilsson, The link between diffusion MRI and tumor heterogeneity: Mapping cell eccentricity and density by diffusional variance decomposition (DIVIDE), NeuroImage 142, 522 (2016).
8. D. Topgaard, Diffusion tensor distribution imaging, NMR in Biomedicine 32, 1 (2019).
9. M. Nilsson, F. Szczepankiewicz, J. Brabec, M. Taylor, C. F. Westin, A. Golby, D. van Westen, and P. C. Sundgren, Tensor-valued diffusion MRI in under 3 minutes: an initial survey of microscopic anisotropy and tissue heterogeneity in intracranial tumors, Magnetic Resonance in Medicine 83, 608 (2020), arXiv:1902.09986.
10. J. P. de Almeida Martins, C. M. Tax, A. Reymbaut, F. Szczepankiewicz, M. Chamberland, D. K. Jones, and D. Topgaard, Computing and visualising intra-voxel orientation-specific relaxation–diffusion features in the human brain, Human Brain Mapping, 1 (2020).
11. H. Lundell, M. Nilsson, T. B. Dyrby, G. J. Parker, P. L. Cristinacce, F. L. Zhou, D. Topgaard, and S. Lasič, Multidimensional diffusion MRI with spectrally modulated gradients reveals unprecedented microstructural detail, Scientific Reports 9, 1 (2019).
12. H. Lundell and S. Lasič, Diffusion encoding with general gradient waveforms, in Advanced Diffusion Encoding Methods in MRI: New Developments in NMR Volume 24, edited by D. Topgaard (Royal Society of Chemistry, Cambridge, UK, 2020).
13. T. M. De Swiet and P. P. Mitra, Possible Systematic Errors in Single-Shot Measurements of the Trace of the Diffusion Tensor, Journal of Magnetic Resonance, Series B 111, 15 (1996).
14. S. N. Jespersen, J. L. Olesen, A. Ianus, and N. Shemesh, Effects of nongaussian diffusion on “isotropic diffusion” measurements: An ex-vivo microimaging and simulation study, Journal of Magnetic Resonance 300, 84 (2019).
15. R. N. Henriques, S. N. Jespersen, and N. Shemesh, Correlation tensor magnetic resonance imaging, NeuroImage 211, 116605 (2020), arXiv:1908.00122.
16. H. Lundell, M. Nilsson, C.-F. Westin, D. Topgaard, and S. Lasič, Spectral anisotropy in multidimensional diffusion encoding, in Proc. Intl. Soc. Mag. Reson. Med. 26 (2018) p. 0887.
17. F. Szczepankiewicz, S. Lasic, M. Nilsson, H. Lundell, C.-F. Westin, and D. Topgaard, Is spherical diffusion encoding rotation invariant? An investigation of diffusion time- dependence in the healthy brain, in Proc. Intl. Soc. Mag. Reson. Med. 27 (2019) p. 0223.
18. J. Stepišnik, Time-dependent self-diffusion by NMR spin-echo, Physica B 183, 343 (1993).
19. D. Topgaard, Isotropic diffusion weighting in PGSE NMR: Numerical optimization of the q-MAS PGSE sequence, Microporous and Mesoporous Materials 178, 60 (2013).
Figures