0296
g-Ratio in the common marmoset: a comparison across different myelin-sensitive MRI metrics with b-tensor encoded diffusion1Neurology and Neurosurgery, McGill University, Montreal, QC, Canada, 2McConnell Brain Imaging Centre, Montreal Neurological Institute and Hospital, Montreal, QC, Canada, 3Diagnostic Radiology, Clinical Sciences Lund, Lund University, Lund, Sweden, 4Radiology, Brigham and Women's Hospital, Harvard Medical School, Boston, MA, United States, 5Comparative Medicine and Animal Resources Center, McGill University, Montreal, QC, Canada, 6Hotchkiss Brain Institute and Departments of Radiology and Clinical Neuroscience, University of Calgary, Calgary, AB, Canada, 7Department of Biomedical Engineering, McGill University, Montreal, QC, Canada
Synopsis
The g-ratio quantifies the relative thickness of the myelin sheath and can be estimated from myelin volume fraction (MVF) and axonal volume fraction (AVF) maps. The best MRI methods for deriving these metrics are still under investigation. This study examines the use of inhomogeneous magnetization transfer (ihMTsat) along with other myelin-sensitive metrics, and diffusion MRI with b-tensor encoding for calculating the g-ratio in a marmoset brain. We find that while the different myelin-sensitive metrics and diffusion microstructural models produce different MVF and AVF maps, the g-ratio values follow similar trends across the white matter.
Introduction
The relative thickness of the myelin sheath can be probed using multimodal quantitative MRI, but how to most accurately map it remains to be established. An aggregate g-ratio—the ratio of the inner to outer radii of the myelin sheath— can be computed within an imaging voxel from the myelin volume fraction (MVF) and axonal volume fraction (AVF)1. MVF has been determined by using a range of myelin-sensitive MRI methods for g-ratio calculation2–11. AVF has previously been calculated from data acquired with linear diffusion encoding1,12. The techniques used previously have limitations with respect to their microstructural specificity, which may affect the computed g-ratio. Here, we investigate the use of two contrast mechanisms (inhomogeneous magnetization transfer13 saturation (ihMTsat) and b-tensor encoded diffusion14) to estimate MVF and AVF, that may in part address these limitations. These methods are compared to other techniques for probing MVF and AVF. We investigate these methods in an anesthetized marmoset model, to permit future validation using histology.Methods
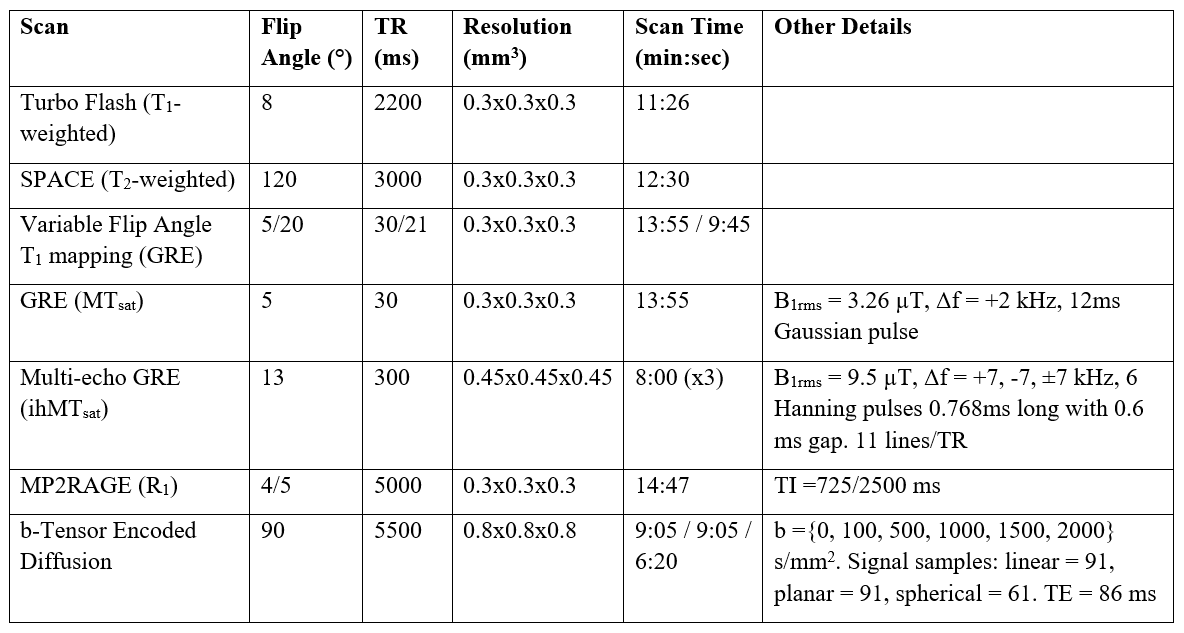
MRI images were collected in a live adult marmoset using a 3T-PrismaFit scanner (Siemens, Germany) with a specialized 16-channel marmoset RF coil15 over four sessions. Myelin-sensitive metrics R1, T1w, T1w/T2w, MTsat, and ihMTsat16 were collected for estimating myelin content. A prototype spin-echo EPI pulse sequence with tensor-valued diffusion encoding17 was used to yield linear, planar, and spherical b-tensors18,19 detailed in Figure 1.A T1-weighted anatomical scan from each session was used to generate a template with ANTs20. The transform was applied to the parameter maps after being calculated in the native imaging space. All maps were upsampled to 0.3 mm3 isotropic at the registration step. ROIs were taken from a marmoset atlas21 registered to the brain template in this study. The splenium and genu of the corpus callosum were manually delineated using ITK-snap22.
To use the original g-ratio imaging model1, MVF metrics should contain a zero intercept against a histological marker of myelin to demonstrate limited dependence on other macromolecules. We used the ihMTsat dataset as the myelin proxy, as ihMT has been previously shown to have a near-zero intercept with a histological marker of myelin23. We performed a two-parameter calibration where a linear model of ihMTsat vs each myelin-sensitive MRI metric was used to remove the y-offset. The slope of the MVF calibration was calculated by setting the g-ratio to be 0.7 in the corpus callosum, as was done previously4,11, using a sequence-specific calibration factor (α) with the following equation4,11: $$g_{MRI}=\sqrt{\frac{1}{1+\frac{\alpha M}{(1-\alpha M)(1-V_{iso})V_{ic}}}}$$
where M is a myelin-sensitive MRI metric minus the y-offset, and isotropic volume fraction (Viso) and intracellular volume fraction (Vic) are set to isotropic fraction (fISO) and intracellular fraction (fIC) from NODDI or the free water fraction (fFW) and tissue linear fraction (fTL) from CODIVIDE.
MVF is calculated as αM, and AVF as (1-αM)(1-Viso)Vic. The g-ratio maps are WM masked, as the current g-ratio model has not been validated with the complex microstructure of the GM. Boxplots were used to compare the resulting g-ratio values across the five WM regions.
Results and Discussion
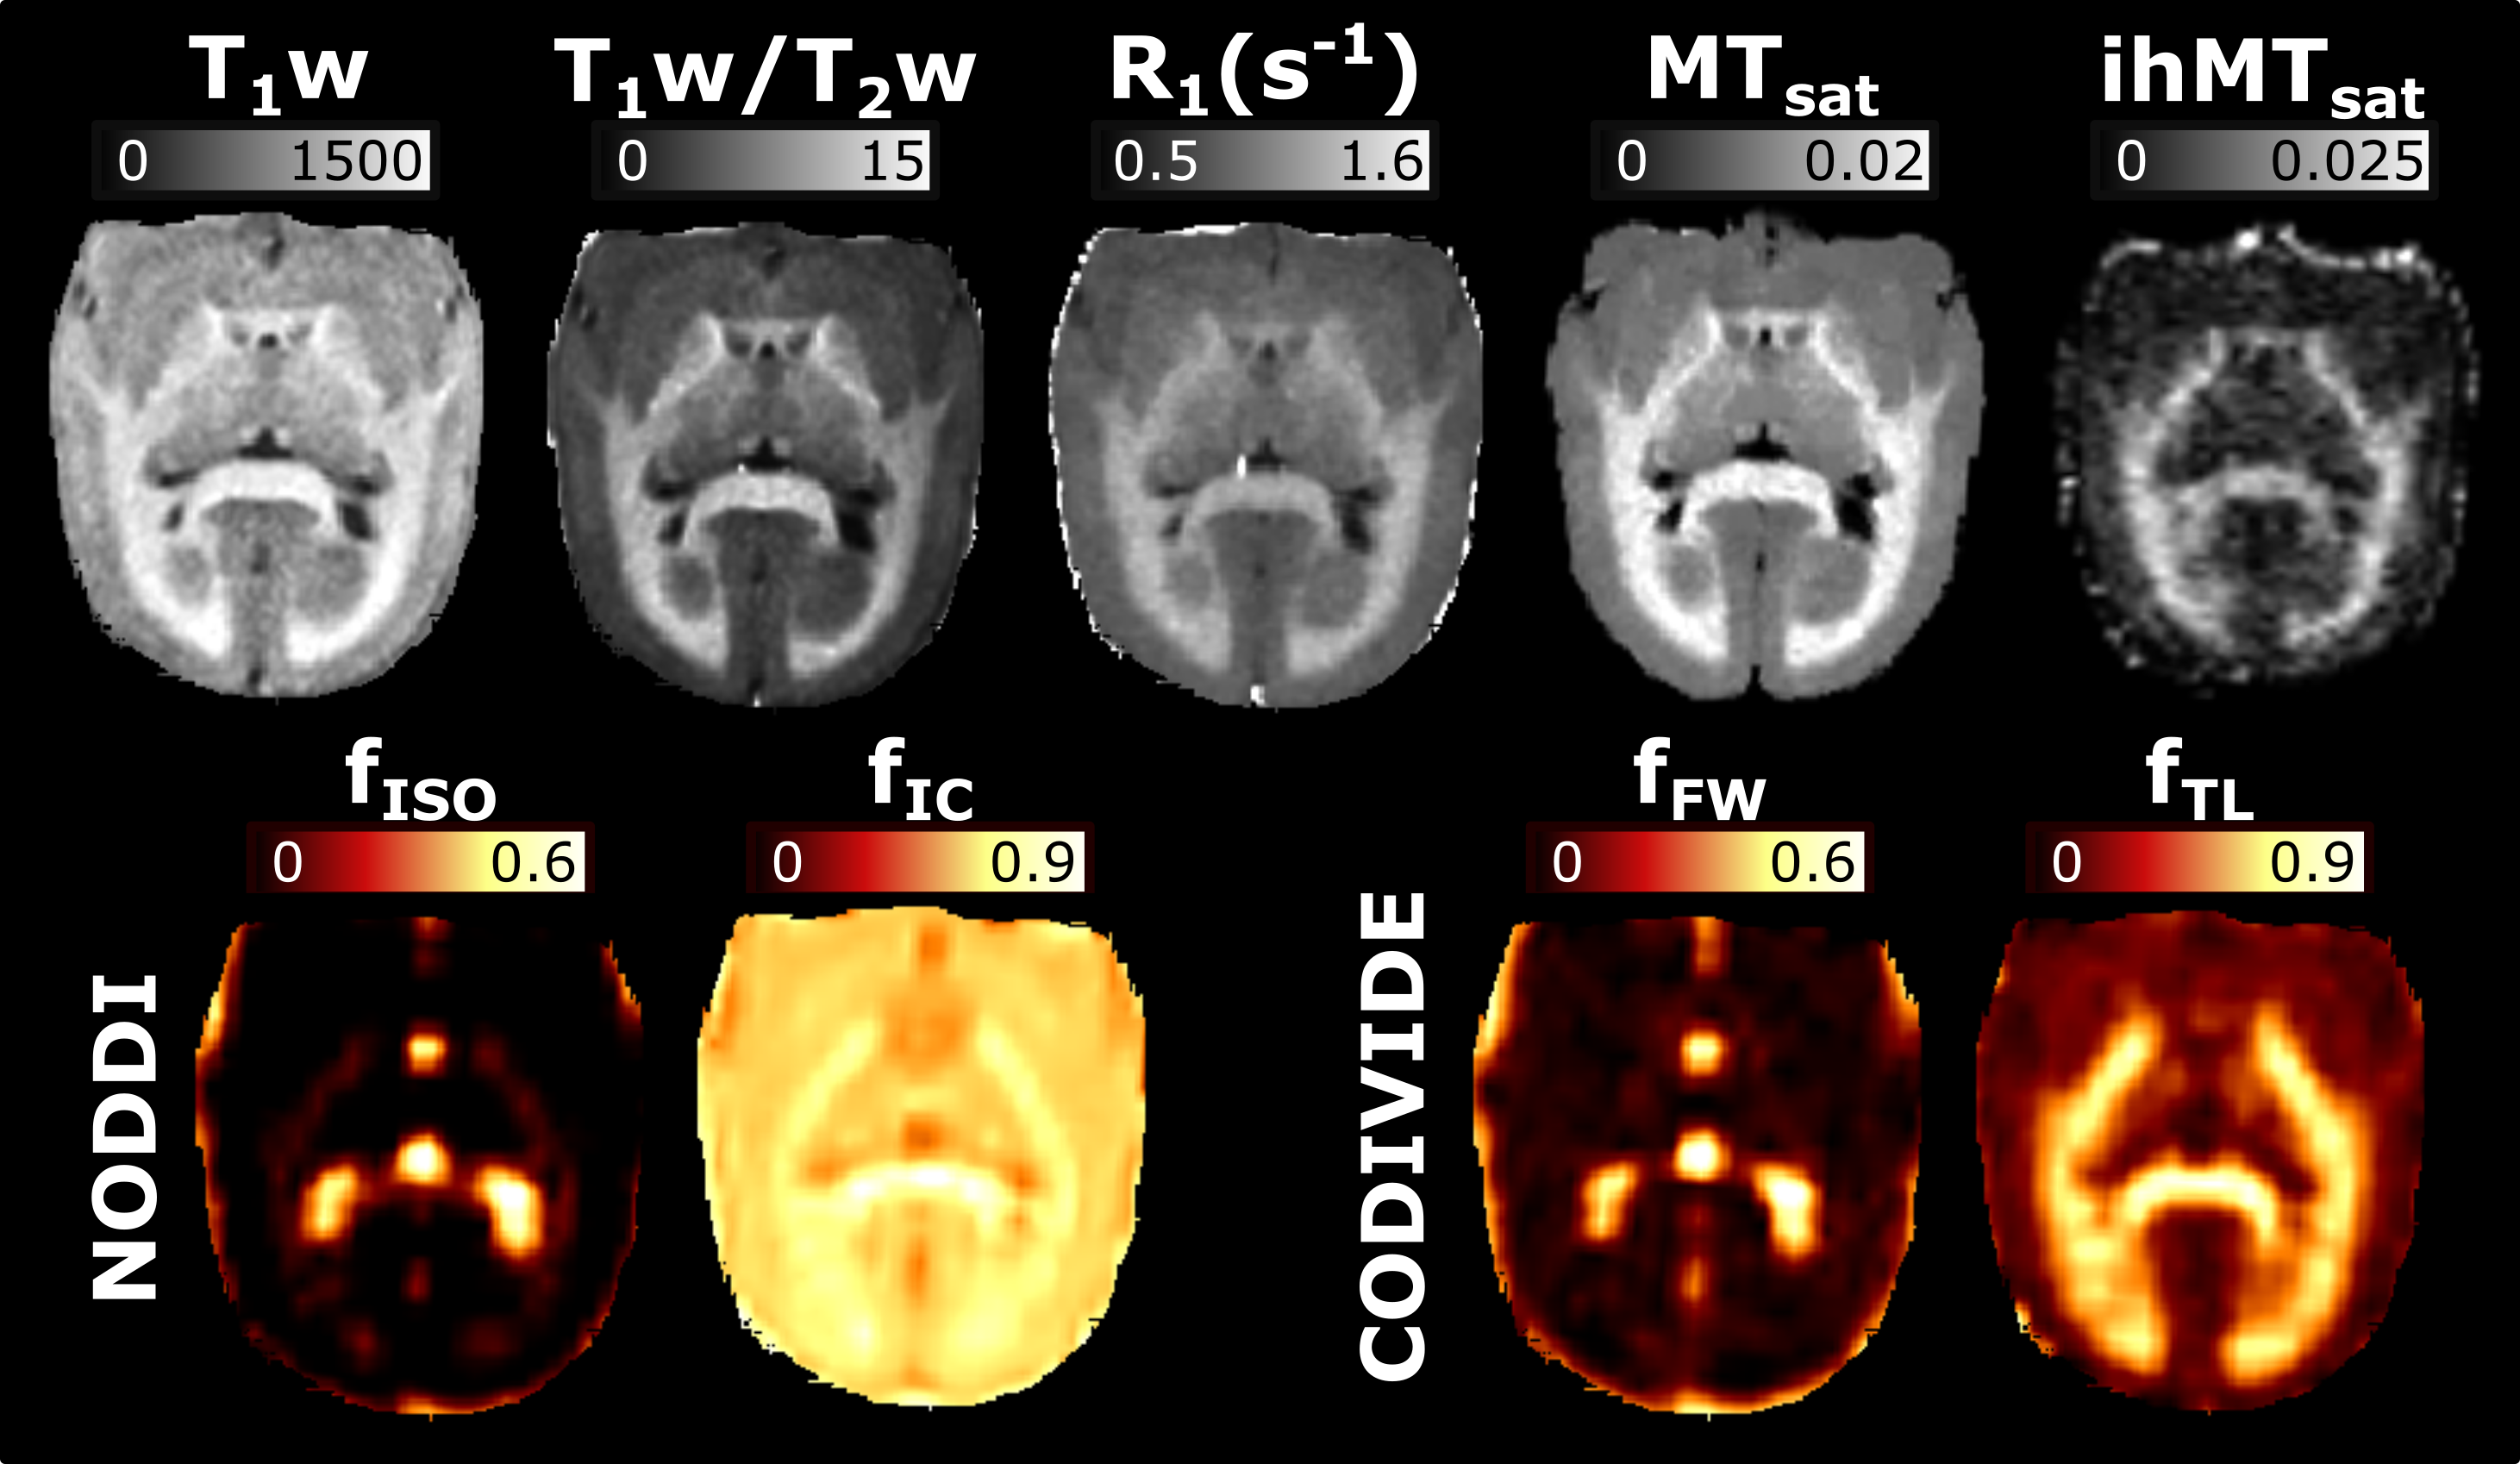
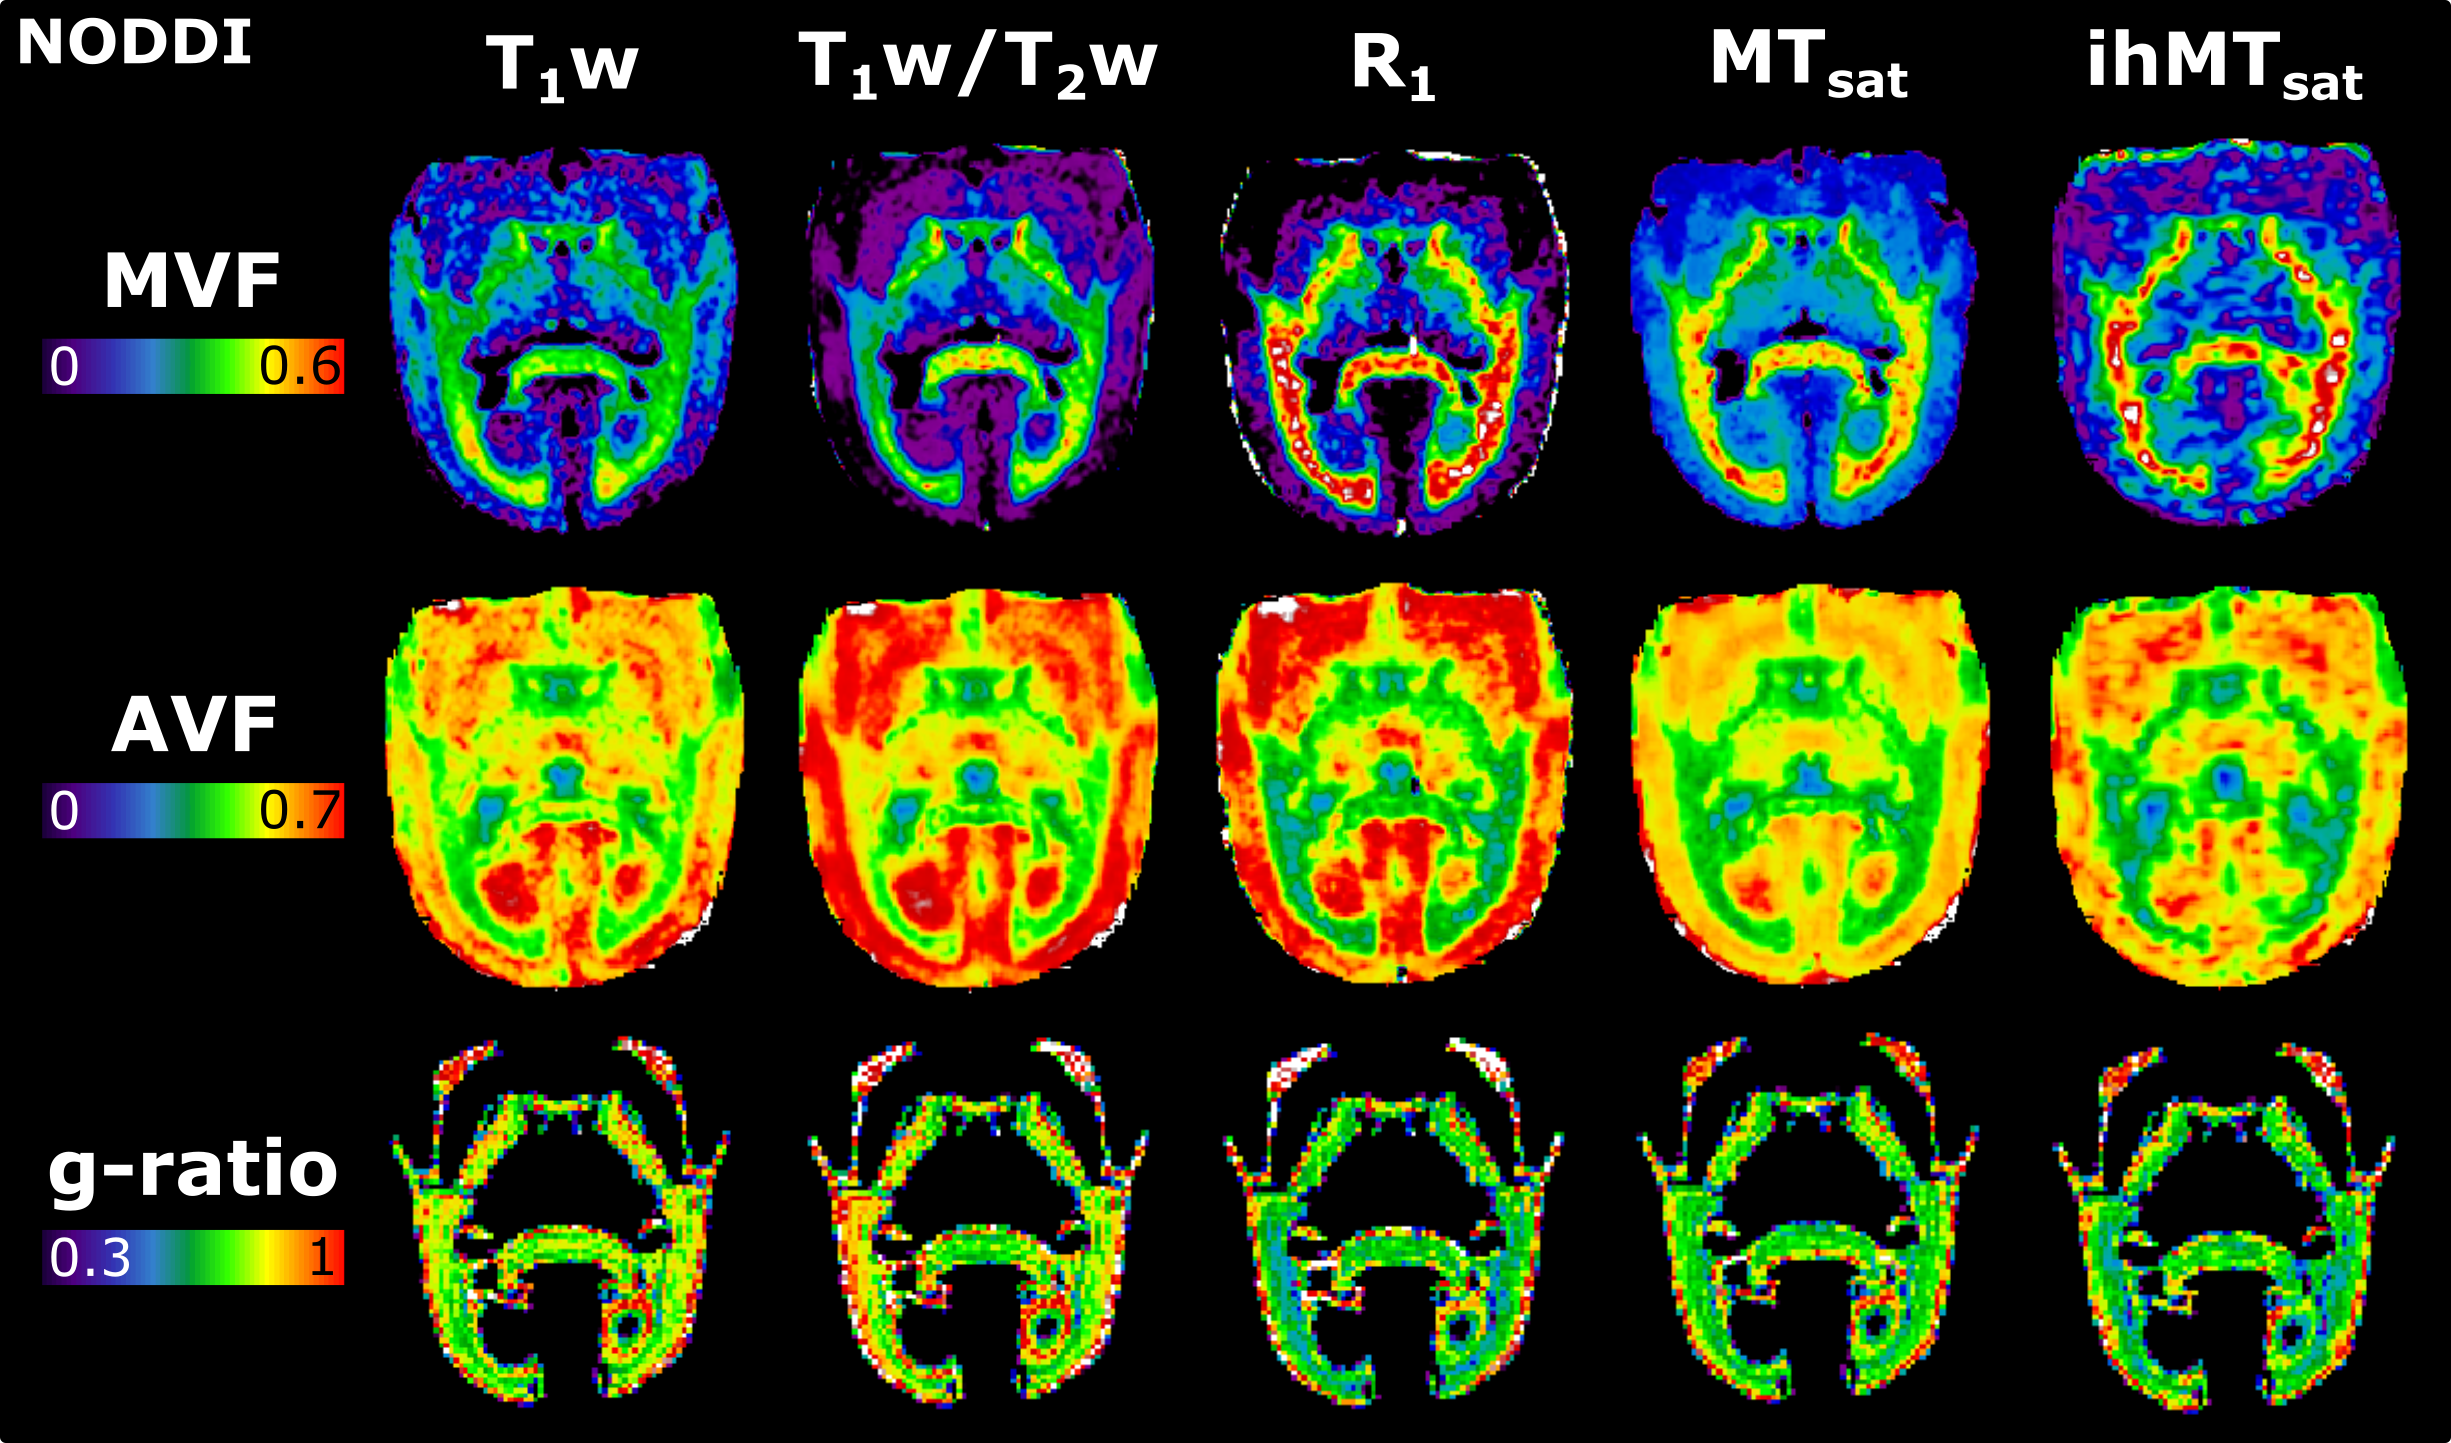
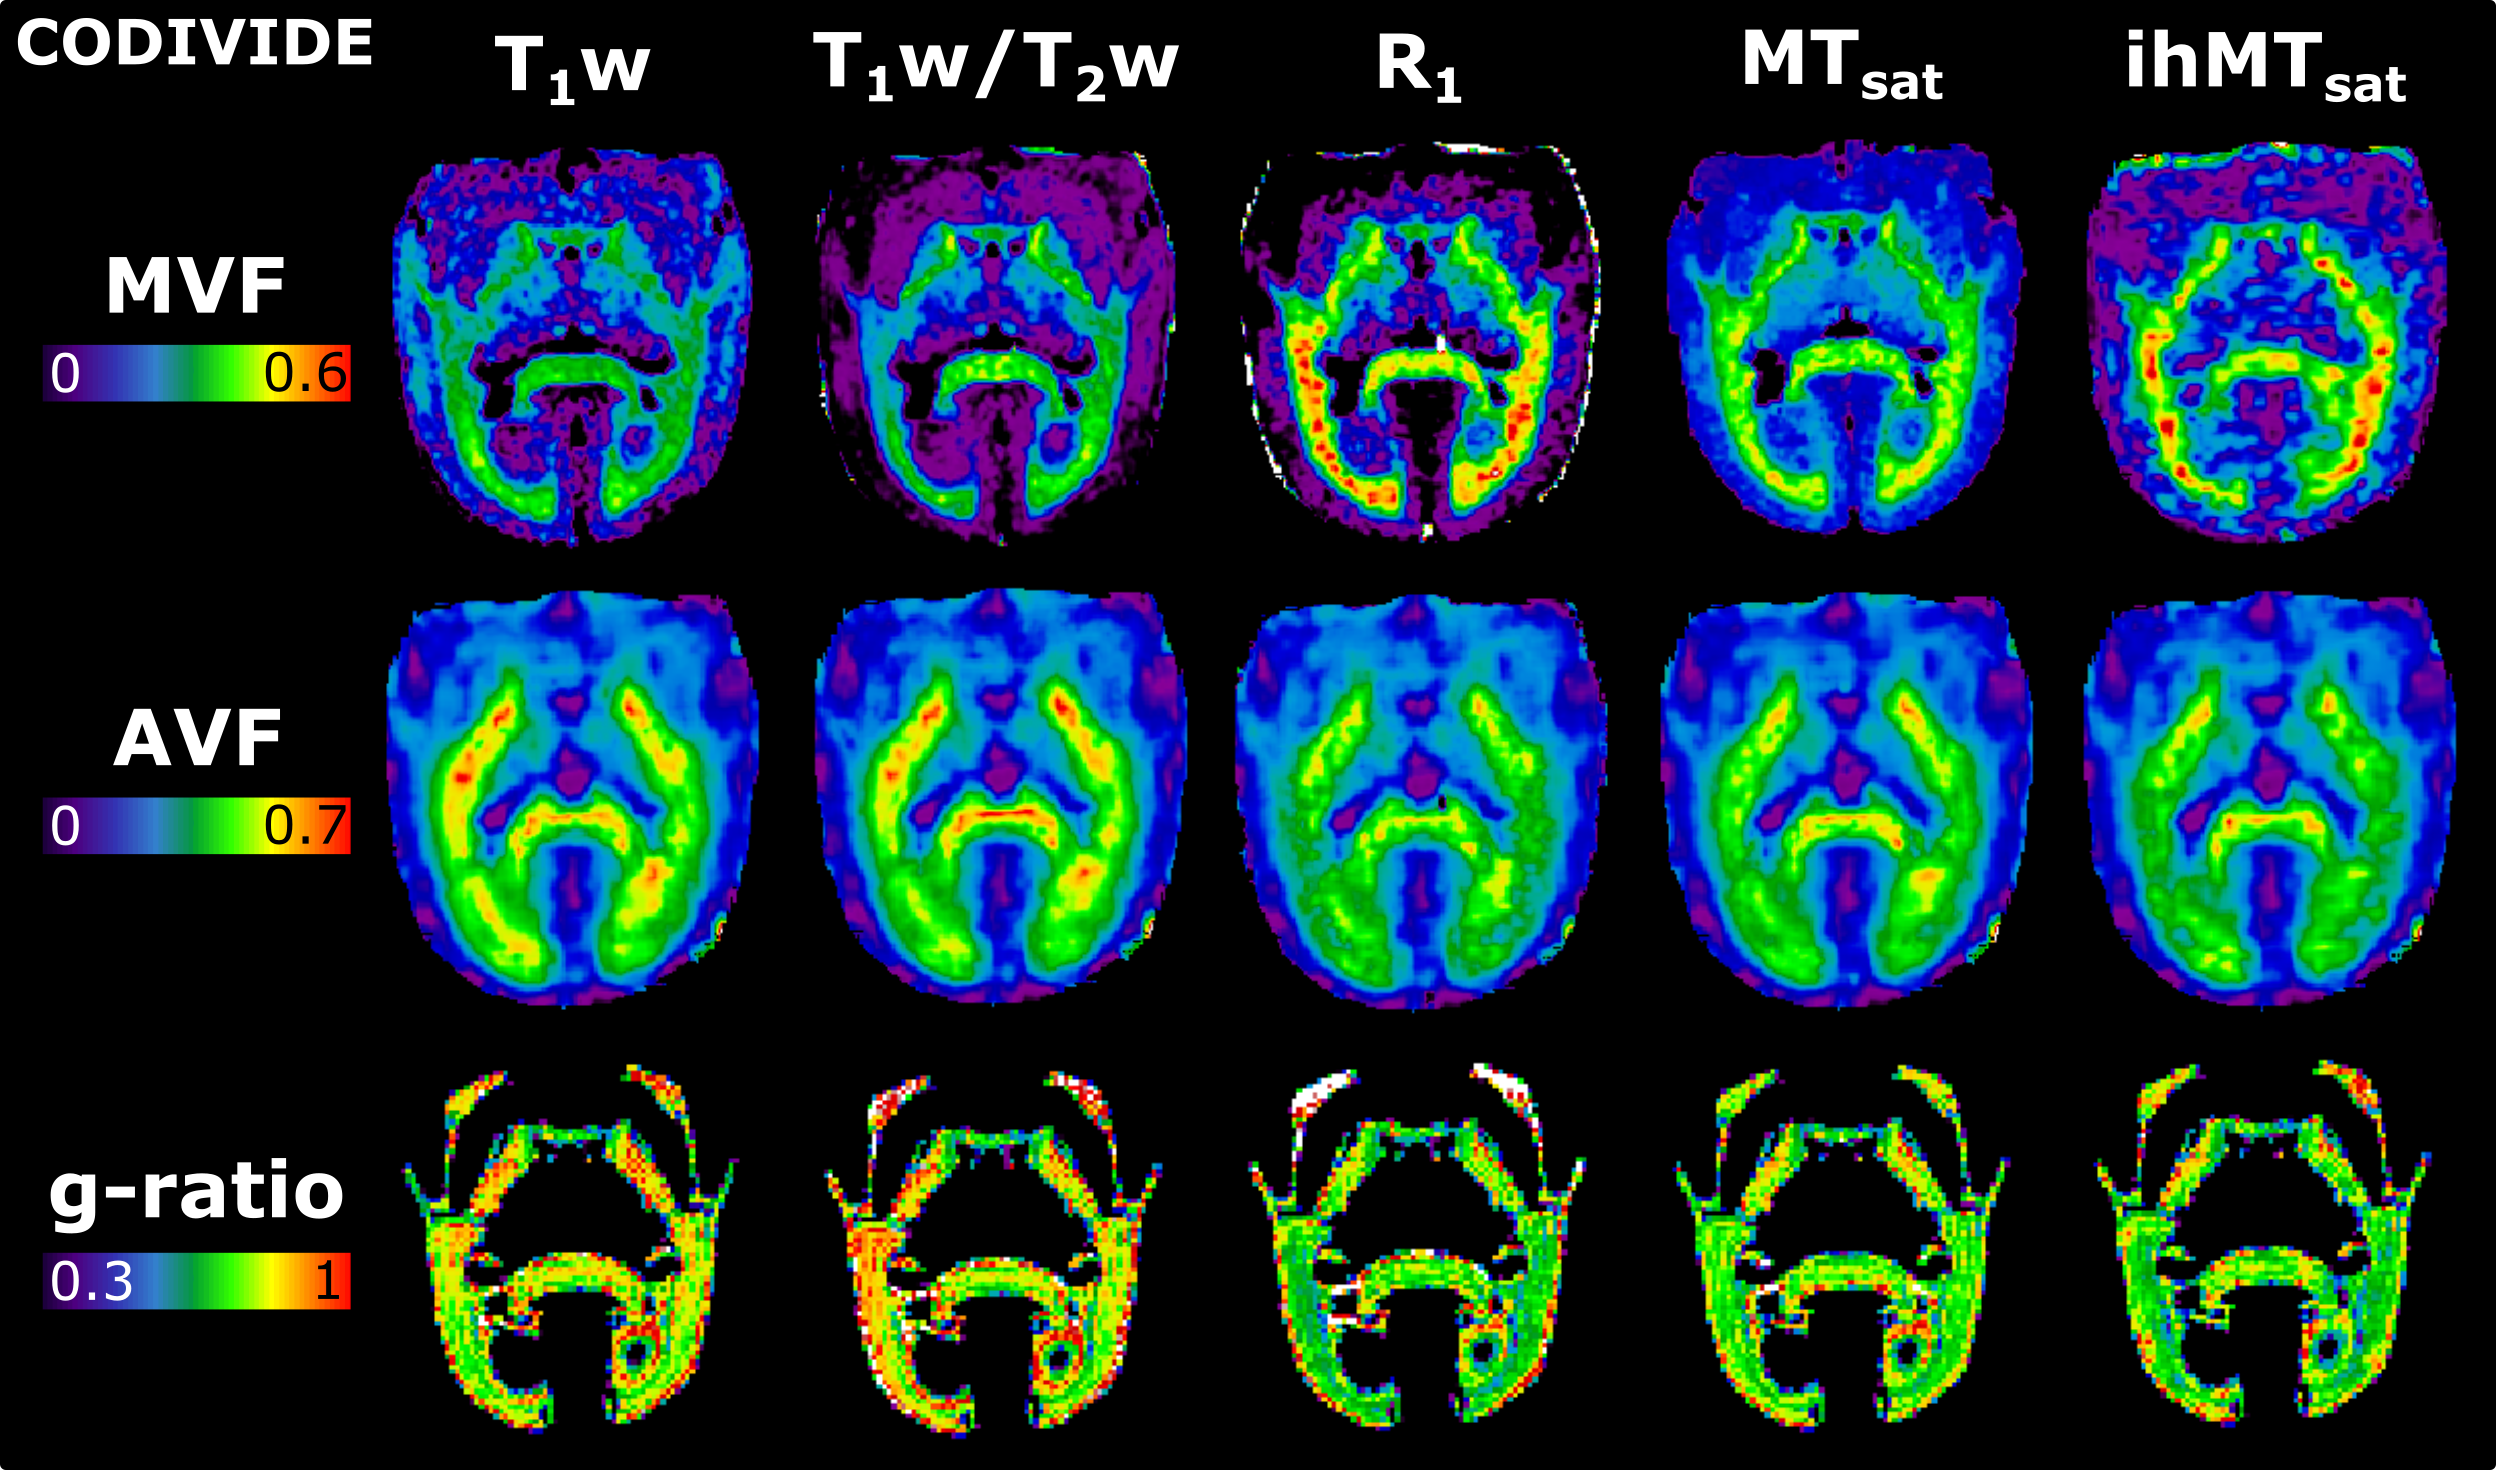
Figure 2 presents the images used in the g-ratio calculation. The fIC map presents higher values in the GM than the fTL map, a feature expected based on previous work14.Figures 3 and 4 display the same axial slice for the calculated MVF, AVF and g-ratio maps. The MVF maps present only a scaling difference between the NODDI and CODIVIDE methods. The calibration of MVF used here appears to not hold in the GM, as seen by the dark regions in the anterior parts of the R1 and T1w/T2w maps. This suggests a more complex calibration is required for the differing microstructure of the GM. A large difference is observed in the AVF maps, where the NODDI AVF presents high values in the GM (~0.6) whereas CODIVIDE AVF displays lower GM values (~0.2). This appears to be driven by the large difference between the fIC and fTL maps. At the visual level, the resulting WM g-ratio maps are similar.
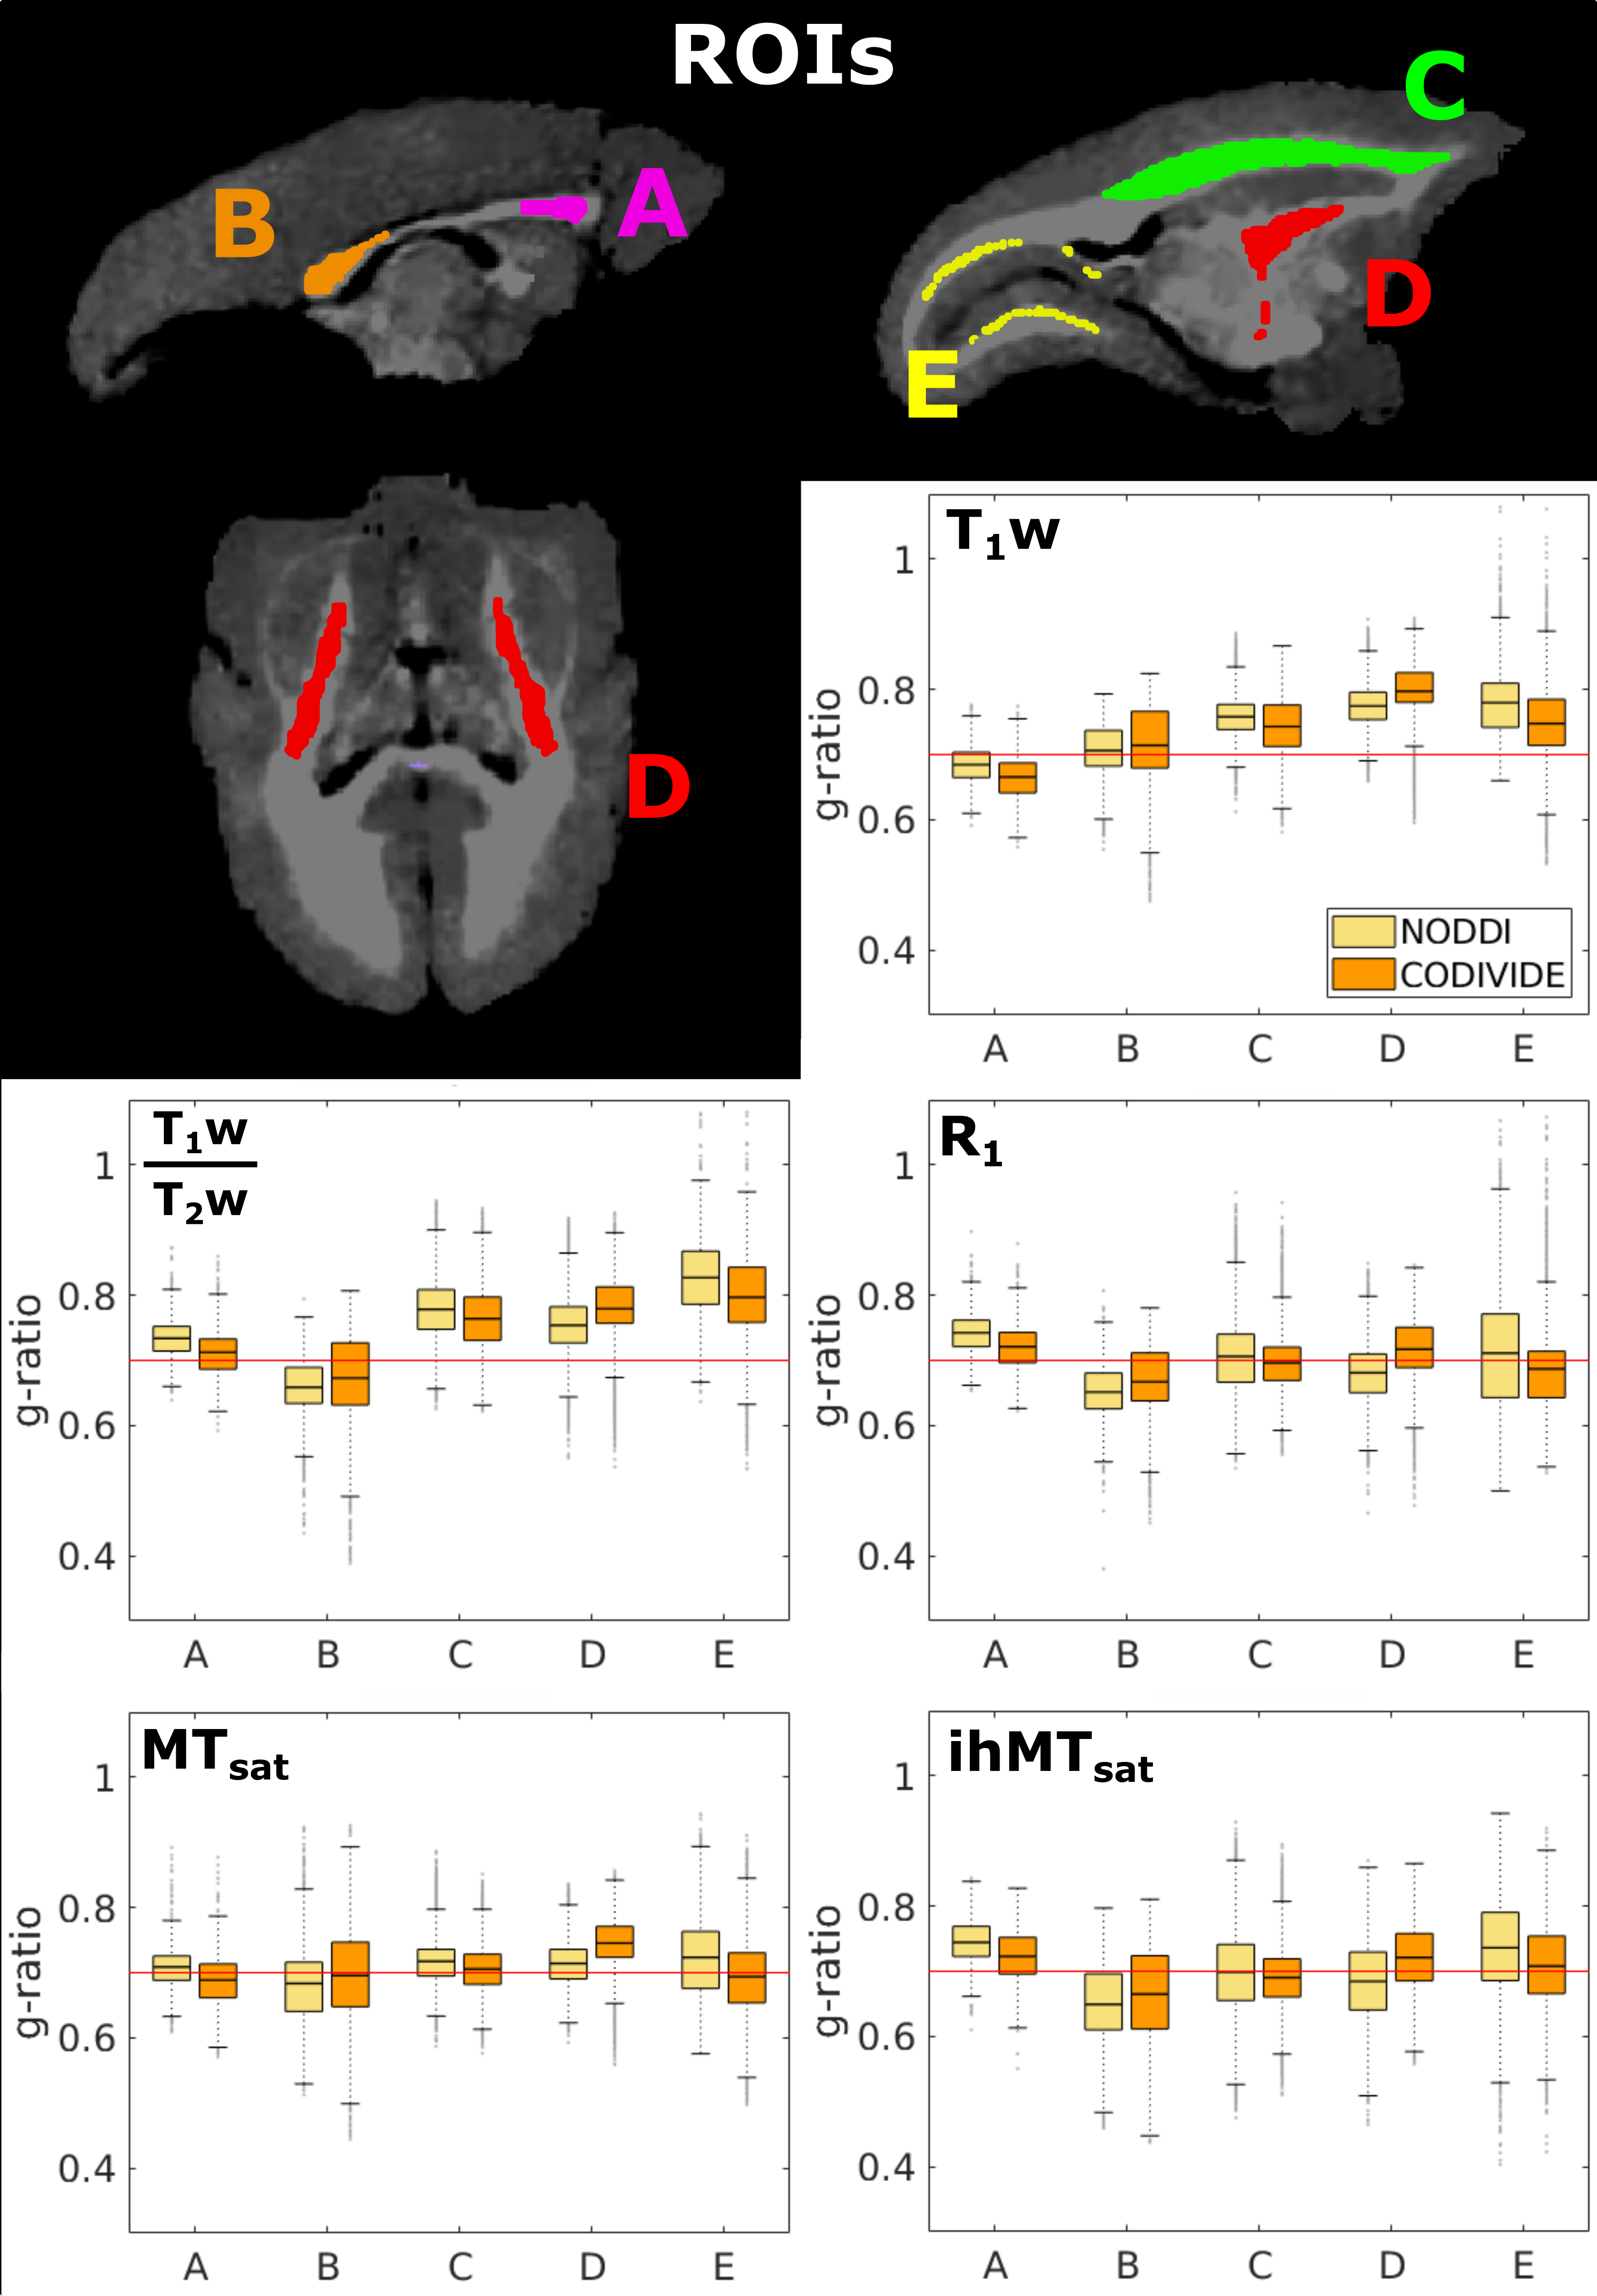
We investigate variations between WM ROIs in Figure 5. We found lower values in the genu than the splenium of the corpus callosum in both T1w and the CODIVIDE MTsat g-ratio maps, replicating previous findings1,2,12. In the internal capsule, which contains the corticospinal tract, T1w, T1w/T2w, and MTsat g-ratios presented increased g-ratios, replicating findings in humans4,28,29, with CODIVIDE results showing higher values in this ROI than NODDI across all metrics. ihMTsat and R1 g-ratios did not follow these expected trends. Histological validation of these features in a marmoset is necessary, as previous work in primates found that axonal diameter and packing, two features that could impact the g-ratio, are correlated with brain mass differently depending on the specific brain region30.
Conclusions
We demonstrate that MVF and AVF maps are dependent on the MRI metric and microstructural model used, suggesting that myelin-specific metrics and accurate microstructural models are required to produce maps appropriate for interpretation. Additionally, we show that a two-parameter calibration produces g-ratios estimated from different myelin-sensitive metrics that follow similar trends across the WM in a marmoset. Future work will look to validate the use of these metrics and models for g-ratio calculation with histology.Acknowledgements
We thank Takuya Hayashi for developing the marmoset coil, as well as Rogue Research (Stephen Frey) and Hybex (Brian Hynes) of development of a marmoset imaging chair. This project has been made possible by the Brain Canada Foundation, through the Canada Brain Research Fund, with the financial support of Health Canada and the Natural Sciences and Engineering Research Council of Canada, the Fonds de recherche du Québec – Santé, Healthy Brains for Healthy Lives, the Campus Alberta Innovates Program, and the Molson Foundation.References
1. Stikov, N. et al. Bound pool fractions complement diffusion measures to describe white matter micro and macrostructure. Neuroimage 54, 1112–1121 (2011).
2. Berman, S., West, K. L., Does, M. D., Yeatman, J. D. & Mezer, A. A. Evaluating g-ratio weighted changes in the corpus callosum as a function of age and sex. Neuroimage 182, 304–313 (2018).
3. West, K. L. et al. Myelin volume fraction imaging with MRI. Neuroimage 182, 511–521 (2018).
4. Mohammadi, S. et al. Whole-brain in-vivo measurements of the axonal G-ratio in a group of 37 healthy volunteers. Front. Neurosci. 9, 1–13 (2015).
5. Dean, D. C. et al. Mapping an index of the myelin g-ratio in infants using magnetic resonance imaging. Neuroimage 132, 225–237 (2016).
6. Hagiwara, A. et al. SyMRI of the Brain: Rapid Quantification of Relaxation Rates and Proton Density, with Synthetic MRI, Automatic Brain Segmentation, and Myelin Measurement. Invest. Radiol. 52, 647–657 (2017).
7. Melbourne, A. et al. Longitudinal development in the preterm thalamus and posterior white matter: MRI correlations between diffusion weighted imaging and T2 relaxometry. Hum. Brain Mapp. 37, 2479–2492 (2016).
8. Stikov, N. et al. In vivo histology of the myelin g-ratio with magnetic resonance imaging. Neuroimage 118, 397–405 (2015).
9. Duval, T. et al. g-Ratio weighted imaging of the human spinal cord in vivo. Neuroimage 145, 11–23 (2017).
10. Jung, W. et al. Whole brain g-ratio mapping using myelin water imaging (MWI) and neurite orientation dispersion and density imaging (NODDI). Neuroimage 182, 379–388 (2018).
11. Cercignani, M. et al. Characterizing axonal myelination within the healthy population: a tract-by-tract mapping of effects of age and gender on the fiber g-ratio. Neurobiol. Aging 49, 109–118 (2017).
12. Stikov, N. et al. In vivo histology of the myelin g-ratio with magnetic resonance imaging. Neuroimage 118, 397–405 (2015).
13. Varma, G., Duhamel, G., De Bazelaire, C. & Alsop, D. C. Magnetization transfer from inhomogeneously broadened lines: A potential marker for myelin. Magn. Reson. Med. 73, 614–622 (2015).
14. Lampinen, B. et al. Neurite density imaging versus imaging of microscopic anisotropy in diffusion MRI: A model comparison using spherical tensor encoding. Neuroimage 147, 517–531 (2017).
15. Hori, Y. et al. Translating the Human Connectome Project to Marmoset Imaging : 16-Channel Multi-Array Coil and HCP-Style MRI Protocols and Preprocessing. in Proceedings of the 27th Annual Meeting of ISMRM, Paris, France (2018).
16. Rowley, C. D. et al. Inhomogeneous magnetization transfer saturation (ihMT): efficient centric-encoded GRE implementation with B1 inhomogeneity correction. in Proceedings of the ISMRM & SMRT Virtual Conference & Exhibition 3136 (2020).
17. Szczepankiewicz, F., Sjölund, J., Ståhlberg, F., Lätt, J. & Nilsson, M. Tensor-valued diffusion encoding for diffusional variance decomposition (DIVIDE): Technical feasibility in clinical MRI systems. PLoS One 14, 1–20 (2019).
18. Szczepankiewicz, F., Westin, C. F. & Nilsson, M. Maxwell-compensated design of asymmetric gradient waveforms for tensor-valued diffusion encoding. Magn. Reson. Med. 82, 1424–1437 (2019).
19. Sjölund, J. et al. Constrained optimization of gradient waveforms for generalized diffusion encoding. J. Magn. Reson. 261, 157–168 (2015).
20. Avants, B. B., Epstein, C. L., Grossman, M. & Gee, J. C. Symmetric diffeomorphic image registration with cross-correlation: Evaluating automated labeling of elderly and neurodegenerative brain. Med. Image Anal. 12, 26–41 (2008).
21. Liu, C. et al. A resource for the detailed 3D mapping of white matter pathways in the marmoset brain. Nat. Neurosci. 23, 271–280 (2020).
22. Yushkevich, P. A., Gao, Y. & Gerig, G. ITK-SNAP: An interactive tool for semi-automatic segmentation of multi-modality biomedical images. Proc. Annu. Int. Conf. IEEE Eng. Med. Biol. Soc. EMBS 2016-Octob, 3342–3345 (2016).
23. Duhamel, G. et al. Validating the sensitivity of inhomogeneous magnetization transfer (ihMT) MRI to myelin with fluorescence microscopy. Neuroimage 199, 289–303 (2019).
24. Veraart, J. et al. Denoising of diffusion MRI using random matrix theory. Neuroimage 142, 394–406 (2016).
25. Kellner, E., Dhital, B., Kiselev, V. G. & Reisert, M. Gibbs-ringing artifact removal based on local subvoxel-shifts. Magn. Reson. Med. 76, 1574–1581 (2016).
26. Irfanoglu, M. O. et al. DR-BUDDI (Diffeomorphic Registration for Blip-Up blip-Down Diffusion Imaging) method for correcting echo planar imaging distortions. Neuroimage 106, 284–299 (2015).
27. Zhang, H., Schneider, T., Wheeler-Kingshott, C. A. & Alexander, D. C. NODDI: Practical in vivo neurite orientation dispersion and density imaging of the human brain. Neuroimage 61, 1000–1016 (2012).
28. Slater, D. A. et al. Evolution of white matter tract microstructure across the life span. Hum. Brain Mapp. 1–17 (2019). doi:10.1002/hbm.24522
29. Ellerbrock, I. & Mohammadi, S. Four in vivo g-ratio-weighted imaging methods: Comparability and repeatability at the group level. Hum. Brain Mapp. 39, 24–41 (2018).
30. Phillips, K. A. et al. The corpus callosum in primates: Processing speed of axons and the evolution of hemispheric asymmetry. Proc. R. Soc. B Biol. Sci. 282, (2015).
Figures