0295
Towards differentiation of white matter pathologies through B-tensor encoding.1Instituto de Neurobiología, Universidad Nacional Autónoma de México, Querétaro, Mexico, 2Radiology, New York University School of Medicine, New York, NY, United States, 3Centro de Investigación en Matemáticas, Guanajuato, Mexico
Synopsis
This work explores the ability of B-tensor encoding methods to disentangle axonal degeneration and inflammation through DW-MRI. In particular, we tested Q-space trajectory encoding and diffusion tensor distribution imaging. Both methods clearly differentiated between damaged and intact nerves, and showed moderately different diffusion characteristics between the two experimental conditions.
Introduction
Diffusion-weighted MRI (DW-MRI) has been used extensively to detect white matter abnormalities1 . While the technique has shown high sensitivity, standard analytical approaches lack specificity to neuropathological cellular events. Inflammation, axonal degeneration, and demyelination are observed in most neurological pathologies. Their non-invasive differentiation through DW-MRI would be of considerable clinical utility2.Diffusion gradient waveforms with complex shapes measure q-space trajectories, rather than a single point in q-space3. Different measurements using different B-tensors (denoted by size, shape, and orientation) enable DW-MRI to estimate microstructural details that are otherwise inaccessible to the classic PGSE acquisitions. Diffusion Tensor Distribution3 models the distribution of microenvironment diffusion tensors within each voxel. As opposed to previous DW-MRI techniques based on pulsed gradient pairs, DTD can better describe neural tissue containing cells with different sizes, shapes, and orientations. Q-space Trajectory Encoding4 (QTE) derives metrics that describe the general behavior of the DTD. Alternatively, DTD imaging5 provides access to the full distribution. We explore the ability of these B-tensor encoding methods to differentiate between axonal degeneration and inflammation of the optic nerve. These neuropathological events show unique cellular and tissue characteristics that should be accompanied by specific diffusion signatures accessible through DTD.Methods
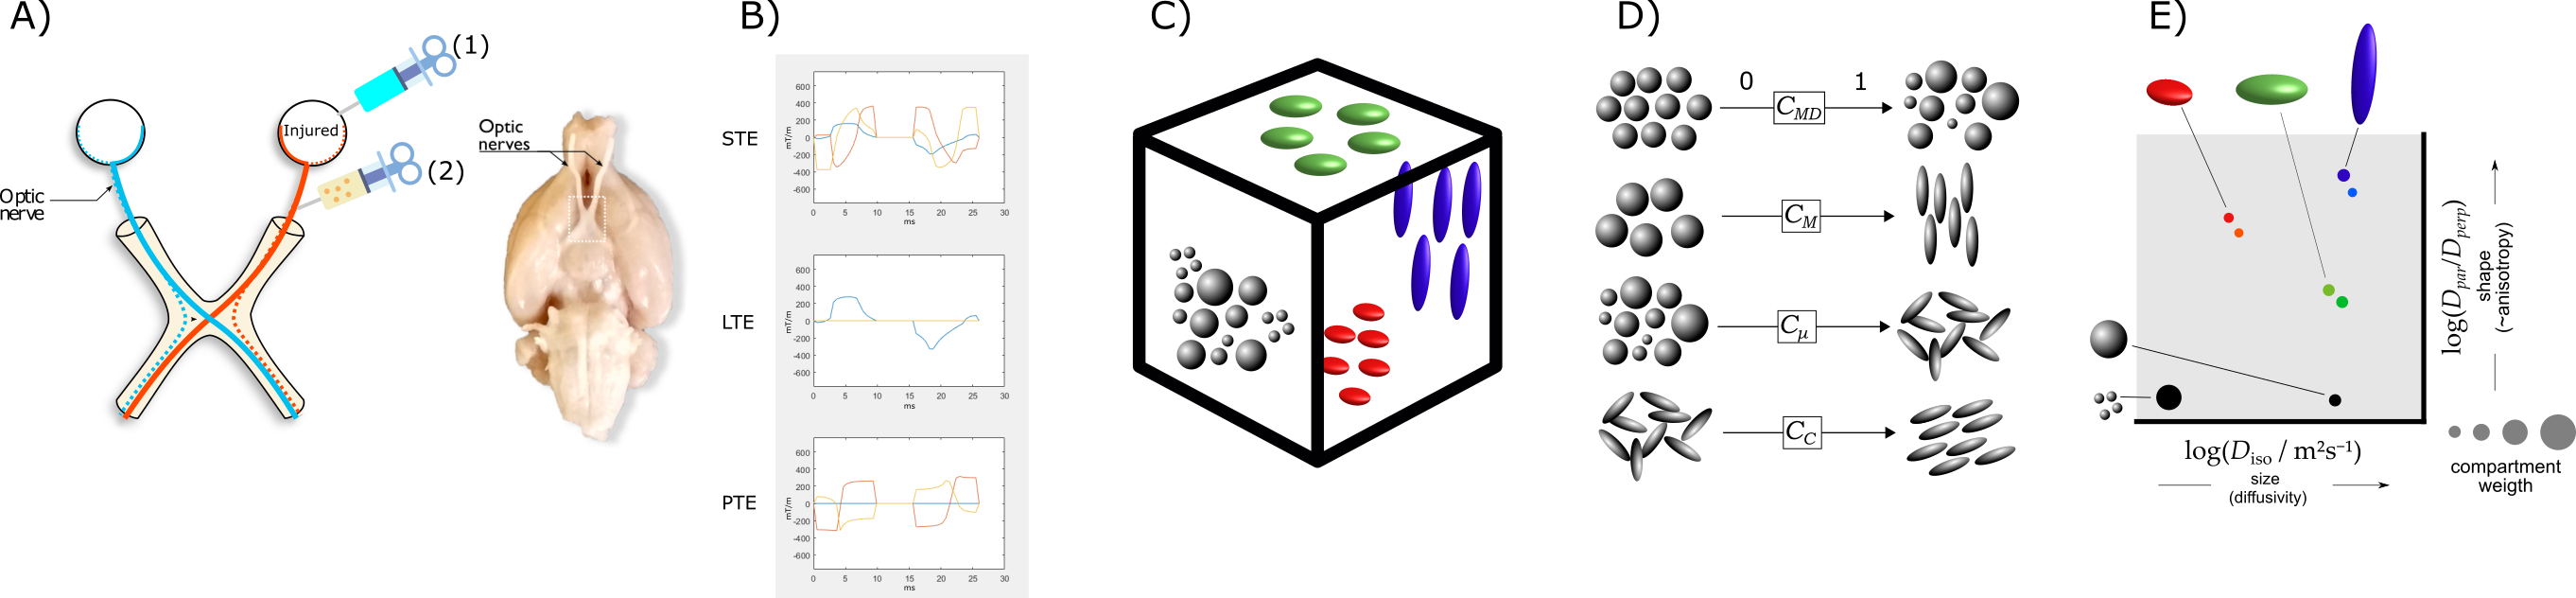
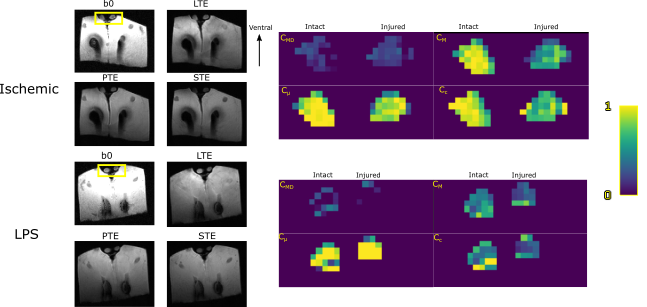
We used two models of white matter pathology induced in adult Wistar rats. For each animal, the right optic nerve was affected, while the left remained intact. Experimental procedures were carried out on anesthetized animals (Figure 1A). Axonal degeneration (3 rats) was induced through unilateral retinal ischemia6. Inflammation (2 rats) was elicited through injection of 1μl of lipopolysaccharide (LPS, 4.5 μg/μl) in the optic nerve7. After experimental procedures, rats were kept alive for ten days, then transcardially perfused with PFA and glutaraldehyde; their optic nerves and basal portion of the brain were isolated and transferred to PFA until scanning. Specimens were immersed in Fluorinert and scanned at room temperature 23±8 days after euthanasia using a 7 T Bruker Pharmascan with 760 mT/m gradients and a Cryoprobe. DW-MRI images were acquired according to the Preclinical Neuro MRI sequence (https://osf.io/ngu4a), based on a 2D spin-echo sequence (80x80x1000 μm³ voxels, TR/TE=1500/30.9 ms, NEX=2). Acquisition time was 16 h. B-tensor encoding images were obtained based on Szczepankiewicz et al.,8 consisting of 3 waveforms to obtain linear, planar, and spherical tensor encodings (Figure 1B). Waveforms were optimized and Maxwell-compensated9 using NOW toolbox10 (https://github.com/jsjol/NOW). Waveforms have the same duration (δ1=9.8, δ2=10.4, separation time=5.72 ms) and were scaled in magnitude to achieve 4 different b-values (200, 1400, 2800 and 4000 s/mm²).Images were denoised11. ROIs for injured and control nerves were manually drawn in 3-4 slices. Unitless, normalized ([0,1]) QTE metrics were obtained using md-dMRI toolbox (https://github.com/markus-nilsson/md-dmri), and included: Size Variance (CMD), Macroscopic anisotropy (CM), Microscopic anisotropy (Cμ), and Orientation coherence (CC) (Figure 1D). We excluded poorly-fitted voxels where metrics resulted in values outside their theoretical range. The DTD can be approximated through DTD imaging5 using the same toolbox via Monte-Carlo (MC) inversion of the Laplacian transform5 (Figure 1C,E); we used parameters Dmin = 1e-11, Dmax=3e-9, nin=400, nout=20.Results and Discussion
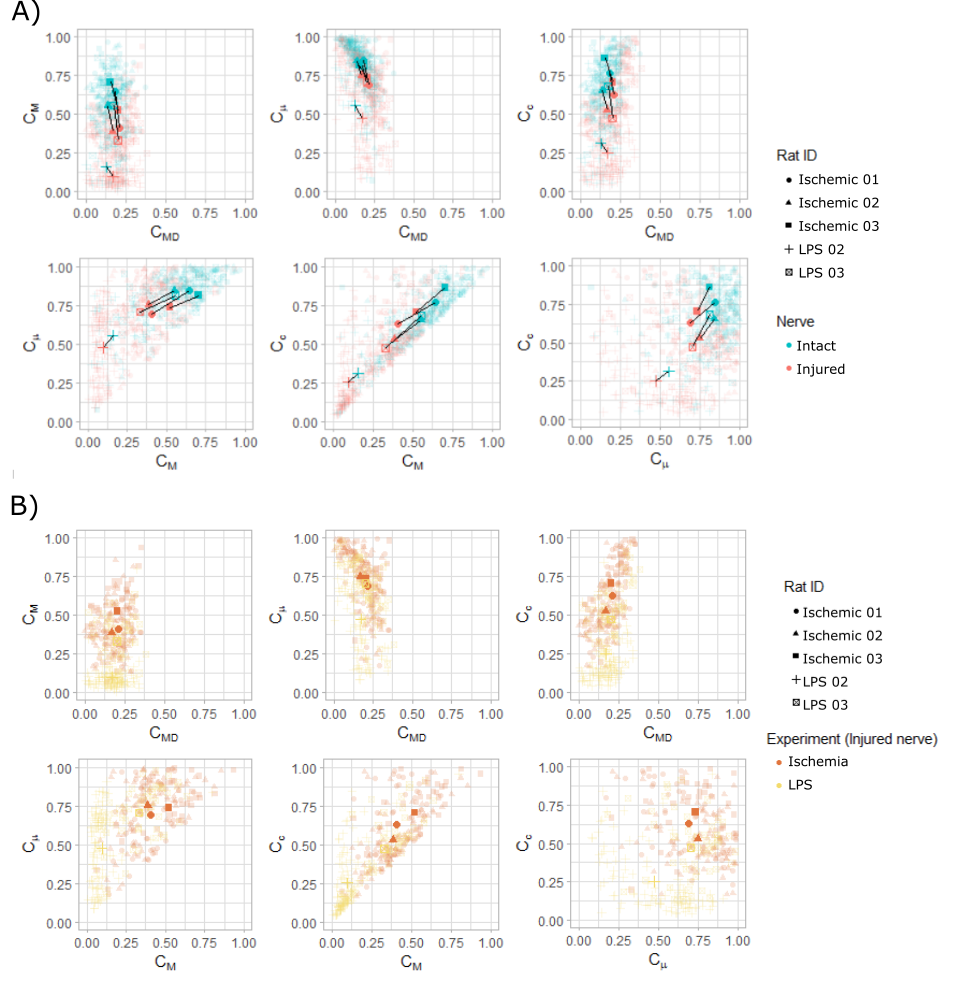
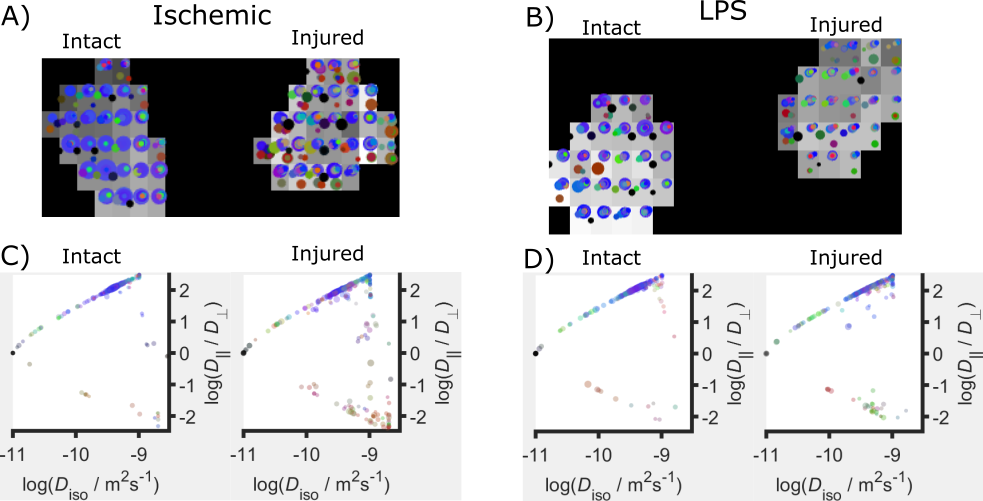
Figure 2 shows asymmetry of QTE metrics between intact and injured nerves. Such asymmetry is also evident in voxel-wise scatterplots in Figure 3A. The two experimental conditions are not entirely different in terms of QTE metrics, yet nerves with inflammation show lower values of CC and CM than nerves with axonal degeneration (Figure 3B). Size variance (CMD) is low and similar in intact and injured nerves. Both pathologies share reduced CM, as compared to intact nerves, with LPS-injected nerves showing more severe reductions. CM results are congruent with previous reports of reduced FA values in axonal degeneration12. In addition to CM, the two experimental conditions showed differences in CC, which was also further reduced in LPS-injected nerves than those with axonal degeneration. Contrary to our expectations, Cμ was similar in the two experimental conditions. DTD imaging shows the potential to differentiate between these two pathologies. In Figure 4A,B intact nerves (left) show high directionality in the main direction of the bundle (blue color), with most points representing a stick-shape in the DTD (upper level). In injured nerves (right) there is greater heterogeneity of orientations and shapes. This can be explained by the expected axonal loss and neurodegeneration. Figure 4C,D summarizes the voxel-wise diffusion tensor distributions across the slices. DTD of injured nerves loses directionality and has more variance in the distribution in the shape axis. Further work is required to confirm these tendencies.Conclusions
We explored the ability of two B-tensor encoding methods, QTE and DTD, to differentiate two pathologic histological conditions. Both methods are sensitive to microstructural changes induced by neuropathology, and are potentially capable of providing diffusion signatures specific to each condition, yet more data is needed to arrive at definitive conclusions.Acknowledgements
Imaging was performed at the National Laboratory for Magnetic Resonance Imaging (Conacyt, UNAM, CIMAT, UAQ). We thank Juan Ortiz-Retana, Gema Martínez Cabrera and Mirelta Regalado for technical assistance. Funding by CONACYT (FC 1782) and UNAM-DGAPA (IG200117, IN204720).References
[1] Concha, L., 2014. A macroscopic view of microstructure: Using diffusion-weighted images to infer damage, repair, and plasticity of white matter. Neuroscience 276, 14–28. https://doi.org/10.1016/j.neuroscience.2013.09.004
[2] Drake-Pérez, M., Boto, J., Fitsiori, A., Lovblad, K., Vargas, M.I., 2018. Clinical applications of diffusion weighted imaging in neuroradiology. Insights Imaging 9, 535–547. https://doi.org/10.1007/s13244-018-0624-3
[3] Topgaard, D., 2017. Multidimensional diffusion MRI. Journal of Magnetic Resonance 275, 98–113. https://doi.org/10.1016/j.jmr.2016.12.007
[4] Westin, C.-F., Knutsson, H., Pasternak, O., Szczepankiewicz, F., Özarslan, E., van Westen, D., Mattisson, C., Bogren, M., O’Donnell, L.J., Kubicki, M., Topgaard, D., Nilsson, M., 2016. Q-space trajectory imaging for multidimensional diffusion MRI of the human brain. NeuroImage 135, 345–362. https://doi.org/10.1016/j.neuroimage.2016.02.039
[5] Topgaard, D., 2019. Diffusion tensor distribution imaging. NMR in Biomedicine 32, e4066. https://doi.org/10.1002/nbm.4066
[6] Adachi, M., Takahashi, K., Nishikawa, M., Miki, H., Uyama, M., 1996. High intraocular pressure-induced ischemia and reperfusion injury in the optic nerve and retina in rats. Graefe’s Arch Clin Exp Ophthalmol 234, 445–451. https://doi.org/10.1007/bf02539411
[7] Aranda, M.L., Dorfman, D., Sande, P.H., Rosenstein, R.E., 2015. Experimental optic neuritis induced by the microinjection of lipopolysaccharide into the optic nerve. Experimental Neurology 266, 30–41. https://doi.org/10.1016/j.expneurol.2015.01.010
[8] Szczepankiewicz, F., Hoge, S., Westin, C.-F., 2019a. Linear, planar and spherical tensor-valued diffusion MRI data by free waveform encoding in healthy brain, water, oil and liquid crystals. Data in Brief 25, 104208. https://doi.org/10.1016/j.dib.2019.104208
[9] Szczepankiewicz, F., Westin, C., Nilsson, M., 2019b. Maxwell‐compensated design of asymmetric gradient waveforms for tensor‐valued diffusion encoding. Magn Reson Med 82, 1424–1437. https://doi.org/10.1002/mrm.27828Topgaard, D., 2019. Diffusion tensor distribution imaging. NMR in Biomedicine 32, e4066. https://doi.org/10.1002/nbm.4066
[10] Sjölund, J., Szczepankiewicz, F., Nilsson, M., Topgaard, D., Westin, C.-F., Knutsson, H., 2015. Constrained optimization of gradient waveforms for generalized diffusion encoding. Journal of Magnetic Resonance 261, 157–168. https://doi.org/10.1016/j.jmr.2015.10.012
[11] Veraart, J., Novikov, D.S., Christiaens, D., Ades-aron, B., Sijbers, J., Fieremans, E., 2016. Denoising of diffusion MRI using random matrix theory. NeuroImage 142, 394–406. https://doi.org/10.1016/j.neuroimage.2016.08.016
[12] Rojas-Vite, G., Coronado-Leija, R., Narvaez-Delgado, O., Ramírez-Manzanares, A., Marroquín, J.L., Noguez-Imm, R., Aranda, M.L., Scherrer, B., Larriva-Sahd, J., Concha, L., 2019. Histological validation of per-bundle water diffusion metrics within a region of fiber crossing following axonal degeneration. NeuroImage 201, 116013. https://doi.org/10.1016/j.neuroimage.2019.116013
Figures