0294
Exploring the epileptic rat hippocampus using oscillating gradients, 3D electron microscopy and Monte Carlo simulations1Department of Radiology and Radiological Science, Johns Hopkins University School of Medicine, Baltimore, MD, United States, 2A.I. Virtanen Institute of Molecular Sciences, University of Eastern Finland, Kuopio, Finland, 3Institute of Biotechnology, University of Helsinki, Helsinki, Finland
Synopsis
Oscillating gradient spin-echo (OGSE) diffusion MRI (dMRI) is sensitive to small-scale restrictions and may provide a sensitive probe of gray matter microstructural changes in brain disorders such as temporal lobe epilepsy. However, relating the OGSE spectral changes to specific microstructural features is a difficult challenge. Here, we combined OGSE-dMRI with serial block-face electron microscopy volumes of healthy and status epilepticus exhibiting rat hippocampi. From tissue parameters extracted from these volumes, we generated 3D digital substrates for Monte-Carlo random-walk simulations, which allowed us to elucidate the relative contributions of underlying gray matter microstructural features to the OGSE measurements.
Introduction
Oscillating gradient spin-echo (OGSE) diffusion MRI (dMRI) probes the frequency-dependence of the apparent diffusion coefficient (ADC), based on selectivity to varying restriction length scales1,2. Varying the OGSE frequency may provide a sensitive probe of gray matter microstructural changes in brain disorders such as temporal lobe epilepsy (TLE). However, linking the frequency-dependent ADC changes to specific microstructural features remains challenging3,4, with efforts in this direction requiring simultaneous 3D microscopy, dMRI, and detailed microstructural modeling or simulations5,6. Simulations in particular may uncover links overlooked by more simplified analytical models. Here, we combined OGSE-dMRI with serial block-face electron microscopy (SBEM)7, which generates high-resolution volumes allowing delineation of nanoscale features such as cell or nuclear membranes. By extracting tissue parameters from SBEM volumes of healthy and status epilepticus (SE) exhibiting rat hippocampi, we generated 3D digital substrates for Monte-Carlo (MC) random-walk simulations, which allowed us to elucidate the relative contributions of underlying gray matter microstructural features to the ADC frequency-dependence.Methods
We used pulsed-gradient spin echo (PGSE, 12 ms pulse separation, labeled 0 Hz) and OGSE (60 to 180 Hz) ADC images of rat hippocampi (5 controls, 5 pilocarpine-treated and exhibiting SE) acquired using 3D-GRASE readout8 at 120-µm isotropic resolution. SBEM volumes were acquired from the granule cell layer (GCL) in the dentate gyrus and the CA1 pyramidal layer (PyCA1). 3D digital substrates were generated with cells as randomly-packed semi-permeable spheroids containing internal nuclei with semi-permeable nuclear envelopes, with size and shape distributions determined by the SBEM data. Random-walk MC simulations were performed using in-house developed software in C++, that calculated the spin-phases accrued with the applied diffusion gradients (5.2x10⁵ walkers, 1-µs time-step). Simulations were performed for the same PGSE and OGSE gradient waveforms and frequencies used in the dMRI experiments, and substrate parameters systematically varied to investigate the effects of microstructural features.Results and Discussion
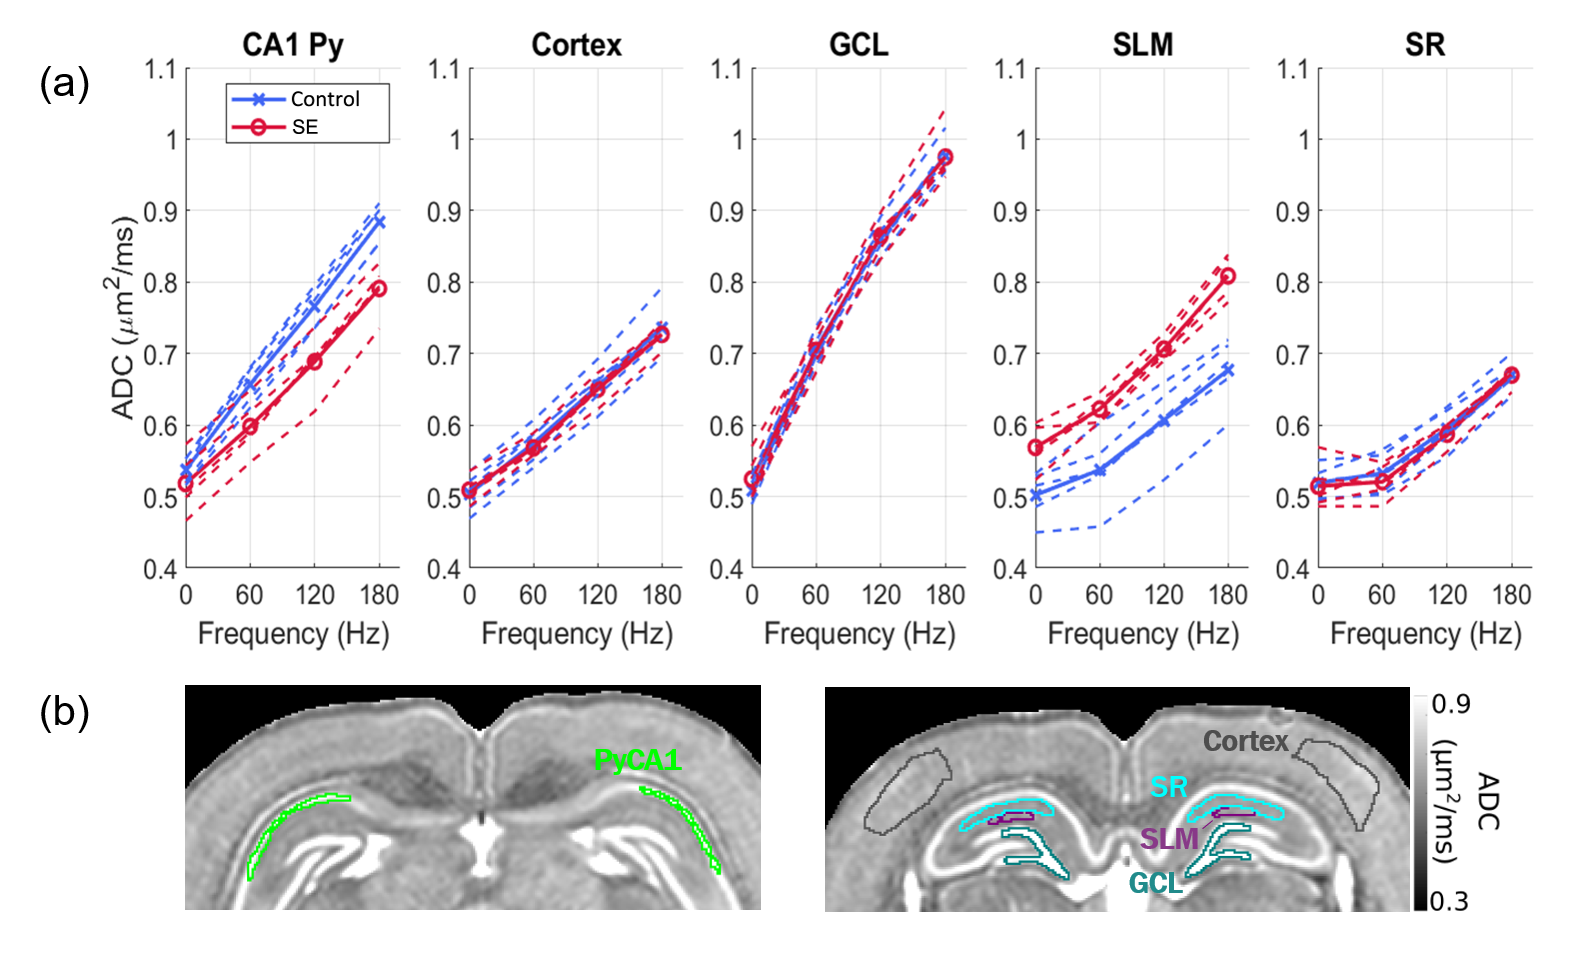
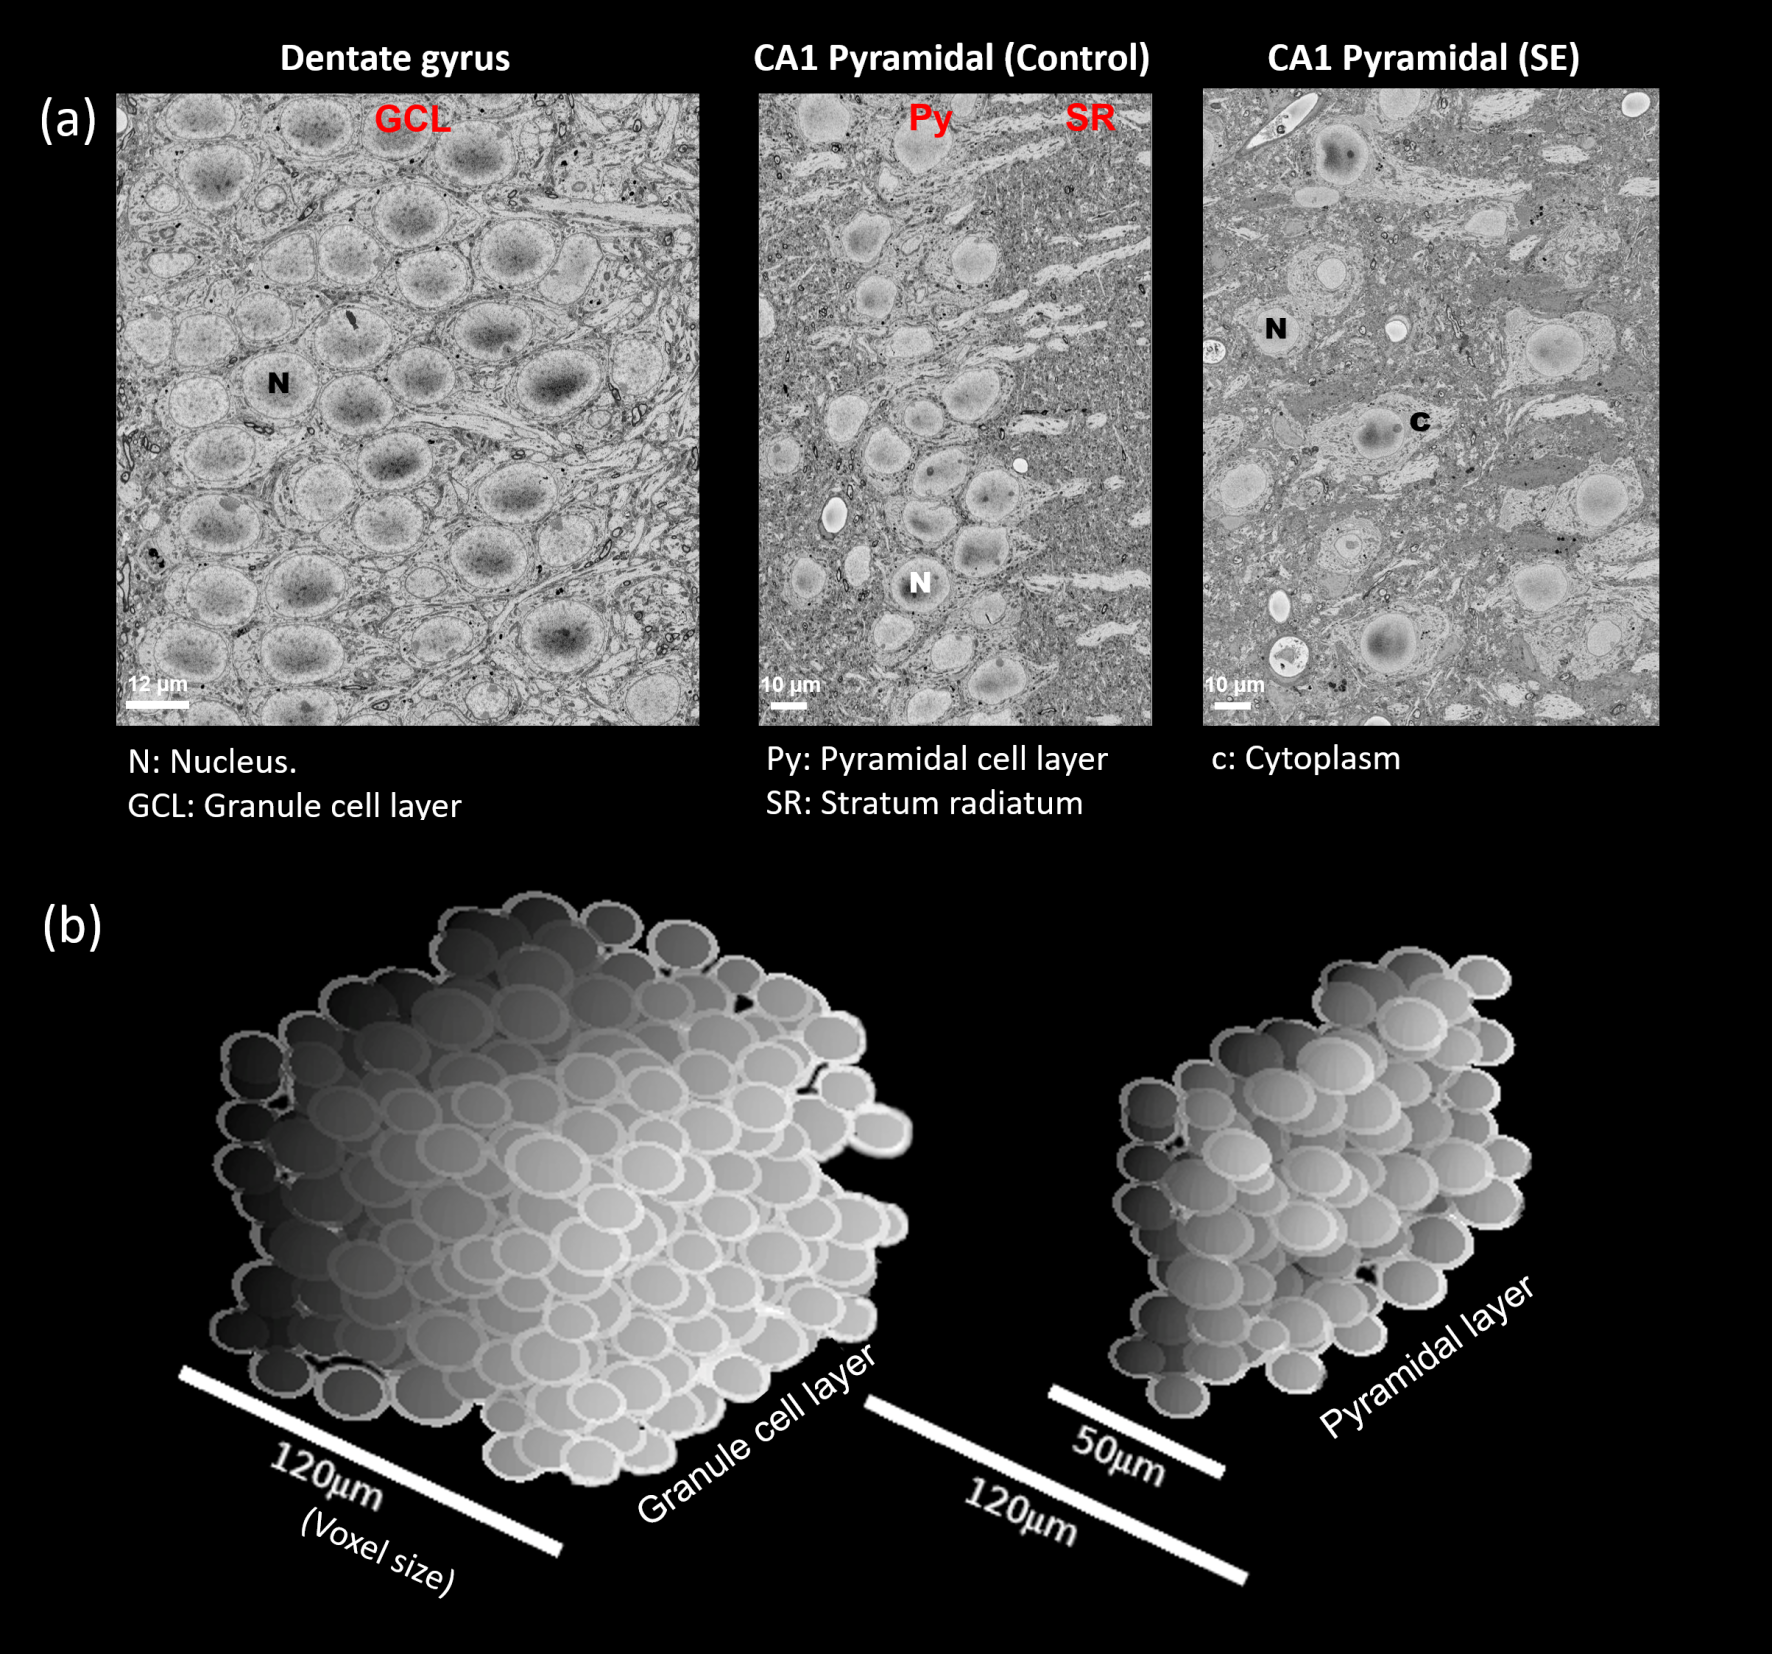
Fig. 1 shows the frequency-dependent ADC curves for different gray matter regions of interest (ROIs) in the hippocampus. At the PGSE data-point, ADC values are remarkably similar across ROIs (Fig. 1a). However, at increasing frequencies, the curves diverge to reveal characteristic variations across the ROIs, with the principal cellular layers of the hippocampus (GCL and Py) showing the highest frequency-dependent increases. The layers however differ in their response to SE, the GCL being unaffected while the OGSE-ADC in the PyCA1 is reduced.Fig. 2a shows SBEM images from these two ROIs in control and SE rats. The cells display large nuclear volume fractions (NVFs), with the GCL consisting of small somas and the control PyCA1 of a thinner layer of larger somas. The SE PyCA1 shows widespread neuronal degeneration and thus decreased neuronal density, as well as cell swelling predominantly in the cytoplasm.
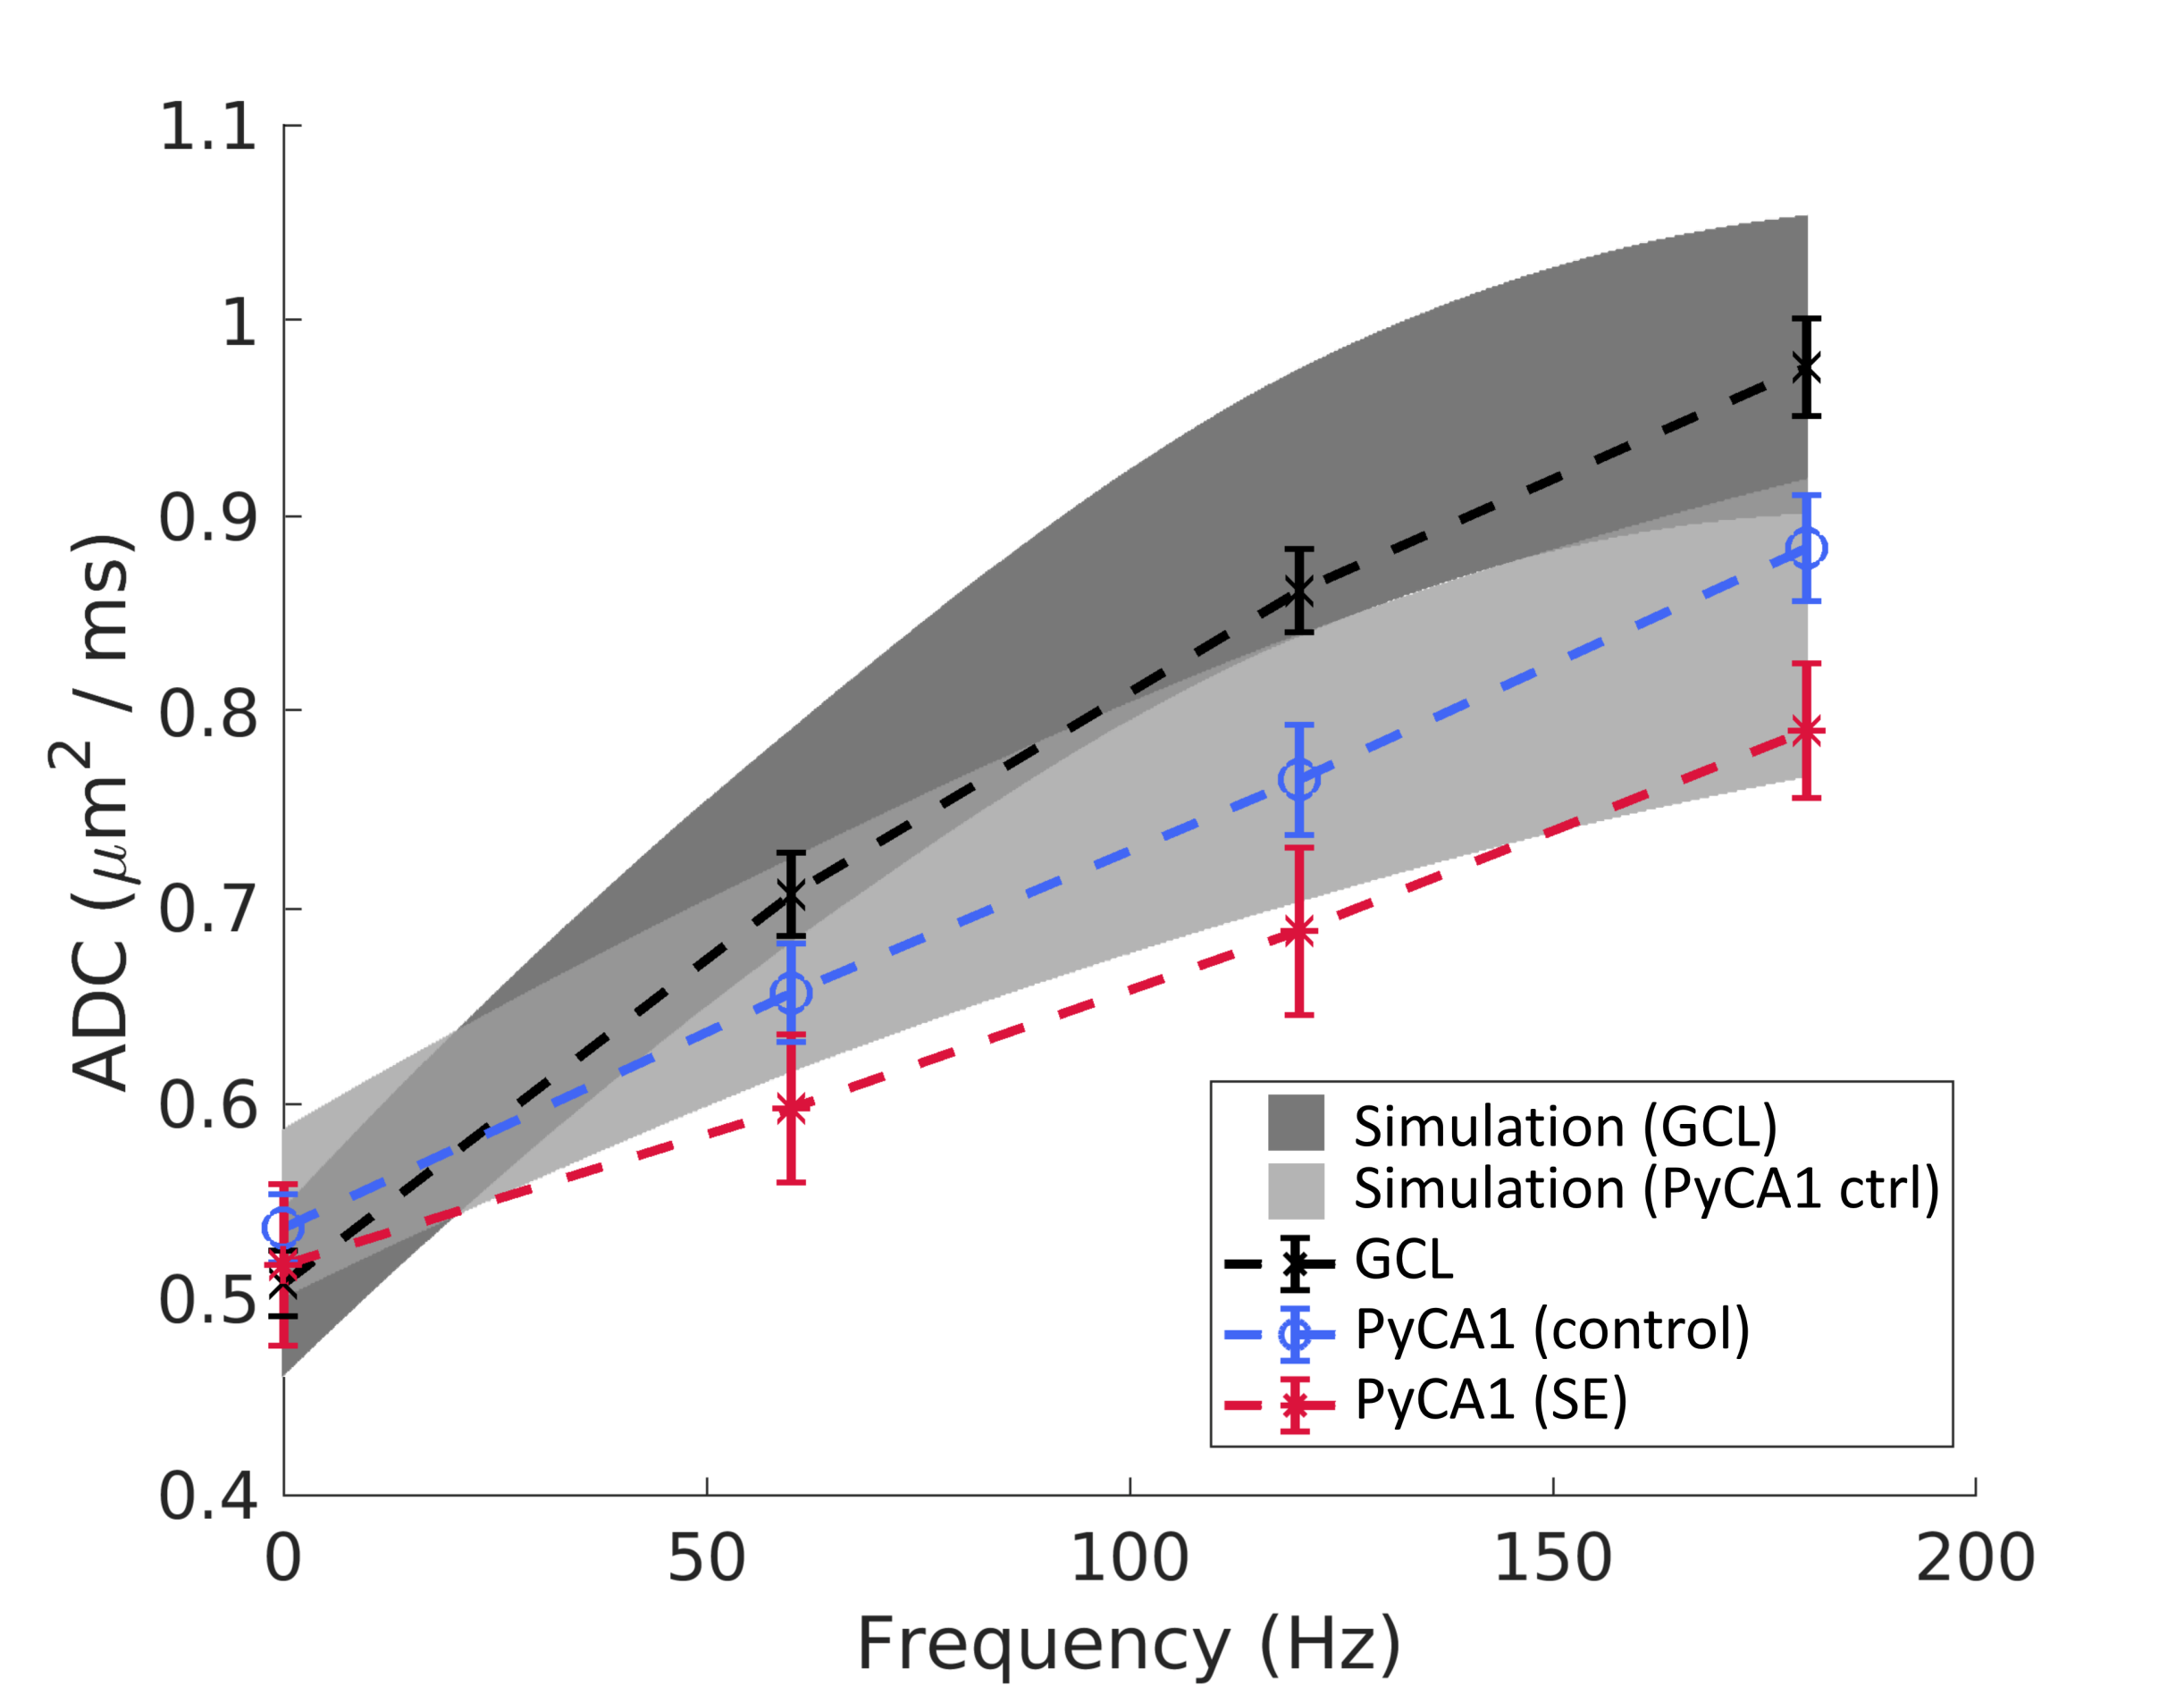
Fig. 2b displays 3D digital substrates generated from the SBEM-derived parameters for the control animals. The substrates are densely-packed with large nuclei partitioning the cells into smaller exchanging sub-compartments, and thereby contain a distribution of small-scale restrictions. The simulated ADCs in the substrates exhibited frequency-dependent effects of these restrictions, and are shown along with the experimental ADC curves in Fig. 3 as surfaces of parameter uncertainty. The simulations cover the data well, notably in the difference between the GCL and PyCA1.
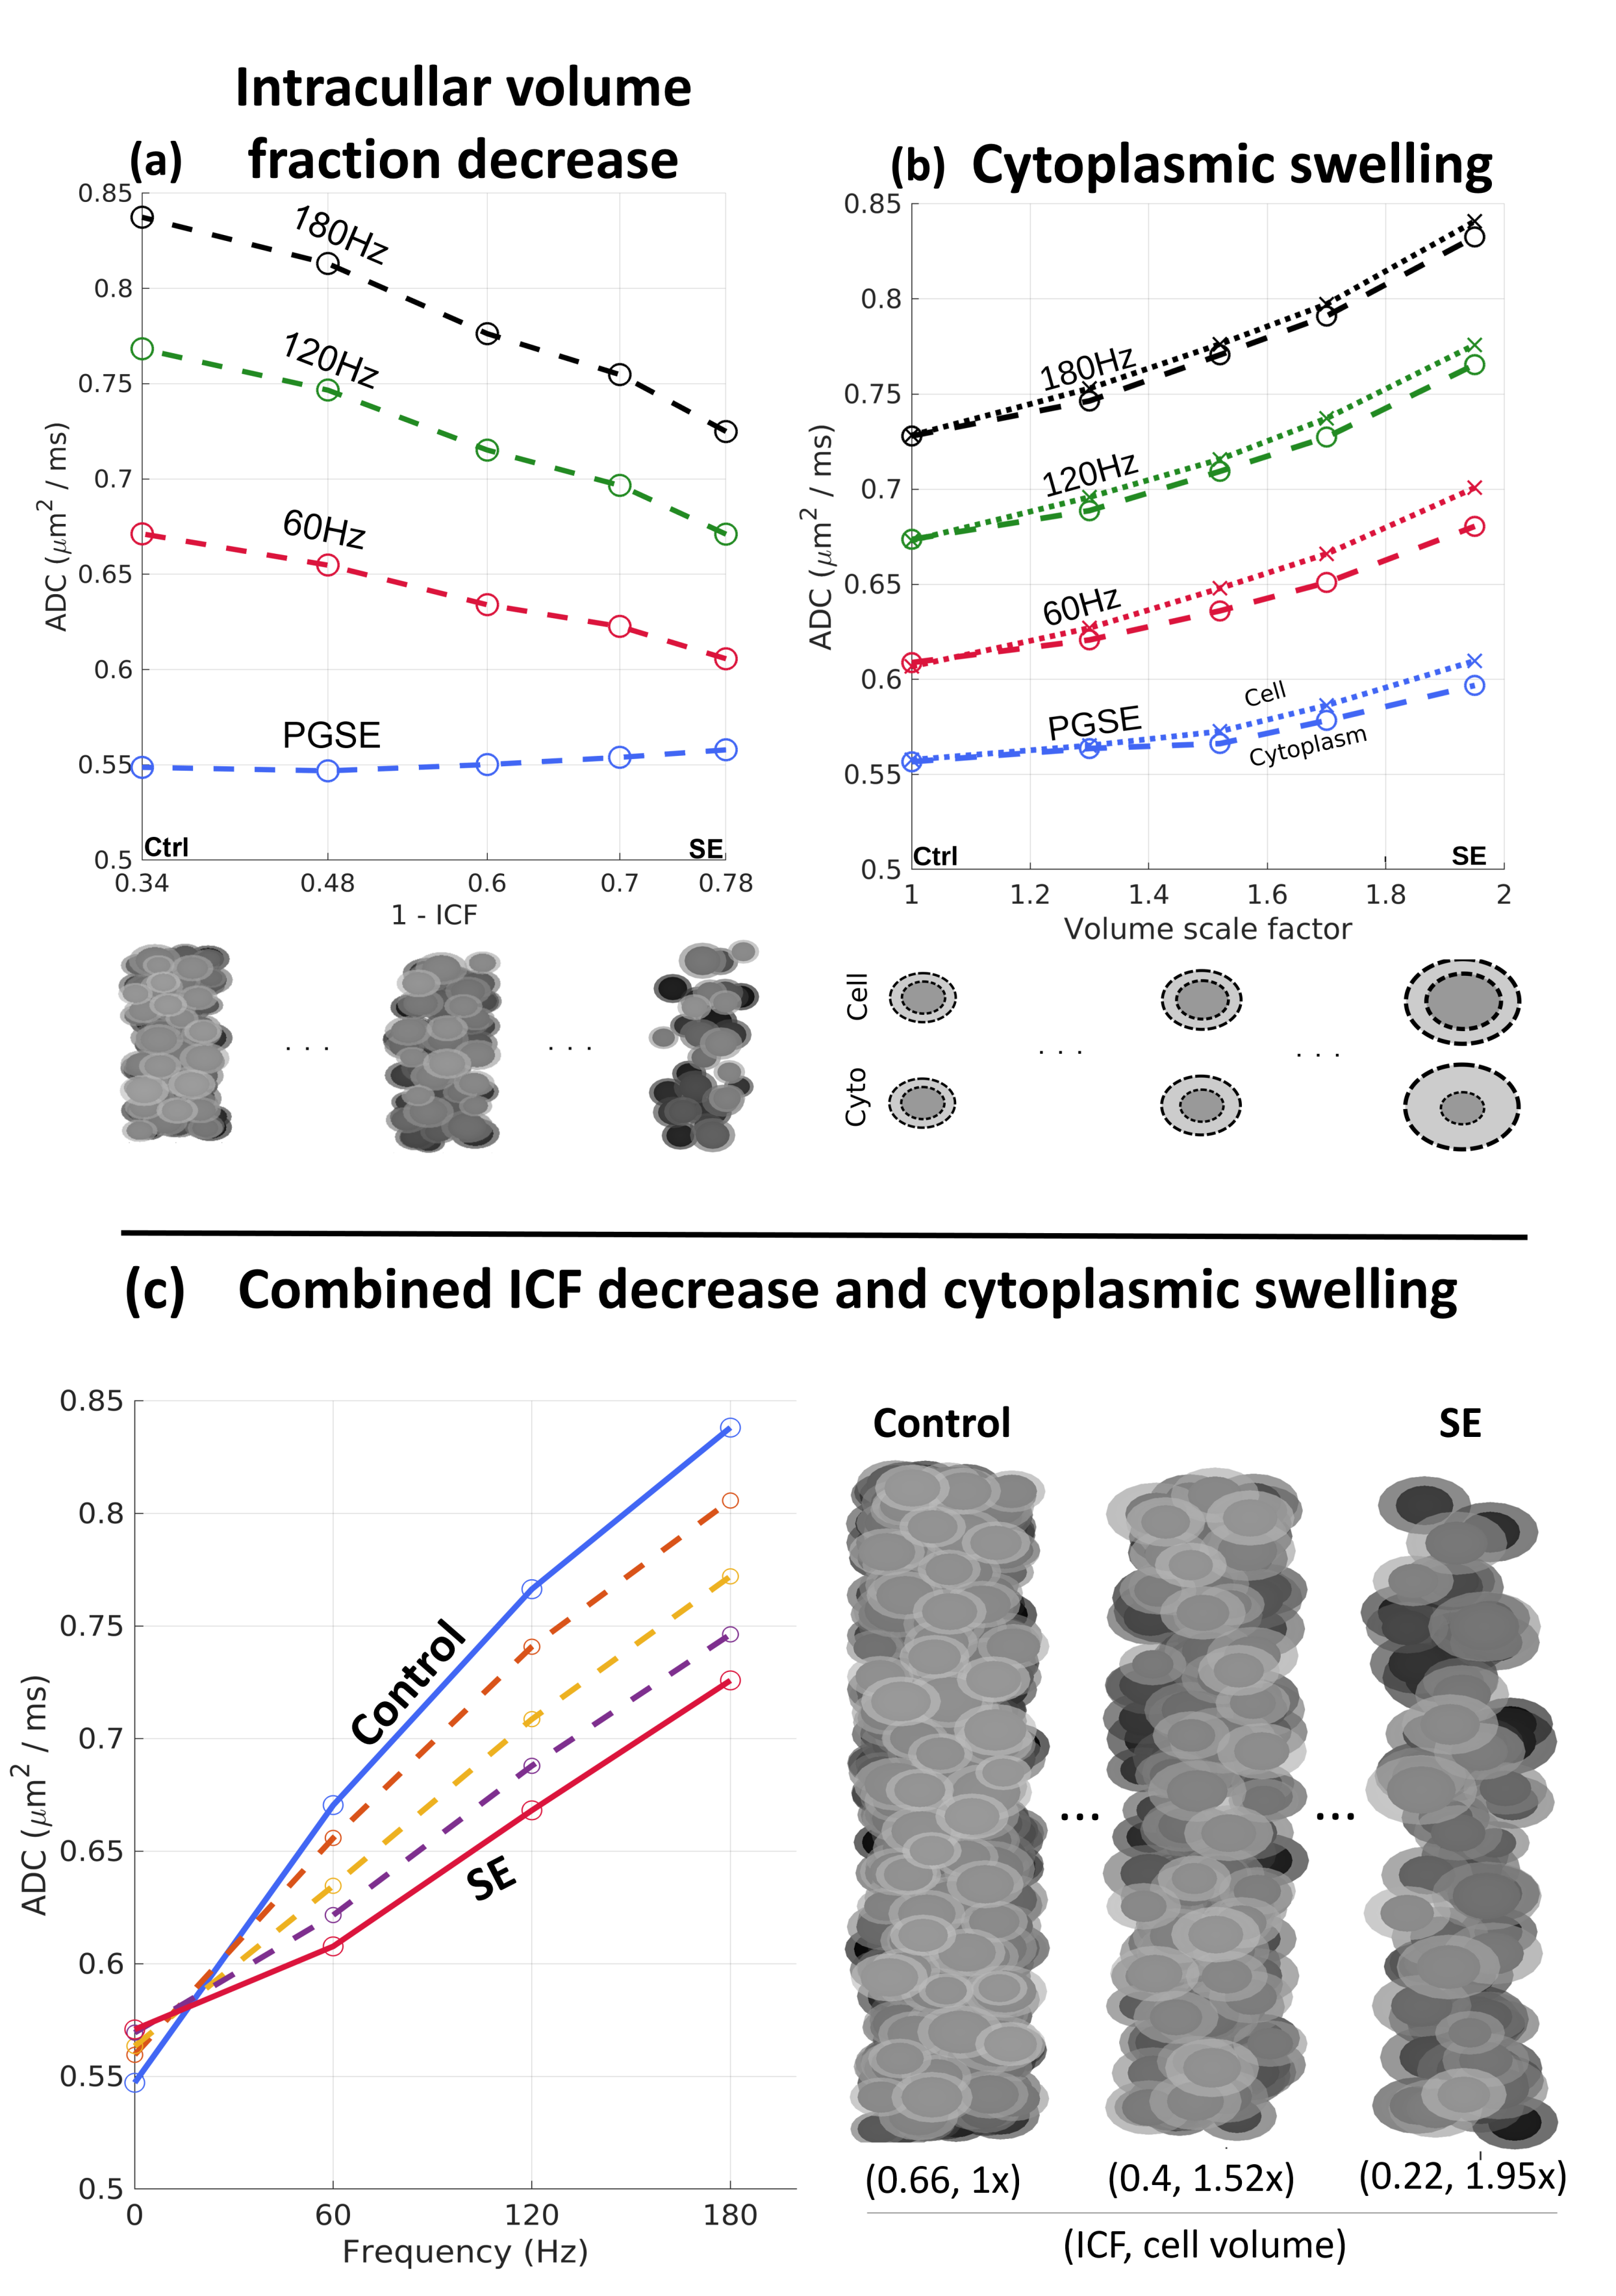
The separate simulated effects of the decreased neuronal density and cytoplasmic swelling after SE are displayed in Fig. 4. Fig. 4a shows a larger decrease in OGSE ADC compared to PGSE with decreasing intra-cellular volume fraction (ICF). Meanwhile, Fig. 4b shows an increase from cell swelling for both PGSE and OGSE, of a magnitude dependent on the manner of swelling (cell versus cytoplasmic). Fig. 4c shows simulated results for the combined effects seen in the SE SBEM data, revealing that the swelling-induced increase at the PGSE time-scale is small relative to the OGSE decrease due to reduced ICF. The simulated spectra highlight the differential effects of the SBEM-observed parameter changes on ADC in both the PGSE- and OGSE-regimes, which are consistent with the experiments. Interestingly, the observed decrease in OGSE-ADC is in apparent opposition to existing PGSE-based TLE studies9, underscoring the importance of probing shorter time-scales to elucidate subcellular changes.
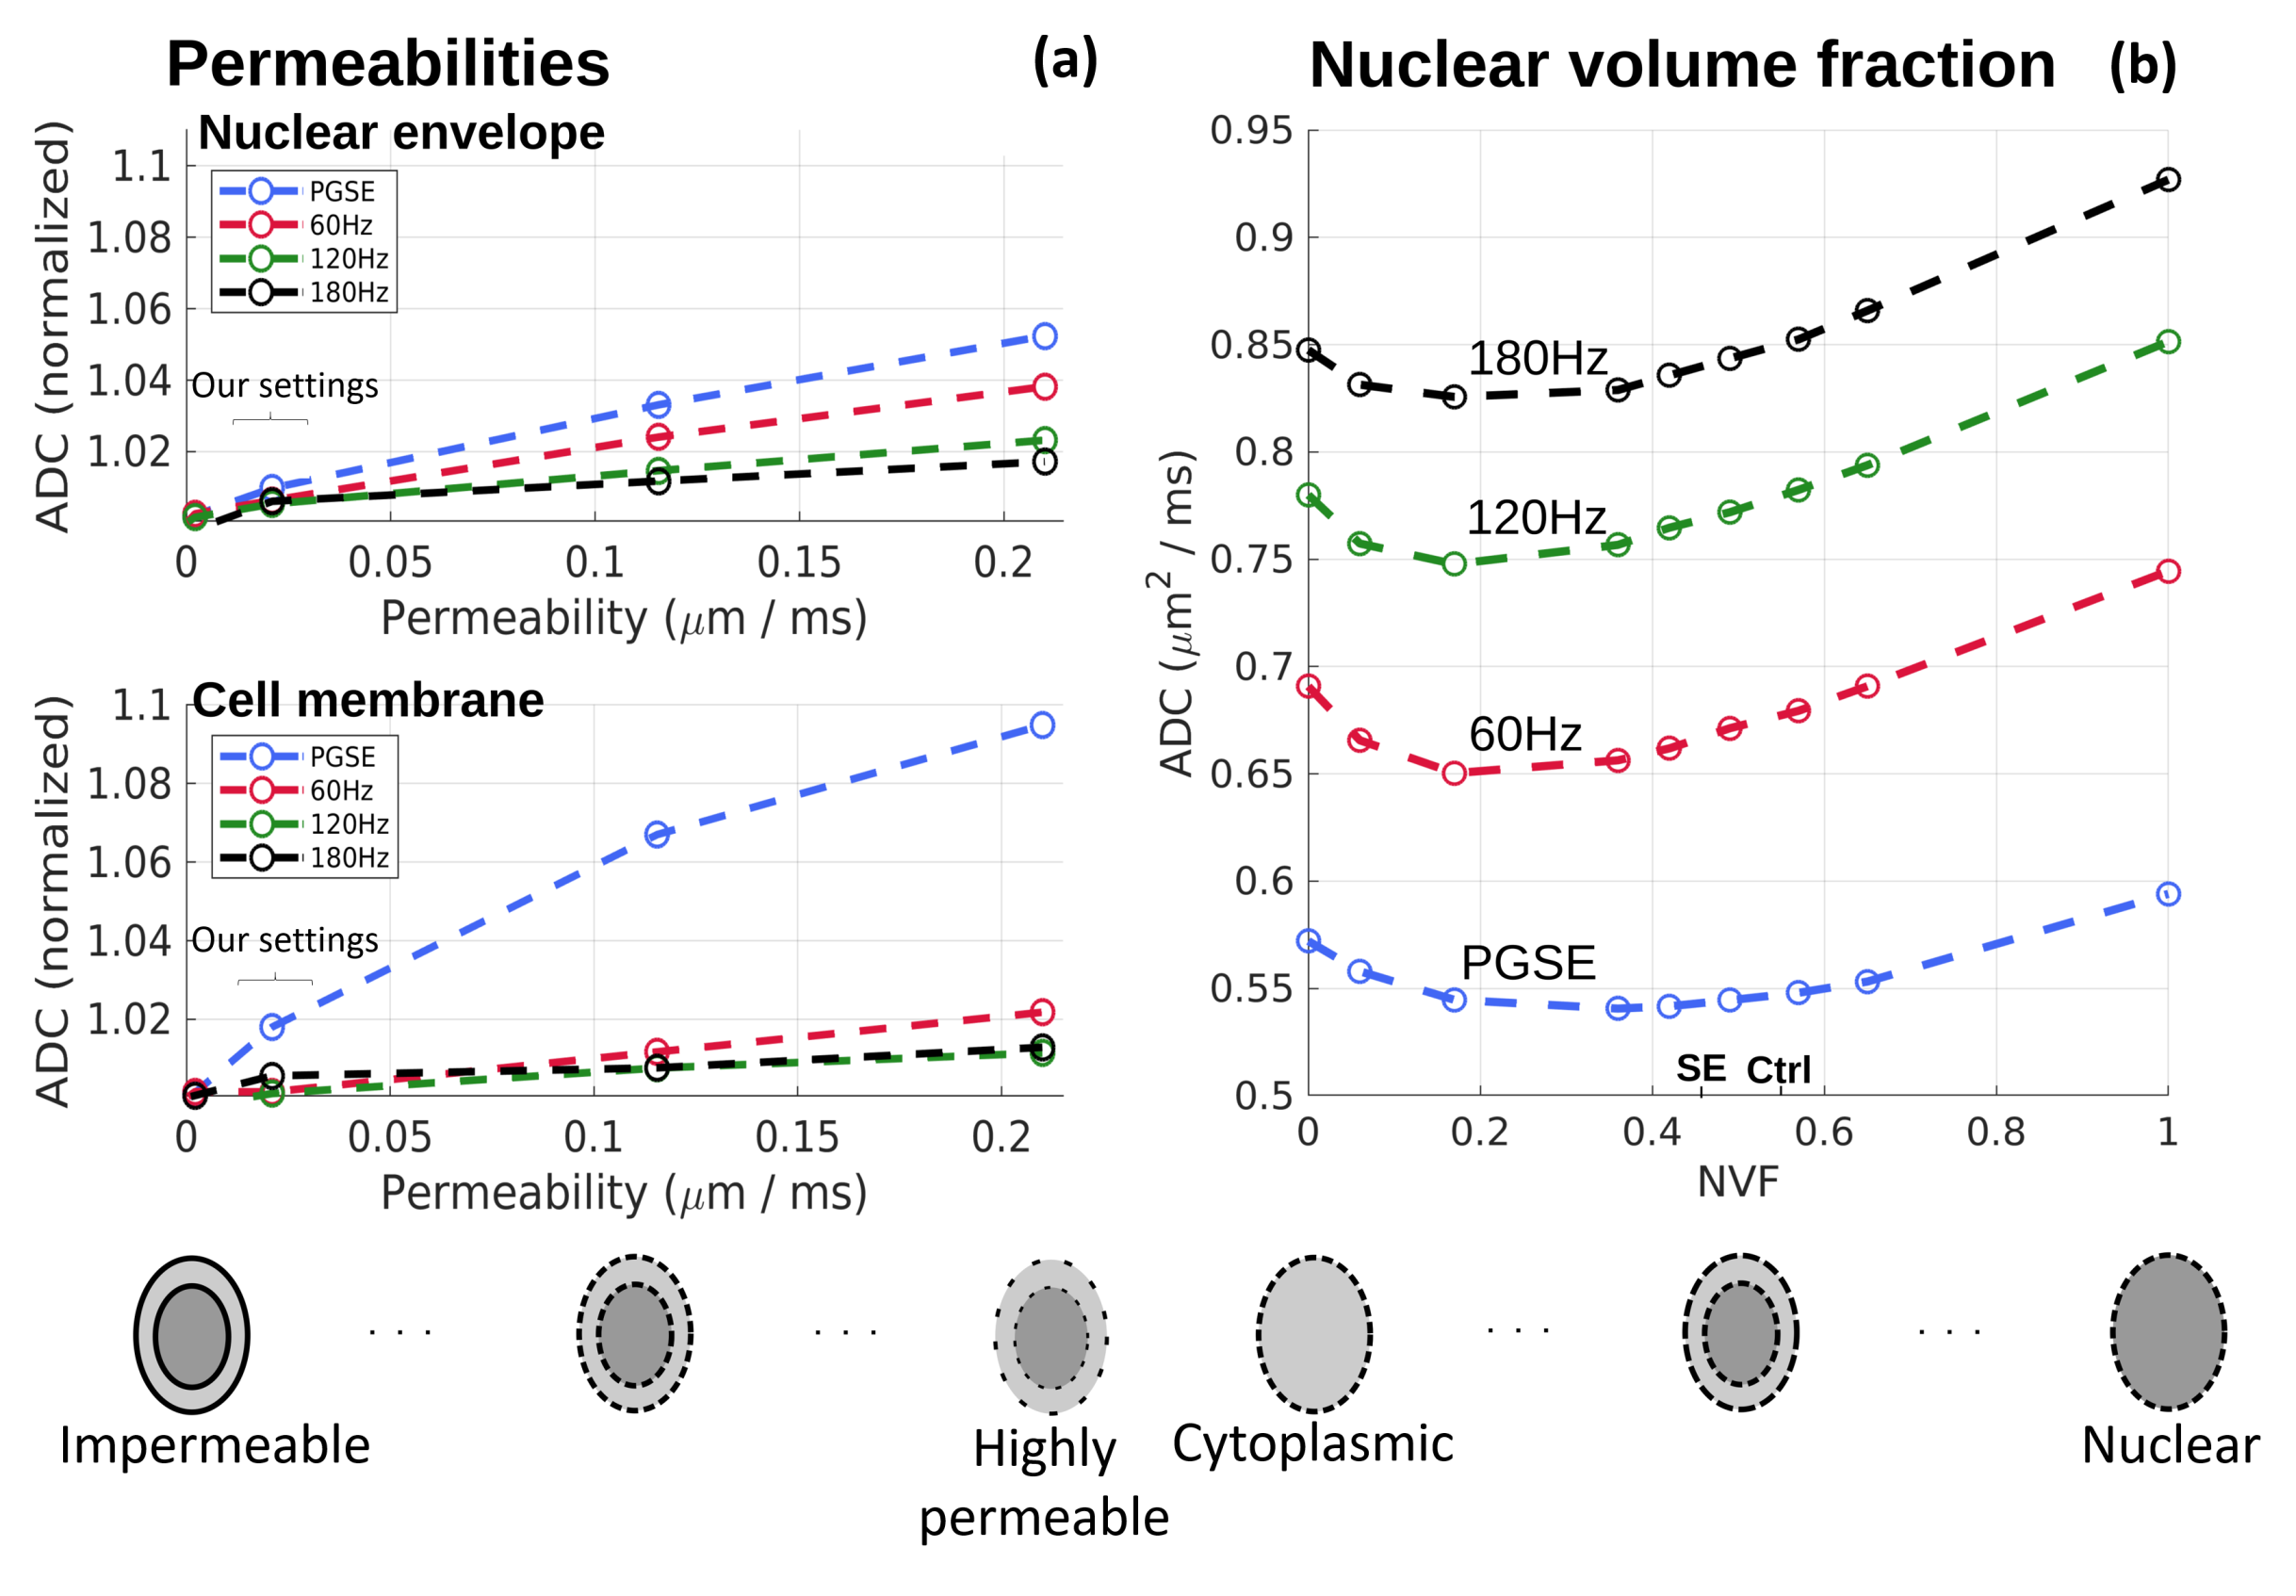
In addition to simulating the SBEM observations, we explored the subtler effects of varying NVF and permeabilities. As seen in Fig. 5a, permeability variations close to our settings (curly bracket) had a small effect on the simulated ADCs, whereas larger increases had a distinct frequency-dependent influence. Fig. 5b notably shows a non-monotonic effect of varying the NVF, with lower ADCs observed in the presence of both the nucleus and cytoplasm. This has important implications for OGSE-based modeling approaches e.g., to estimate cell sizes, as such methods often assume cells as hollow spheres10,11, which given our results may lead to misestimates.
Conclusion
OGSE-dMRI revealed characteristic frequency-dependent ADC variations in different hippocampal ROIs, which changed with SE in the PyCA1 layer. MC simulations in SBEM-derived digital substrates of semi-permeable spheroids with internal nuclei replicated these variations and highlighted the differential effects of underlying changes in neuronal density and cytoplasmic swelling at different frequencies. The simulations allow elucidating the effects of specific microstructural changes on ADC frequency-dependence in neuronal layers, and can be easily extended to wider time/frequency scales.Acknowledgements
This work was supported by National Institutes of Health (NIH) grants R21NS096249 and R01AG057991, the Academy of Finland and Erkko Foundation.References
1. Stepišnik, J., Time-dependent self-diffusion by NMR spin-echo. Physica B: Condensed Matter, 1993. 183(4): p. 343-350.
2. Gore, J.C., J. Xu, D.C. Colvin, T.E. Yankeelov, E.C. Parsons, and M.D. Does, Characterization of tissue structure at varying length scales using temporal diffusion spectroscopy. NMR Biomed, 2010. 23(7): p. 745-56.
3. Does, M.D., E.C. Parsons, and J.C. Gore, Oscillating gradient measurements of water diffusion in normal and globally ischemic rat brain. Magn Reson Med, 2003. 49(2): p. 206-15.
4. Aggarwal, M., M.V. Jones, P.A. Calabresi, S. Mori, and J. Zhang, Probing mouse brain microstructure using oscillating gradient diffusion MRI. Magn Reson Med, 2012. 67(1): p. 98-109.
5. Novikov, D.S., E. Fieremans, S.N. Jespersen, and V.G. Kiselev, Quantifying brain microstructure with diffusion MRI: Theory and parameter estimation. NMR in Biomedicine, 2018. 32(4): p. 1-53.
6. Alexander, D.C., T.B. Dyrby, M. Nilsson, and H. Zhang, Imaging brain microstructure with diffusion MRI: practicality and applications. NMR in Biomedicine, 2019. 32(4): p. e3841.
7. Salo, R.A., I. Belevich, E. Jokitalo, O. Gröhn, and A. Sierra, Assessment of the structural complexity of diffusion MRI voxels using 3D electron microscopy in the rat brain. NeuroImage, 2021. 225: p. 117529.
8. Aggarwal, M., S. Mori, T. Shimogori, S. Blackshaw, and J. Zhang, Three-dimensional diffusion tensor microimaging for anatomical characterization of the mouse brain. Magn Reson Med, 2010. 64(1): p. 249-61.
9. Coras, R., G. Milesi, I. Zucca, A. Mastropietro, A. Scotti, M. Figini, A. Mühlebner, A. Hess, W. Graf, G. Tringali, I. Blümcke, F. Villani, G. Didato, C. Frassoni, R. Spreafico, and R. Garbelli, 7T MRI features in control human hippocampus and hippocampal sclerosis: An ex vivo study with histologic correlations. Epilepsia, 2014. 55(12): p. 2003-2016.
10. Reynaud, O., K.V. Winters, D.M. Hoang, Y.Z. Wadghiri, D.S. Novikov, and S.G. Kim, Pulsed and oscillating gradient MRI for assessment of cell size and extracellular space (POMACE) in mouse gliomas. NMR Biomed, 2016. 29(10): p. 1350-63.
11. Jiang, X., H. Li, J. Xie, E.T. McKinley, P. Zhao, J.C. Gore, and J. Xu, In vivo imaging of cancer cell size and cellularity using temporal diffusion spectroscopy. Magn Reson Med, 2017. 78(1): p. 156-164.
12. Snyder, J.L., A. Clark, Jr., D.Z. Fang, T.R. Gaborski, C.C. Striemer, P.M. Fauchet, and J.L. McGrath, An experimental and theoretical analysis of molecular separations by diffusion through ultrathin nanoporous membranes. J Memb Sci, 2011. 369(1-2): p. 119-129.
Figures