0293
Measuring apparent water exchange using Filter Exchange Imaging and diffusion time dependent kurtosis imaging in post-mortem mouse brains1Department of Radiology, Center for Biomedical Imaging, NYU Grossman School of Medicine, New York, NY, United States, 2Vilcek Institute of Graduate Biomedical Sciences, NYU Grossman School of Medicine, New York, NY, United States
Synopsis
Filter exchange imaging (FEXI) and diffusion time dependent diffusion kurtosis imaging (DKI(t)) are two techniques that are sensitive to water exchange between tissue compartments. However, built on different theoretical frameworks and models, many questions remain on the interpretations of FEXI and (DKI(t)) results in the brain. In this study, we measured water exchange effects in post-mortem mouse brains using FEXI and (DKI(t)) and observed a correlation between them, suggesting that they are sensitive to similar exchange processes.
Introduction
Water exchange between compartments in the brain (e.g., the vascular, ventricular, extracellular, and intracellular spaces) is a crucial biological process for maintaining homeostasis and may serve as a biomarker for diagnosis of structural1 and functional deficits2,3. Filter exchange imaging (FEXI) and diffusion time dependent diffusion kurtosis imaging (DKI(t)) are promising techniques for measuring apparent exchange in the brain. FEXI employs a double-diffusion-encoding scheme to filter tissue compartment based on differences in diffusivities and measures the recovery in diffusion measurements over an increasing mixing time, characterized by the Apparent Exchange Rate (AXR). DKI(t), on the other hand, measure apparent exchange based on modeling the diffusion kurtosis at long times by the Kärger model4. In this study, we investigated the relationship between FEXI and DKI(t) based measurements of apparent exchange in post-mortem mouse brains.Methods
All experimental procedures were approved by the Institutional Animal Care and Use Committee. Data were acquired from inbred BALB/cJ mouse brains (n=5, perfusion fixed) at room temperature. FEXI data were acquired using the following parameters: matrix size =128X80, resolution = 0.2x0.2 mm2, TR/TE = 3000/55ms, 4-step phase cycling with negative crusher gradient to compensate the slice selection gradient5,6, 4-segment EPI acquisition, gradient pulse duration/separation = 3/4ms, filter gradient (b=4,000s/mm2) applied along the rostral-caudal direction (perpendicular to the corpus callosum), detection gradient (b=3,000s/mm2) applied along 30 directions, seven mixing times (5/10/15/25/45/75/105ms). DKI(t) data were acquired using a diffusion-weighted stimulated echo EPI sequence, same FOV and matrix size as FEXI, TE/TR = 41/3000 ms, 4-step phase cycling with zero crusher gradient, 4-segment EPI acquisition, with four b values (2,000/4,000/6,000/7,00 s/mm2), 3ms gradient pulses and eight diffusion times (12/15/25/30/35/50/75/100ms) in 30 directions. We used MRtrix7 and DKI toolbox8 to compute FA, diffusivity, and kurtosis maps at each mixing/diffusion time, and fitted AXR, filter efficiency as well as the (DKI(t)) model based on the Kärger model9.Results
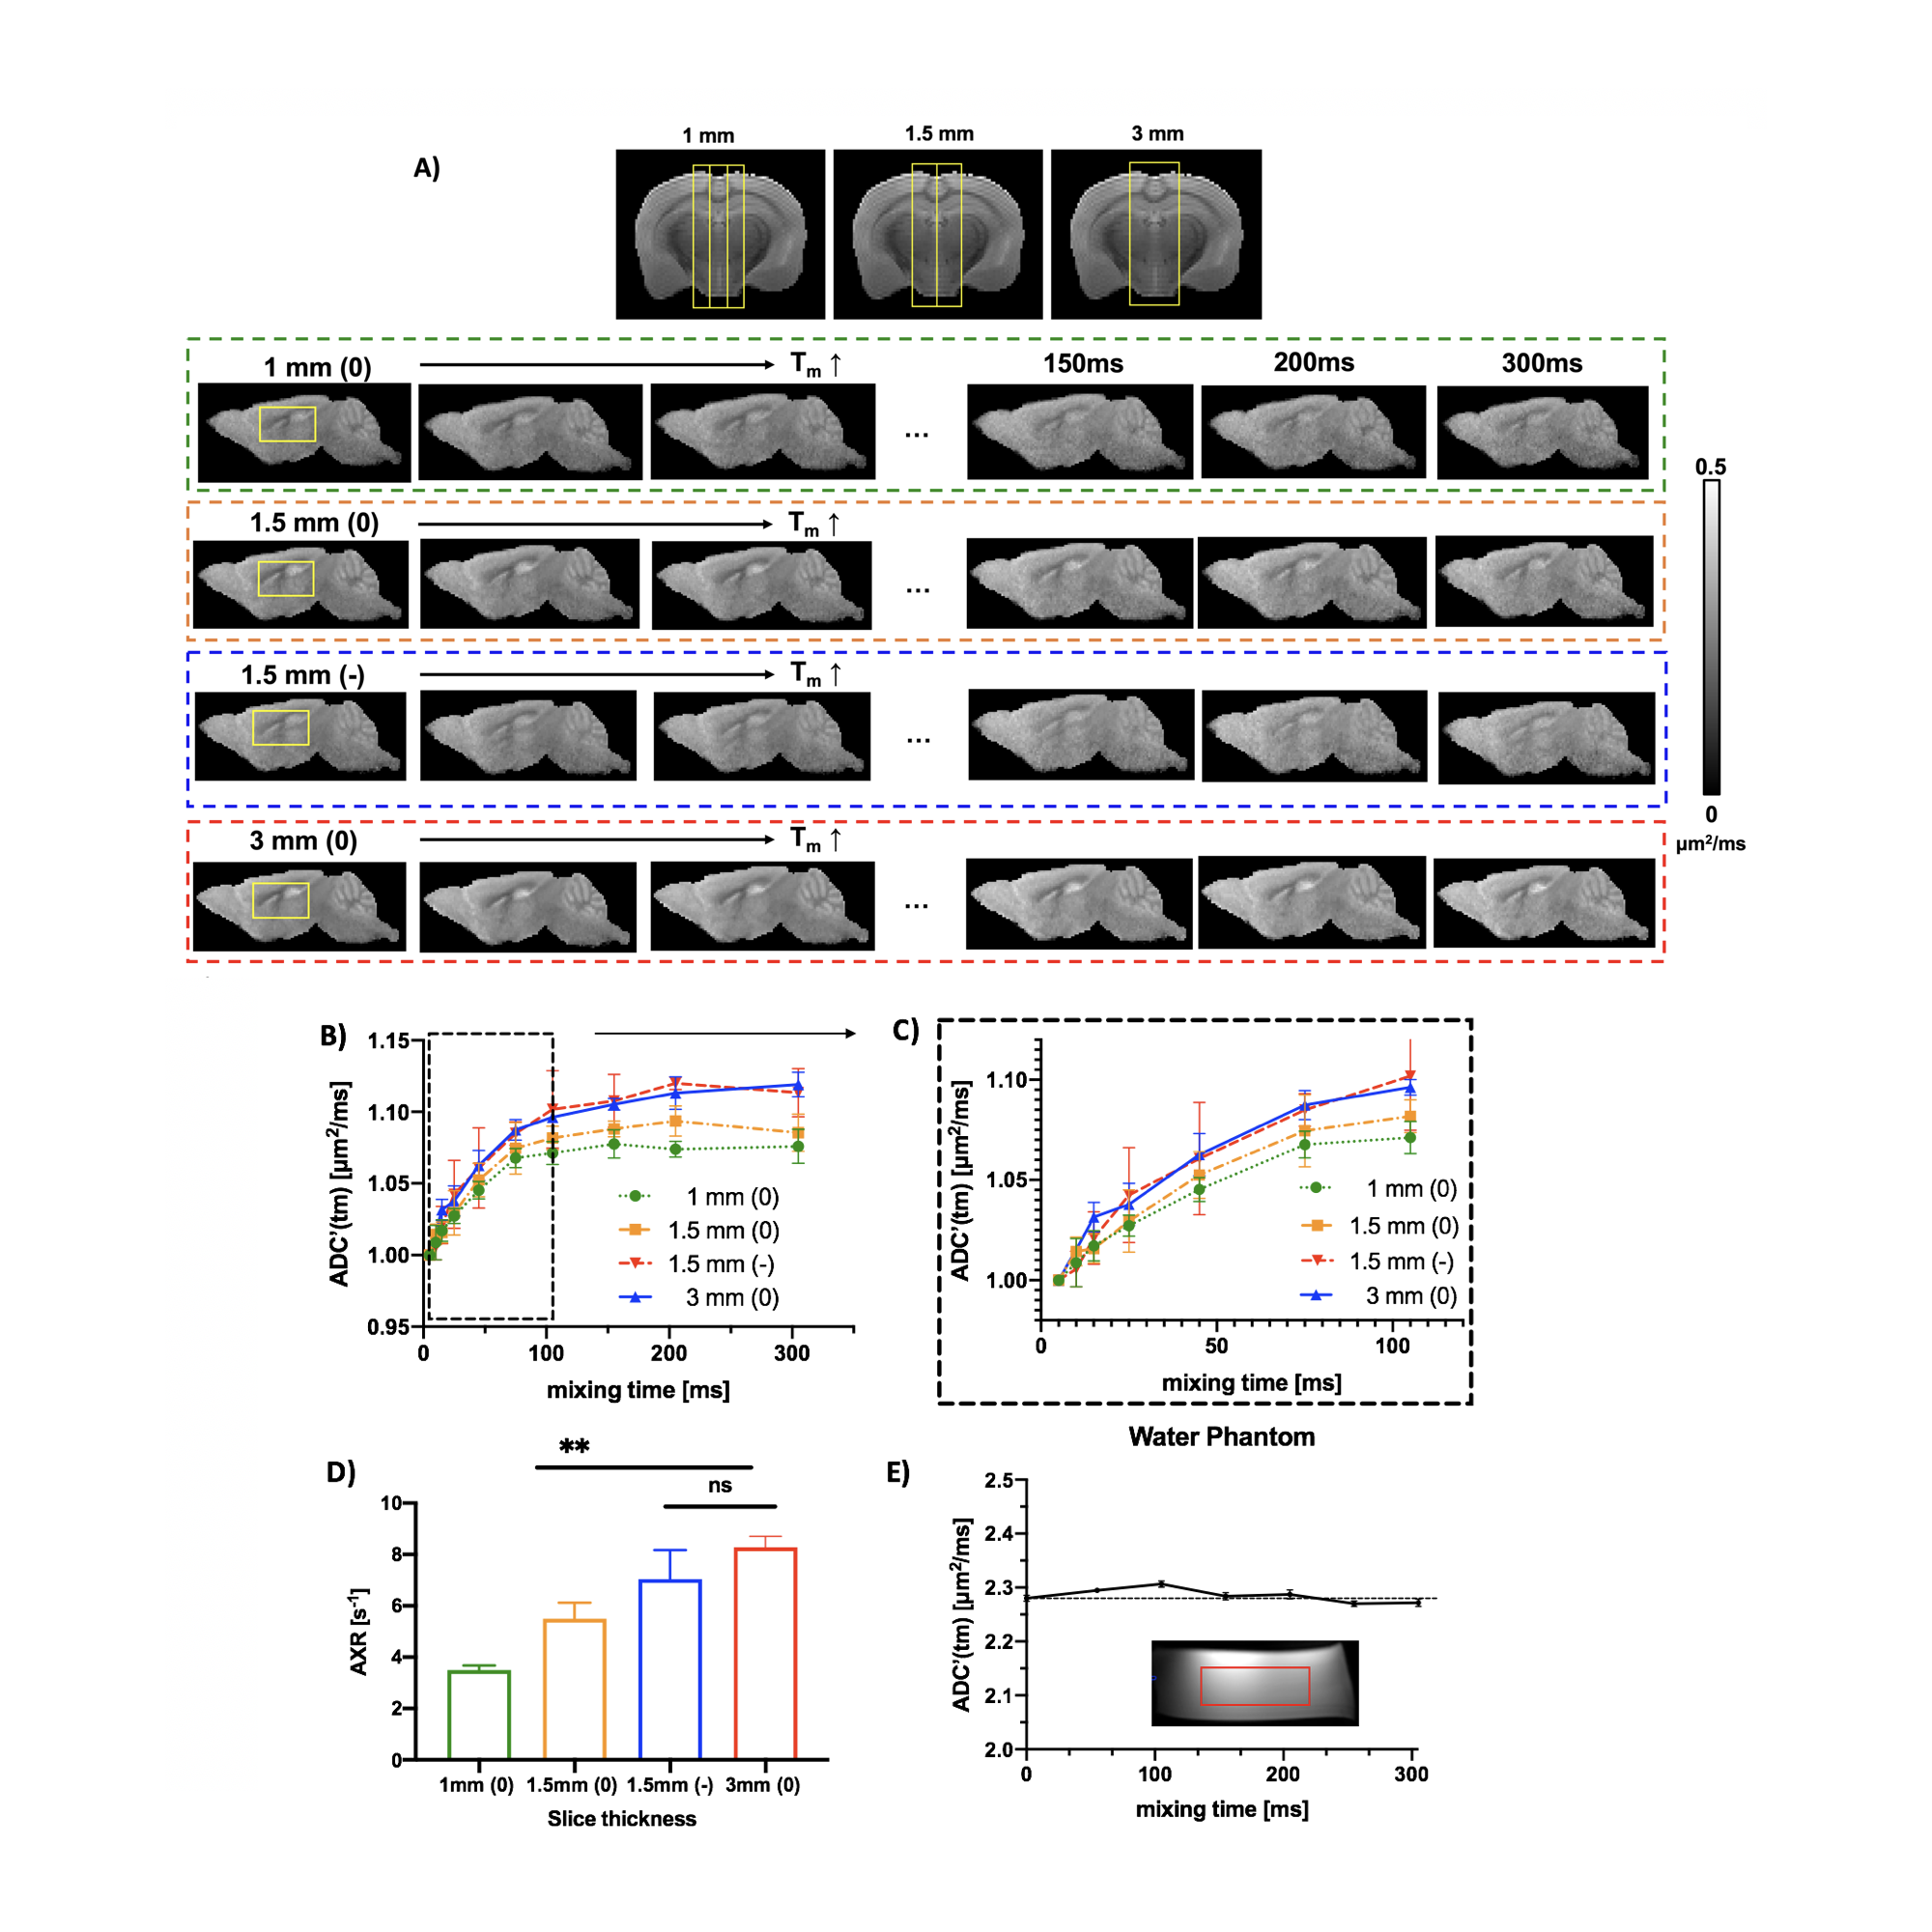
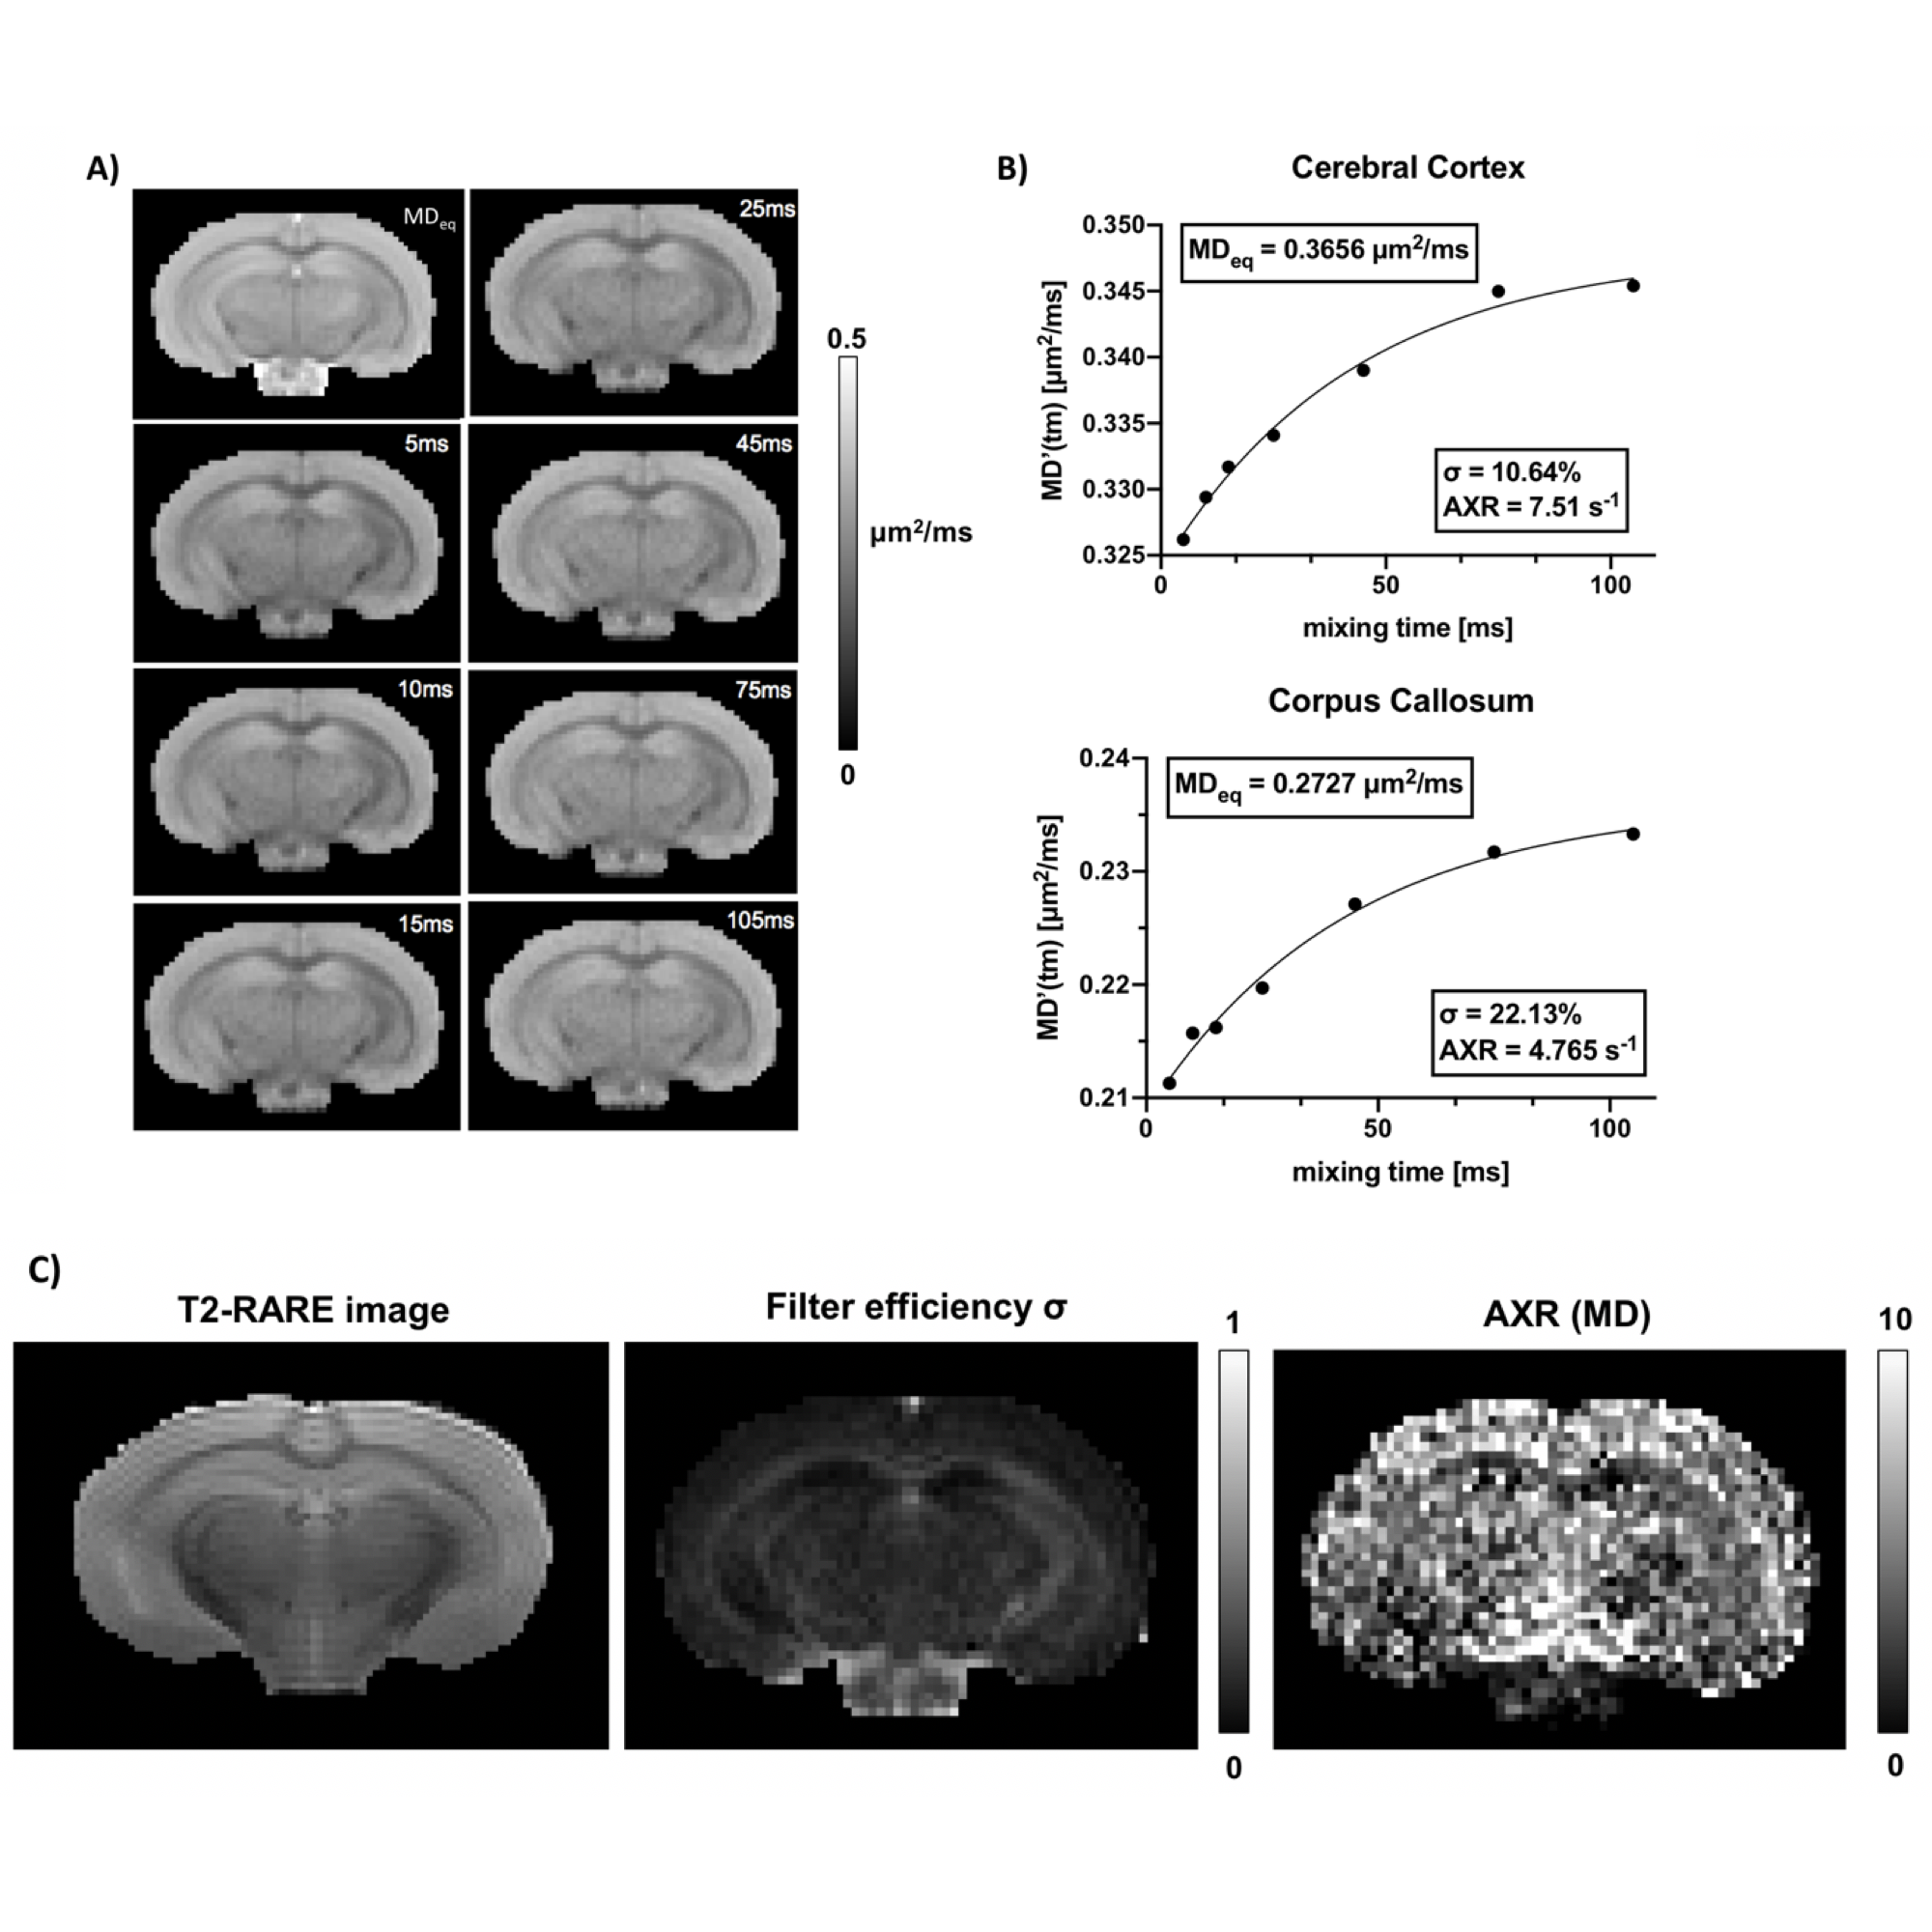
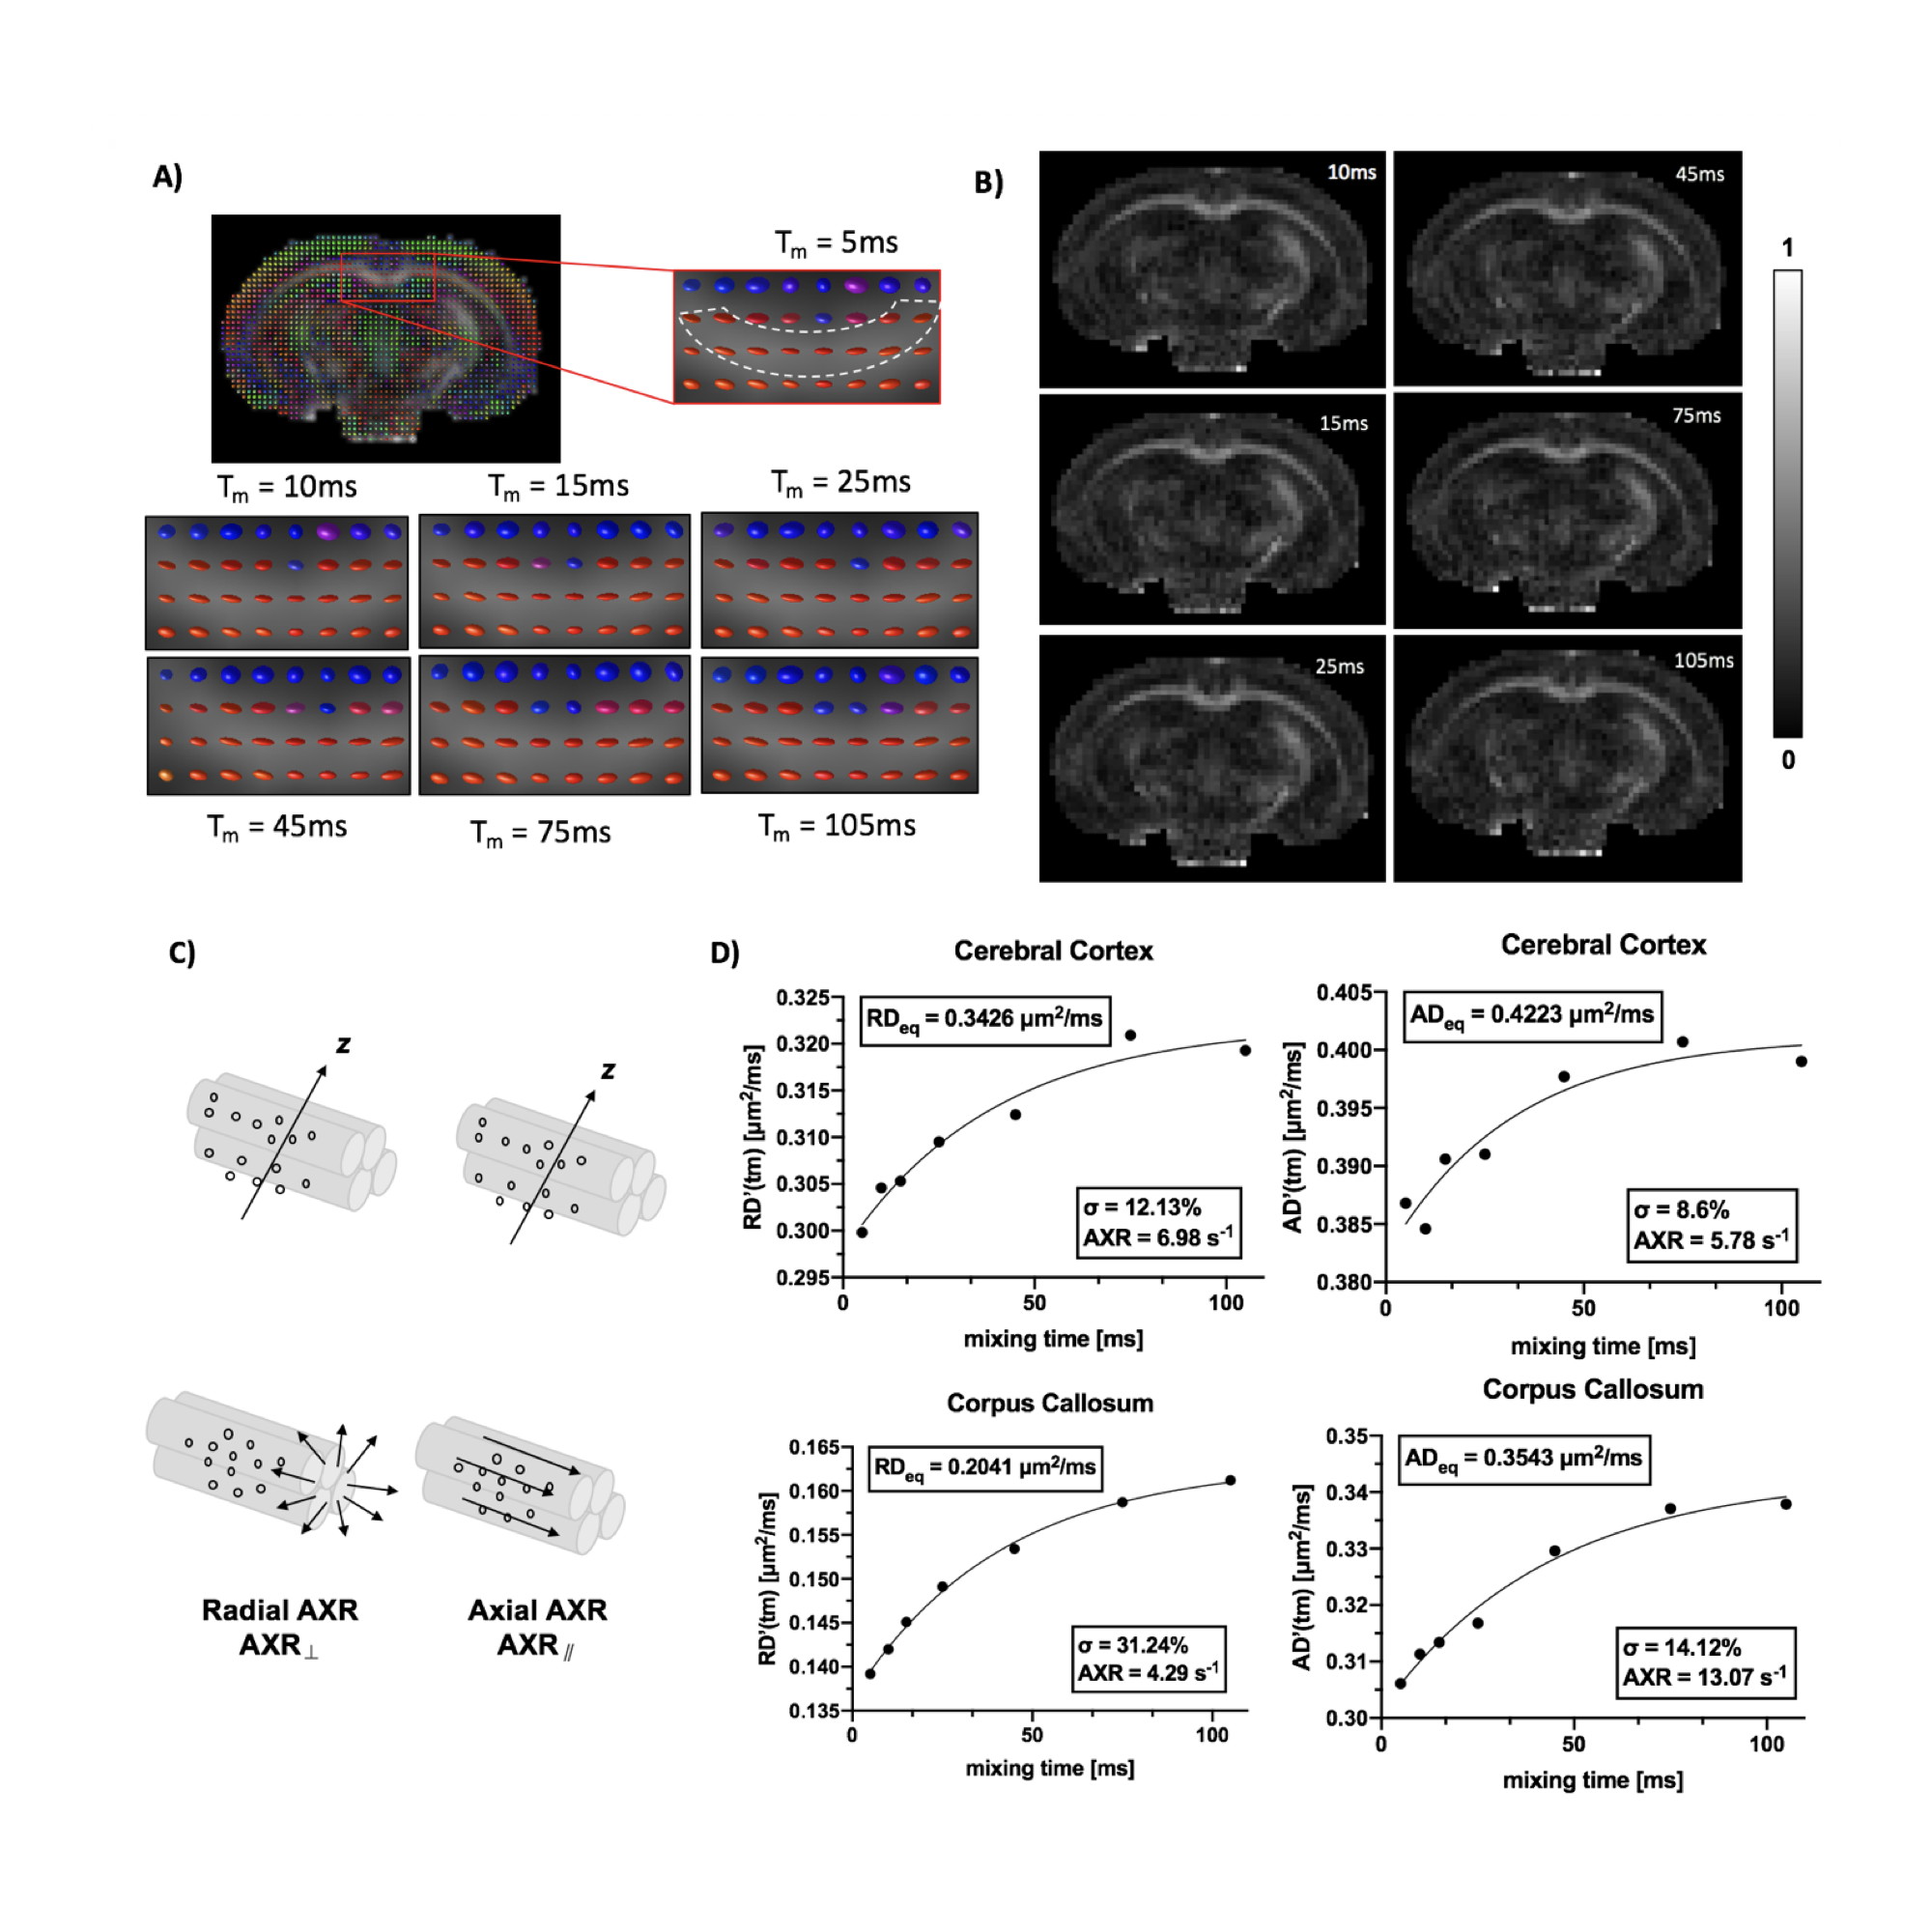
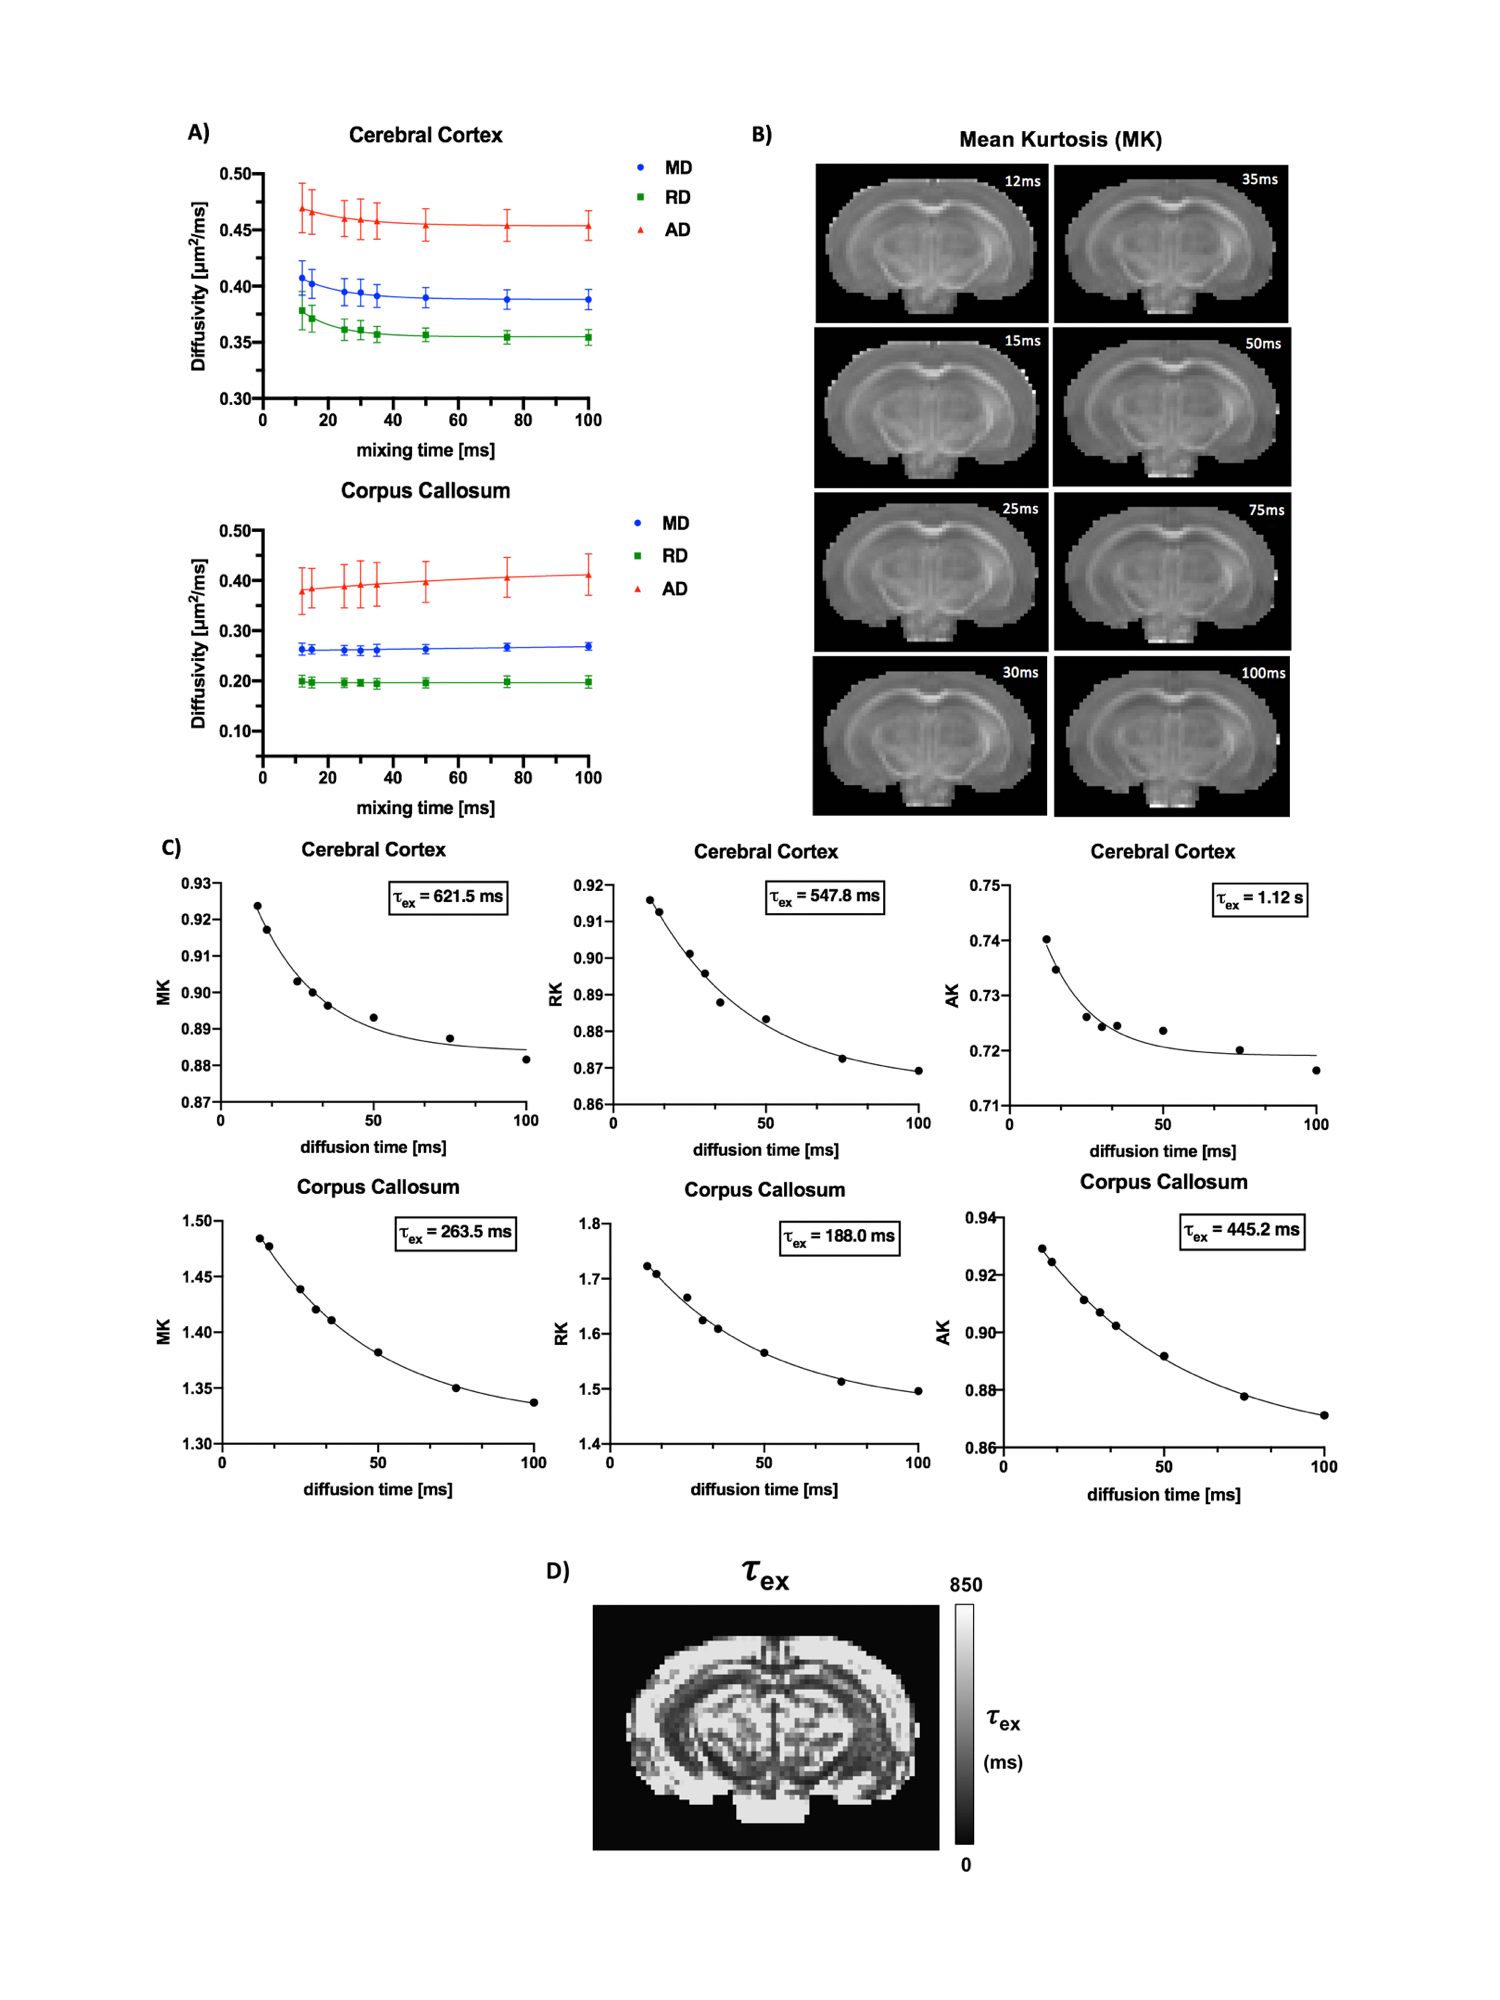
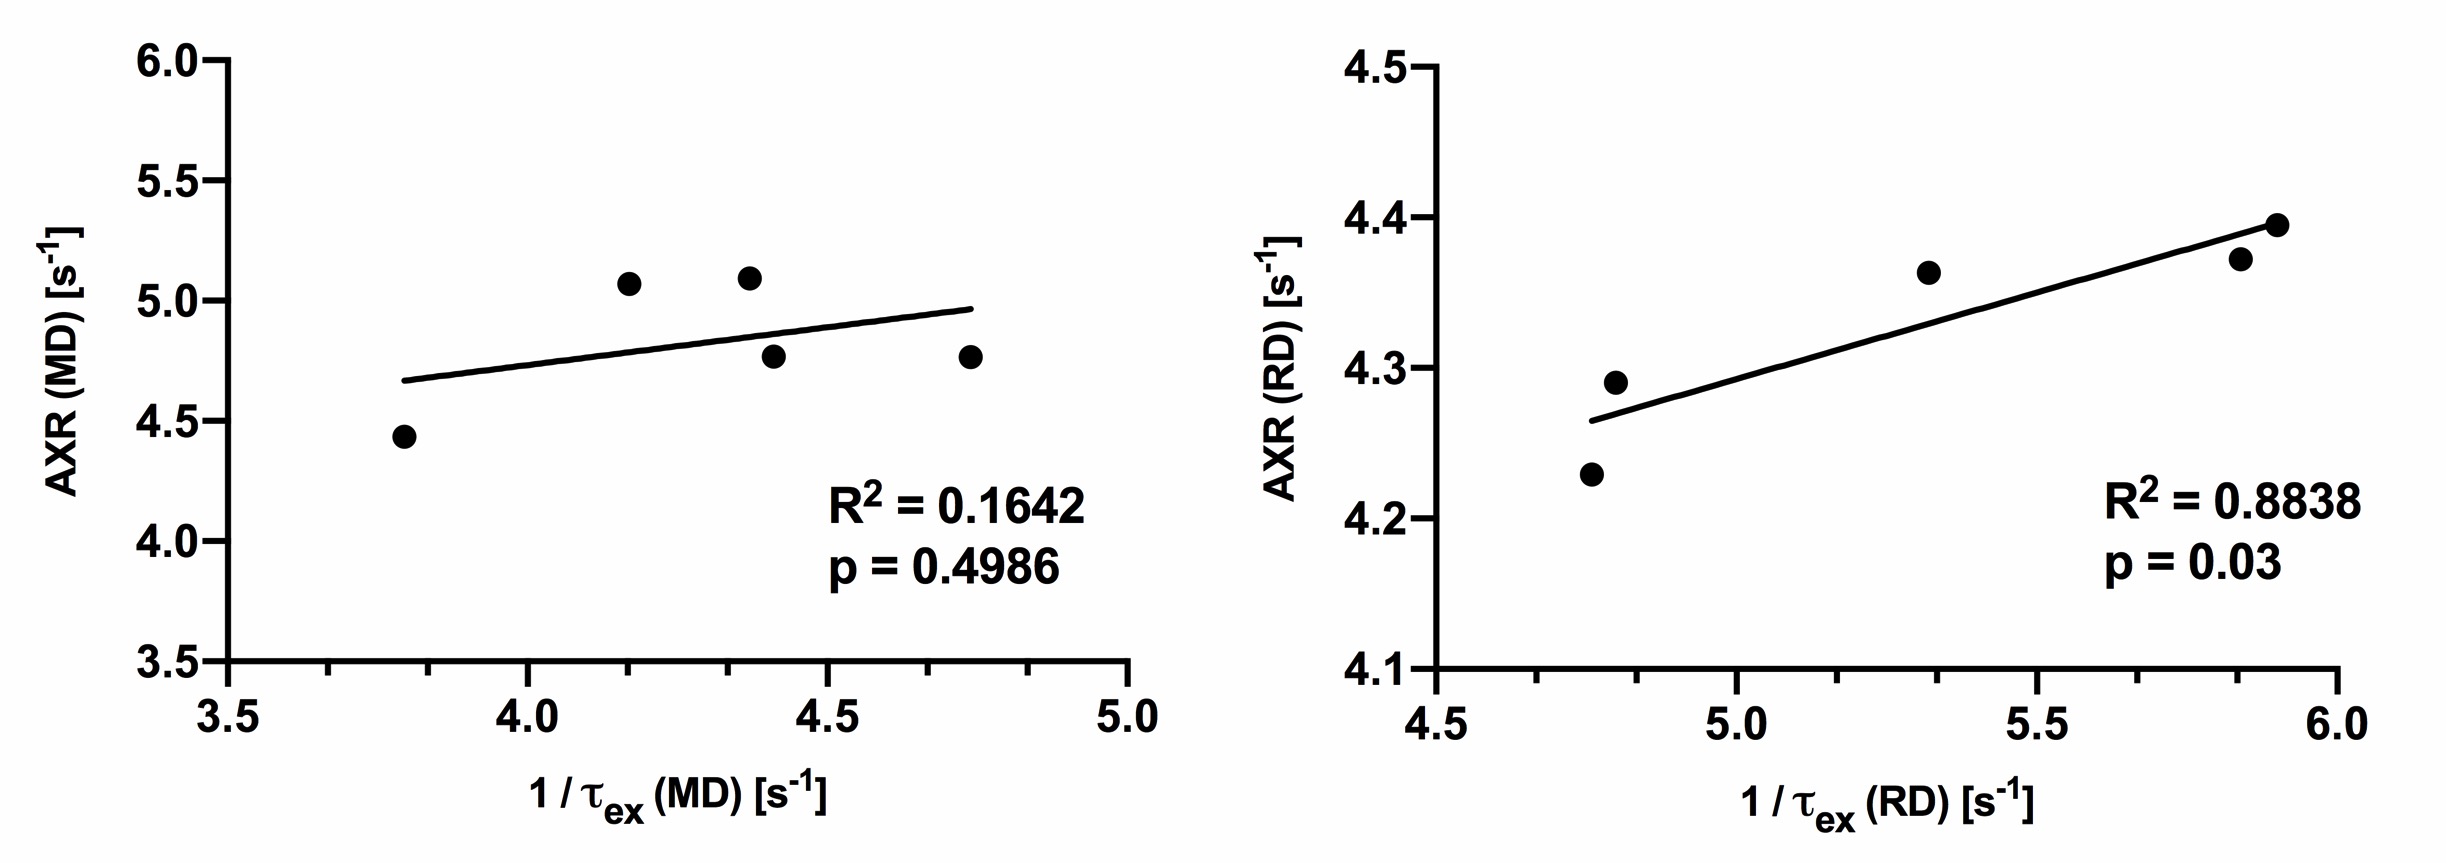
Using 4-step phase cycling and negative crusher gradients to reduce the impacts of crusher and slice selection gradients, FEXI measurements acquired with a 1.5 mm slice thickness were comparable to data acquired with a 3 mm thickness and zero crusher (Fig. 1A-D). Results from a water phantom (Fig. 1E) also showed reliable ADC measurement with mixing times up to 300ms. Changes in mean diffusivity with increasing mixing time, MD(tm), showed that the corpus callosum (CC) had higher filter efficiency and lower AXR values than the cortex (CX) (Fig. 2A-B). Diffusion tensors in the CC maintained their orientations as the mixing time increased up to 105ms (Fig. 3A-B). AXRs based on axial diffusivity (AD) in corpus callosum showed high AXR but low filter efficiency, whereas AXRs based on radial diffusivity (RD) showed low AXR but high filter efficiency (Fig. 3D).While diffusivities in the CX still showed time dependence (Fig. 4A), no apparent dependence in diffusivities was observed in the CC, suggesting the Kärger model can be applied here12. Fig. 4B shows estimated MK maps at different diffusion times. τex estimated based on MK, AK, and RK in CC and CX are shown in Fig. 4C, with voxel-wise fitting of τex based on RK shown in Fig. 4D. In the CC, AXR based on RD and 1/τex based on RK show strong correlation (p=0.03, Fig. 5).Discussion
The correlation between FEXI and DKI(t) measurements suggests both being sensitive to similar exchange processes in the post-mortem mouse brain, presumably water exchange between intra and extracellular spaces via passive diffusion. FEXI has a more straightforward physical interpretation than DKI(t), but DKI(t) is relatively easy to implement, as optimal filter gradients to effectively suppress spins from one compartment may be difficult to find due to complex microstructure in the brain, as suggested by the results from CX and CC. It is important to note that both FEXI and DKI(t) results are not direct measurements of exchange and are complicated by underlying tissue microstructural properties10-12. It is difficult to disentangle microstructural involvement with exchange effect in both techniques, so direct comparisons between them and other exchange measurements are still challenging. One limitation of the study is the use of post-mortem brains. The 4-step phase cycling used here prolonged the imaging time, making it difficult to apply the same protocol for in vivo imaging. It is known that water exchange in post-mortem tissues is different from in vivo due to the lack of active transport13 as well as differences in diffusivities. However, the sequences can be used to determine the appropriate range of mixing times for in vivo studies with regular crusher gradients.Conclusion
We report correlation between FEXI and DKI(t) based exchange measurements in post-mortem mouse brain, suggesting both methods are sensitive to similar exchange processes in the post-mortem mouse brain.Acknowledgements
No acknowledgement found.References
1. Nilsson M, Lätt J, van Westen D, Brockstedt S, Lasič S, Ståhlberg F, Topgaard D. Noninvasive mapping of water diffusional exchange in the human brain using filter‐exchange imaging. Magnetic resonance in medicine. 2013 Jun;69(6):1572-80.
2. Li X, Mangia S, Lee JH, Bai R, Springer Jr CS. NMR shutter‐speed elucidates apparent population inversion of 1H2O signals due to active transmembrane water cycling. Magnetic resonance in medicine. 2019 Jul;82(1):411-24.
3. Springer Jr CS. Using 1H2O MR to measure and map sodium pump activity in vivo. Journal of Magnetic Resonance. 2018 Jun 1;291:110-26.
4. J. Kärger, NMR self-diffusion studies in heterogeneous systems, Advances in Colloid and Interface Science, 23 (1985) 129-148.
5. Lasič S, Lundell H, Topgaard D, Dyrby TB. Effects of imaging gradients in sequences with varying longitudinal storage time—Case of diffusion exchange imaging. Magnetic resonance in medicine. 2018 Apr;79(4):2228-35.
6. Kinchesh P, Kleinnijenhuis M, Miller KL, Smart S. Minimizing diffusion encoding of slice selection in stimulated echo imaging. In Proceedings of the 23rd Annual Meeting of ISMRM. Toronto, Canada 2015 (p. 2791).
7. J.-D. Tournier, R. E. Smith, D. Raffelt, R. Tabbara, T. Dhollander, M. Pietsch, D. Christiaens, B. Jeurissen, C.-H. Yeh, and A. Connelly. MRtrix3: A fast, flexible and open software framework for medical image processing and visualisation. NeuroImage, 202 (2019), pp. 116–37.
8. Veraart, J.; Sijbers, J.; Sunaert, S.; Leemans, A. & Jeurissen, B. Weighted linear least squares estimation of diffusion MRI parameters: strengths, limitations, and pitfalls. NeuroImage, 2013, 81, 335-346
9. E. Fieremans, D.S. Novikov, J.H. Jensen, J.A. Helpern, Monte Carlo study of a two-compartment exchange model of diffusion, NMR in biomedicine, 23 (2010) 711-724.
10. Novikov DS, Jensen JH, Helpern JA, Fieremans E. Revealing mesoscopic structural universality with diffusion. Proc Natl Acad Sci U S A. 2014 Apr 8;111(14):5088-93.
11. Fieremans E, Burcaw LM, Lee HH, Lemberskiy G, Veraart J, Novikov DS. In vivo observation and biophysical interpretation of time-dependent diffusion in human white matter. NeuroImage. 2016 Apr 1;129:414-27.
12. Lee HH, Papaioannou A, Novikov DS, Fieremans E. In vivo observation and biophysical interpretation of time-dependent diffusion in human cortical gray matter. Neuroimage. 2020 Nov 15;222:117054.
13. Li X, Mangia S, Lee JH, Bai R, Springer CS Jr. NMR shutter-speed elucidates apparent population inversion of 1 H2O signals due to active transmembrane water cycling. Magn Reson Med. 2019 Jul;82(1):411-424.
Figures