0291
Multi-modal, multi-resolution imaging of a single mouse brain1University of Chicago, Chicago, IL, United States, 2Advanced Photon Source, Argonne National Laboratory, Lamont, IL, United States
Synopsis
Mammalian neurons operate at length scales spanning many orders of magnitude; micron-scale-diameter myelinated axons project millimeters across brain regions, forming nanometer scale synapses. Capturing these disparately sized anatomical features requires imaging samples with multiple independent imaging modalities. Directly correlating features across modalities requires that all imaging is performed in the same brain. Here, we imaged the same postmortem mouse brain over five orders of spatial resolution using MRI, synchrotron x-ray tomography (μCT), and electron microscopy. This pipeline provides an unprecedented look across a single brain's multi-scaled organization and a vehicle for studying the brain’s multi-scaled pathologies.
Introduction
Neurons in the brain project macroscopic distances (millimeters to centimeters),1 while simultaneously producing microscopic connections and plasticity-related changes at the nanoscale.2 No single imaging modality currently spans the six orders of length-scale (mm to nm) required to map the whole brain while simultaneously resolving individual synapses. Magnetic resonance imaging (MRI) allows mapping of neuronal tracts spanning macroscopic distances. Electron microscopy (EM) provides synapse-level resolution (3 nm) 3 but remains limited to small samples - 1mm3 is almost 2 million terabytes of data.4 An ideal intermediate imaging modality would achieve micron-scale resolution throughout an entire large tissue volume and use a sample preparation compatible with additional imaging including MRI and EM.Synchrotron-based x-ray tomography (μCT) nondestructively provides micron-scale resolution over 1cm3 whole tissue volumes, bridging the resolution disparity between MRI and EM imaging techniques (Fig. 1). In this work we describe a serial imaging pipeline: a fixed postmortem mouse brain was imaged with MRI, reimaged with μCT 5, 6, then targeted sub-volumes were imaged with automated EM.7
Materials and Methods
A C57bl6 mouse brain was perfusion fixed, removed, and imaged with MRI. Tissue was then stained with osmium and other heavy metals, dehydrated, and embedded in plastic for mCT and EM.8, 9MRI data were acquired at 9.4 Tesla (Bruker Biospin). DTI data were collected with 150μm isotropic resolution, using a diffusion-weighted 3D spin echo over 30 directions. Structural MRI data were acquired with 50μm isotropic resolution using a multi-echo gradient echo sequence from which a T2* weighted water peak height image was reconstructed, where image contrast was produced by isolating the maximum voxel-wise signal amplitude of the water spectrum.10 Data were reconstructed, processed, and analyzed with IDL 8.2 (ITT Visual Information Solutions), Matlab 2014b (The MathWorks Inc), and FSL 5.0.9 (FMRIB Software Library). The mean b = 0 s/mm2 dataset from the diffusion acquisition was registered to the structural using FLIRT (FSL).11 Principal, secondary, and tertiary diffusion directions were estimated using BEDPOSTX (FSL).12
µCT data were acquired at the Advanced Photon Source, Argonne National Laboratory using single quasi-monochomatic x-rays with a peak energy of 25keV. Single grid point, 30ms projection images were acquired over 3600 angles. The sample was imaged over 6⨯18 contiguous grid points to cover the FOV. Acquired μCT data were registered and stitched together into a complete sinogram. Reconstruction of the entire dataset was performed using TomoPy (Argonne National Laboratory) with 1.17µm isotropic resolution.
ROIs in the sample were identified and imaged in an Apreo scanning electron microscope (ThermoFisher Scientific) with either 135nm or 3nm in-plane resolution using 3μs dwell times.
All manual labeling of somas and myelinated axons was performed using Knossos.13
Results
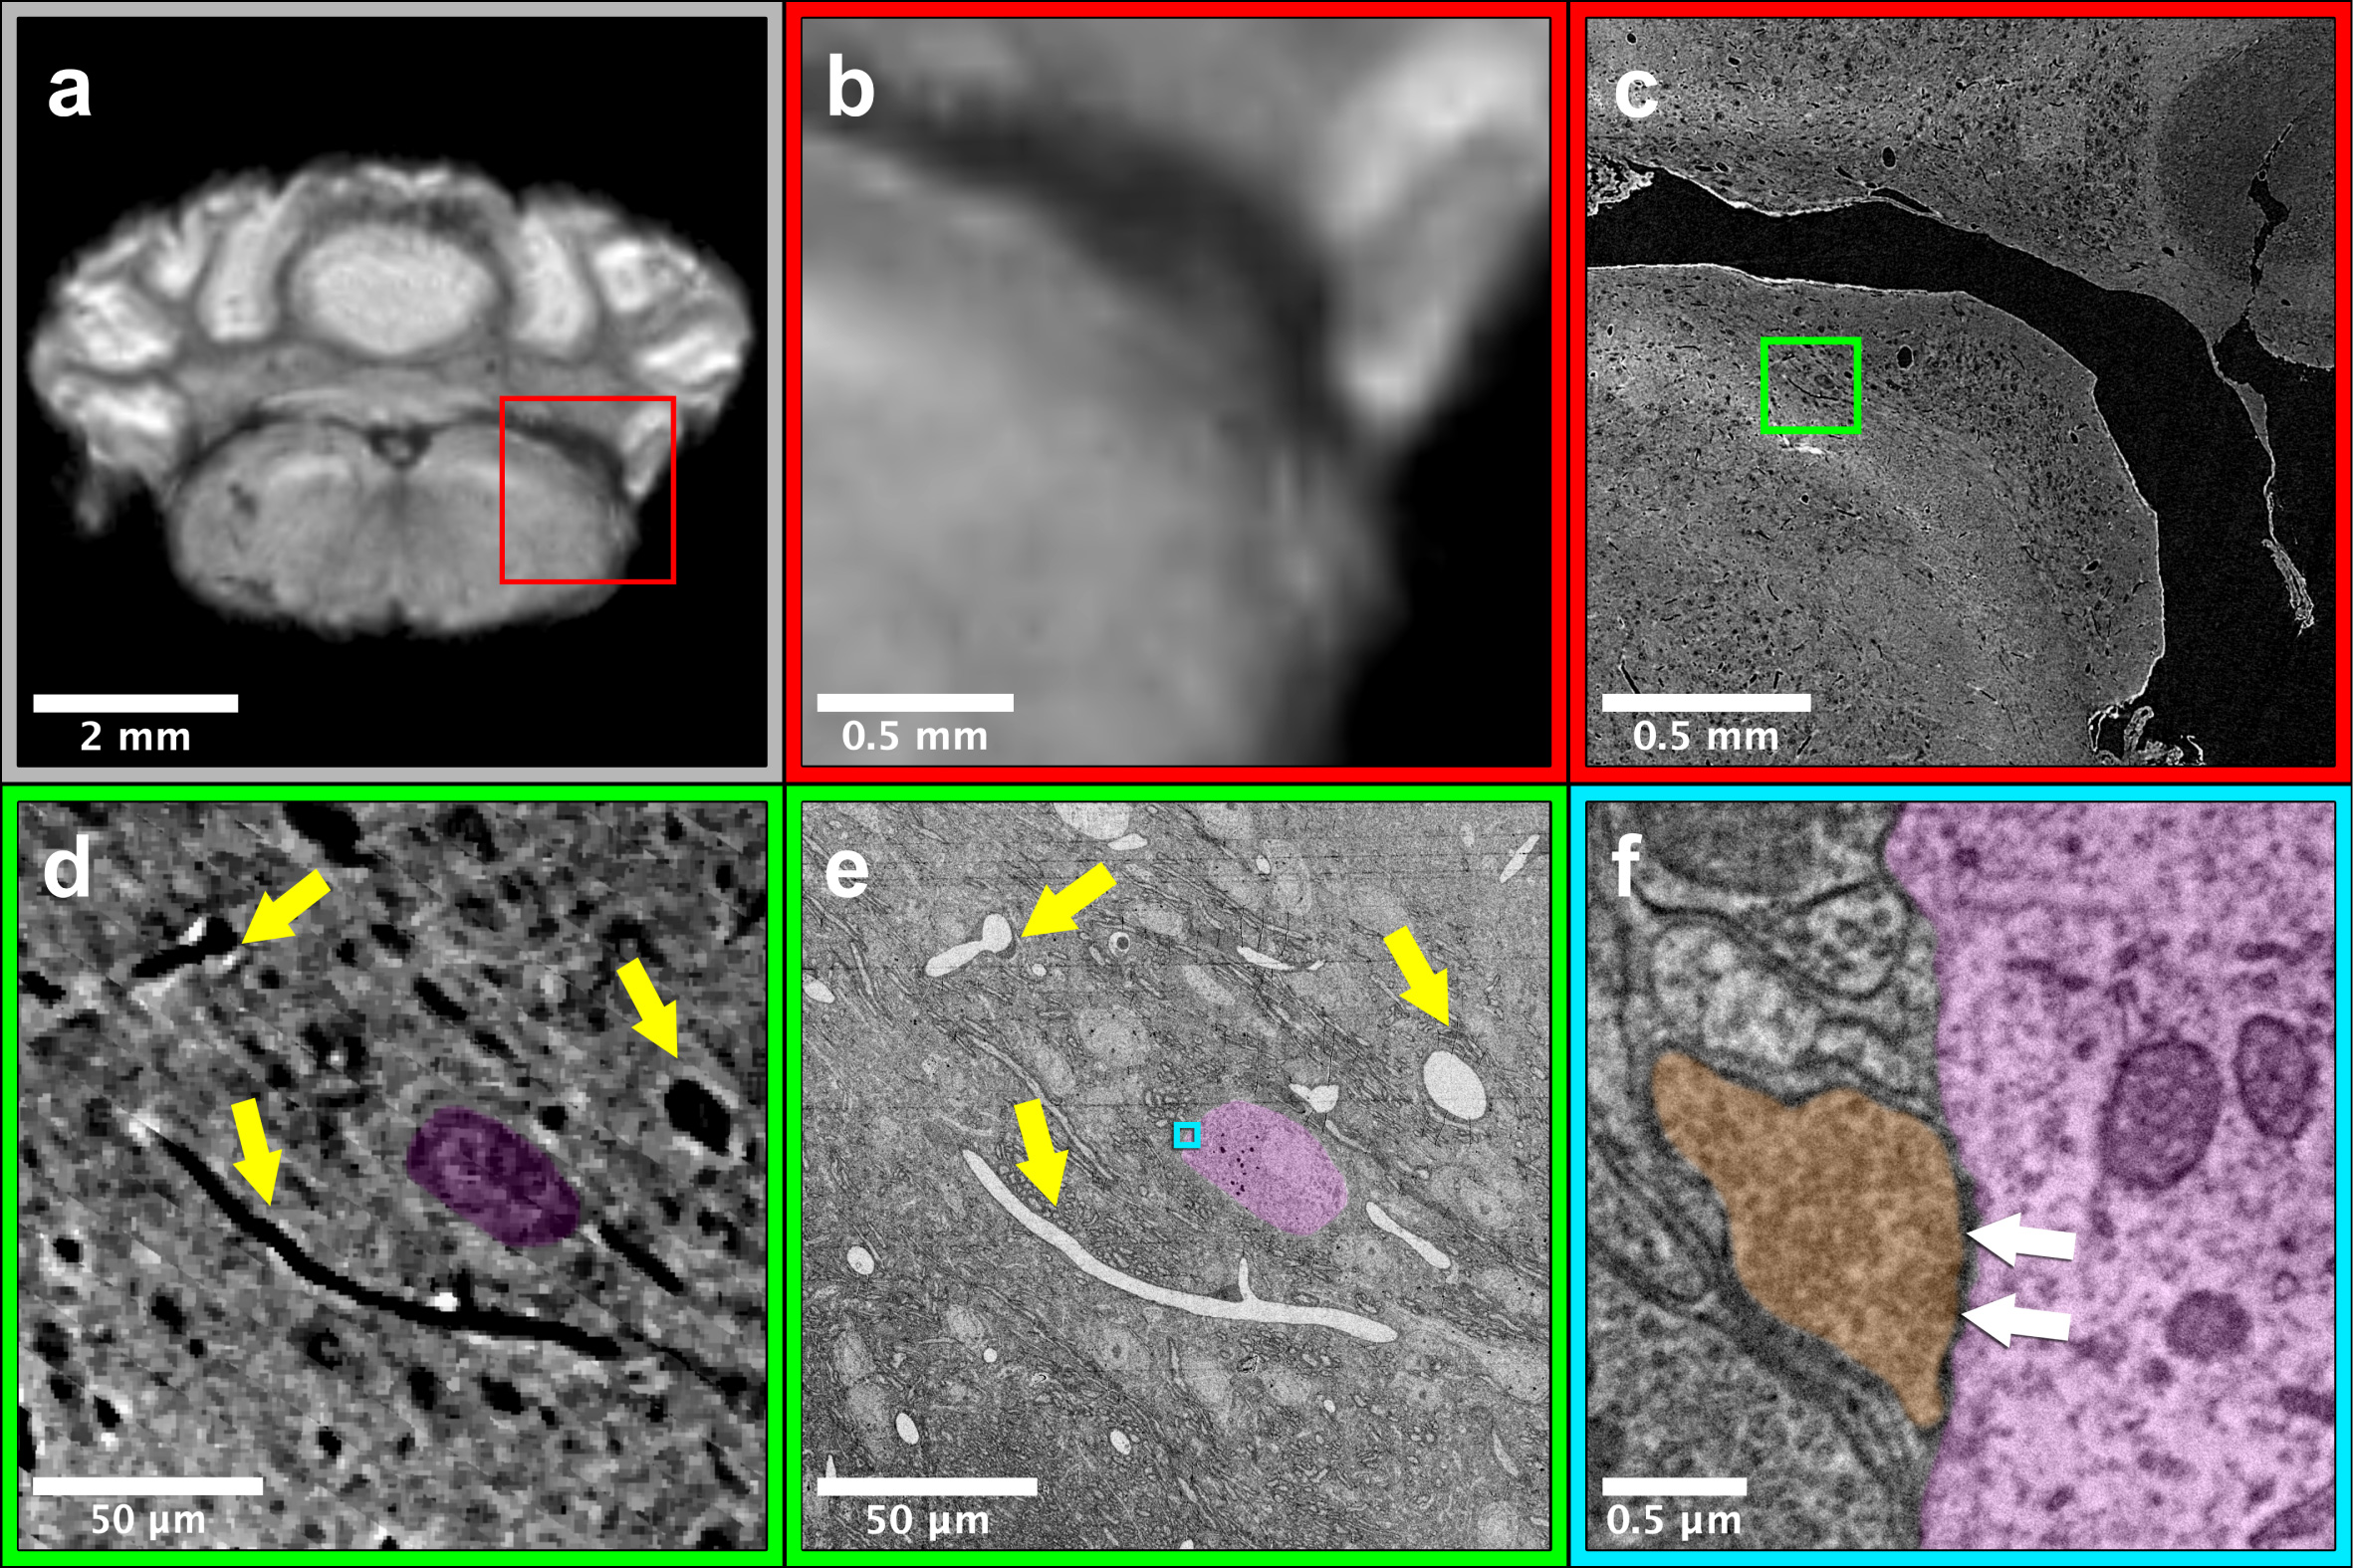
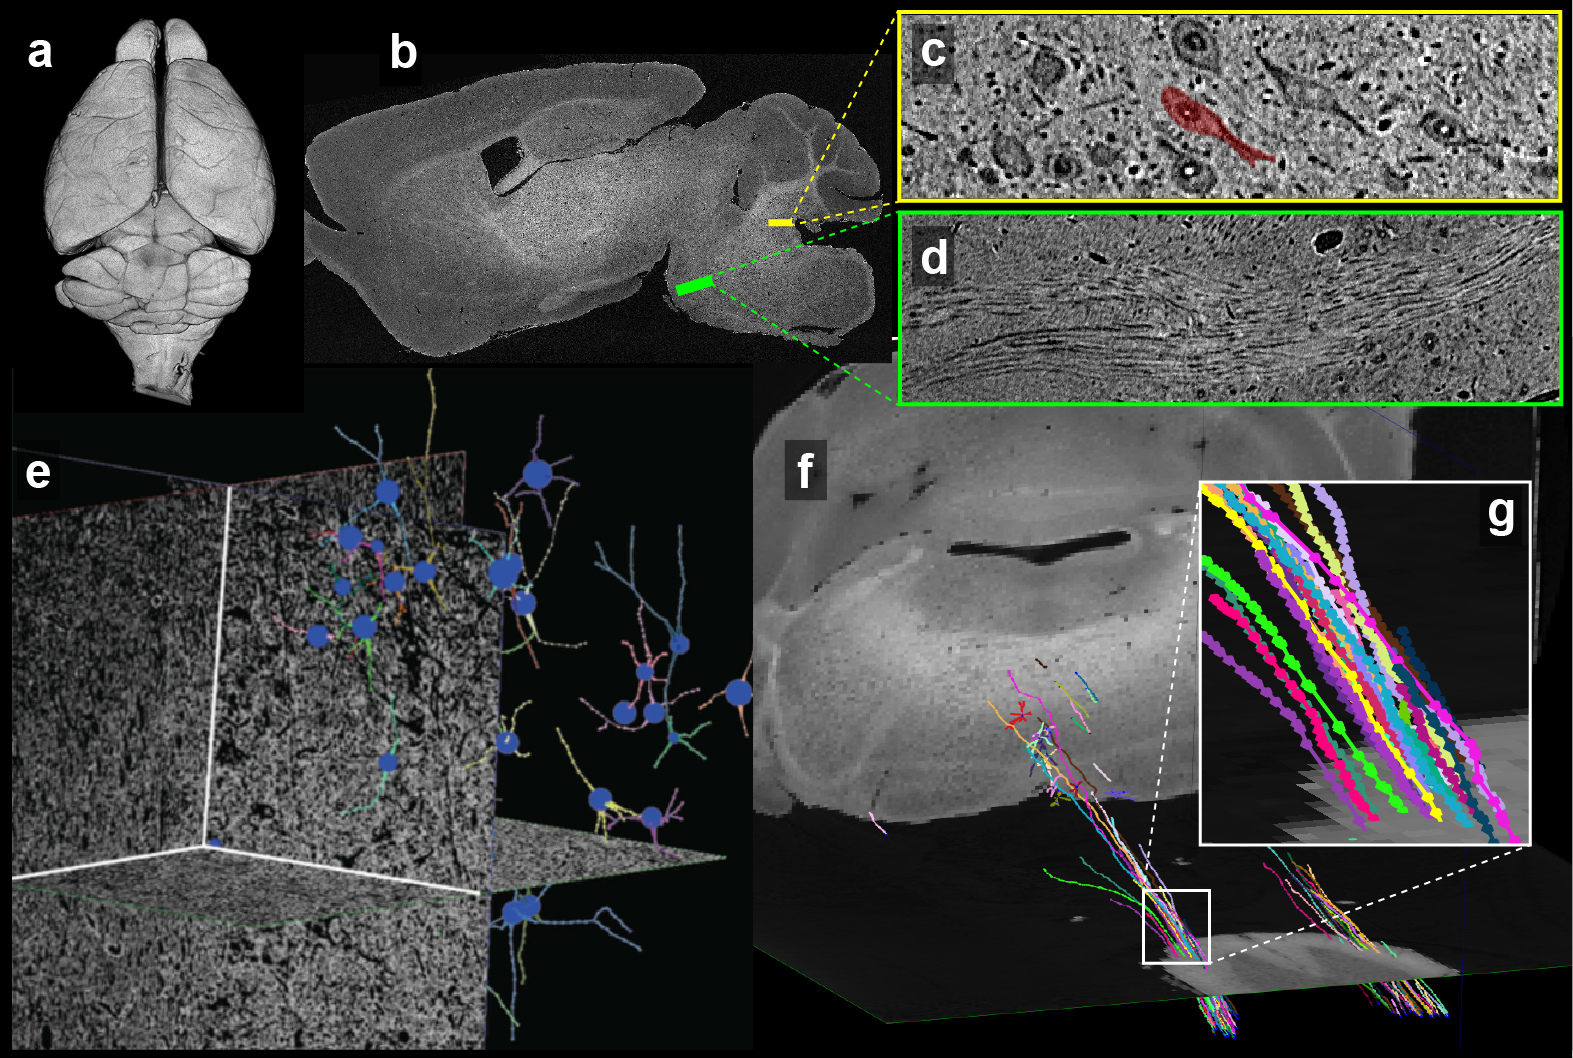
Figure 2 shows images from the same sample acquired from the three imaging modalitites. Results show similar regions with both (Fig 2a-b) 50mm MRI and 1.2mm (Fig. 2c) μCT. Using anatomic features (yellow arrows, Fig. 2d-e) to guide EM imaging, we found individual synapses (white arrows, Fig. 2f) on neuronal somas in the EM data.Reconstruction of the entire mouse brain with μCT is shown in Figure 3a. Data had sufficient resolution and contrast to capture both individual anatomic regions (Fig. 3b) as well as underlying brain-wide cytoarchitecture. For example, both neuronal somas (Fig. 3c) and long distance myelinated axon bundles (Fig. 3d) could be clearly visualized.
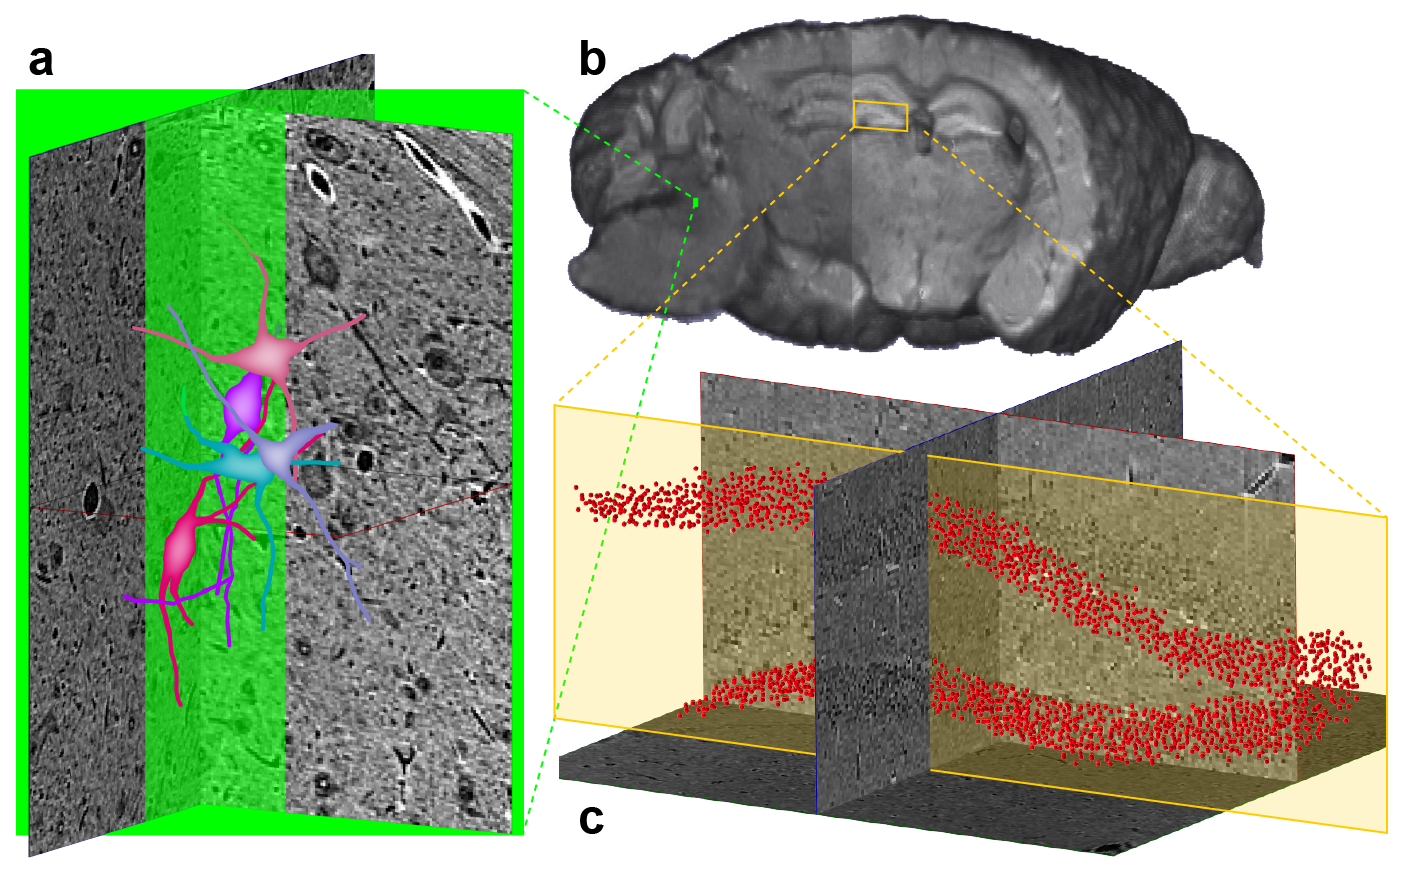
Since both MRI and μCT produce isotropic 3D renderings of whole volumes (Figs. 3a and 4b), this allowed for simple co-registration between the two datasets. Figure 4a shows 3D somas/dendrites traced from µCT data from the medial vestibular nucleus. Somas in the dentate gyrus of the hippocampus are visible in the μCT data (Fig. 4c). The high density of somas contributes to an anatomically dependent local variation in the MRI signal (yellow box, Fig. 4b).
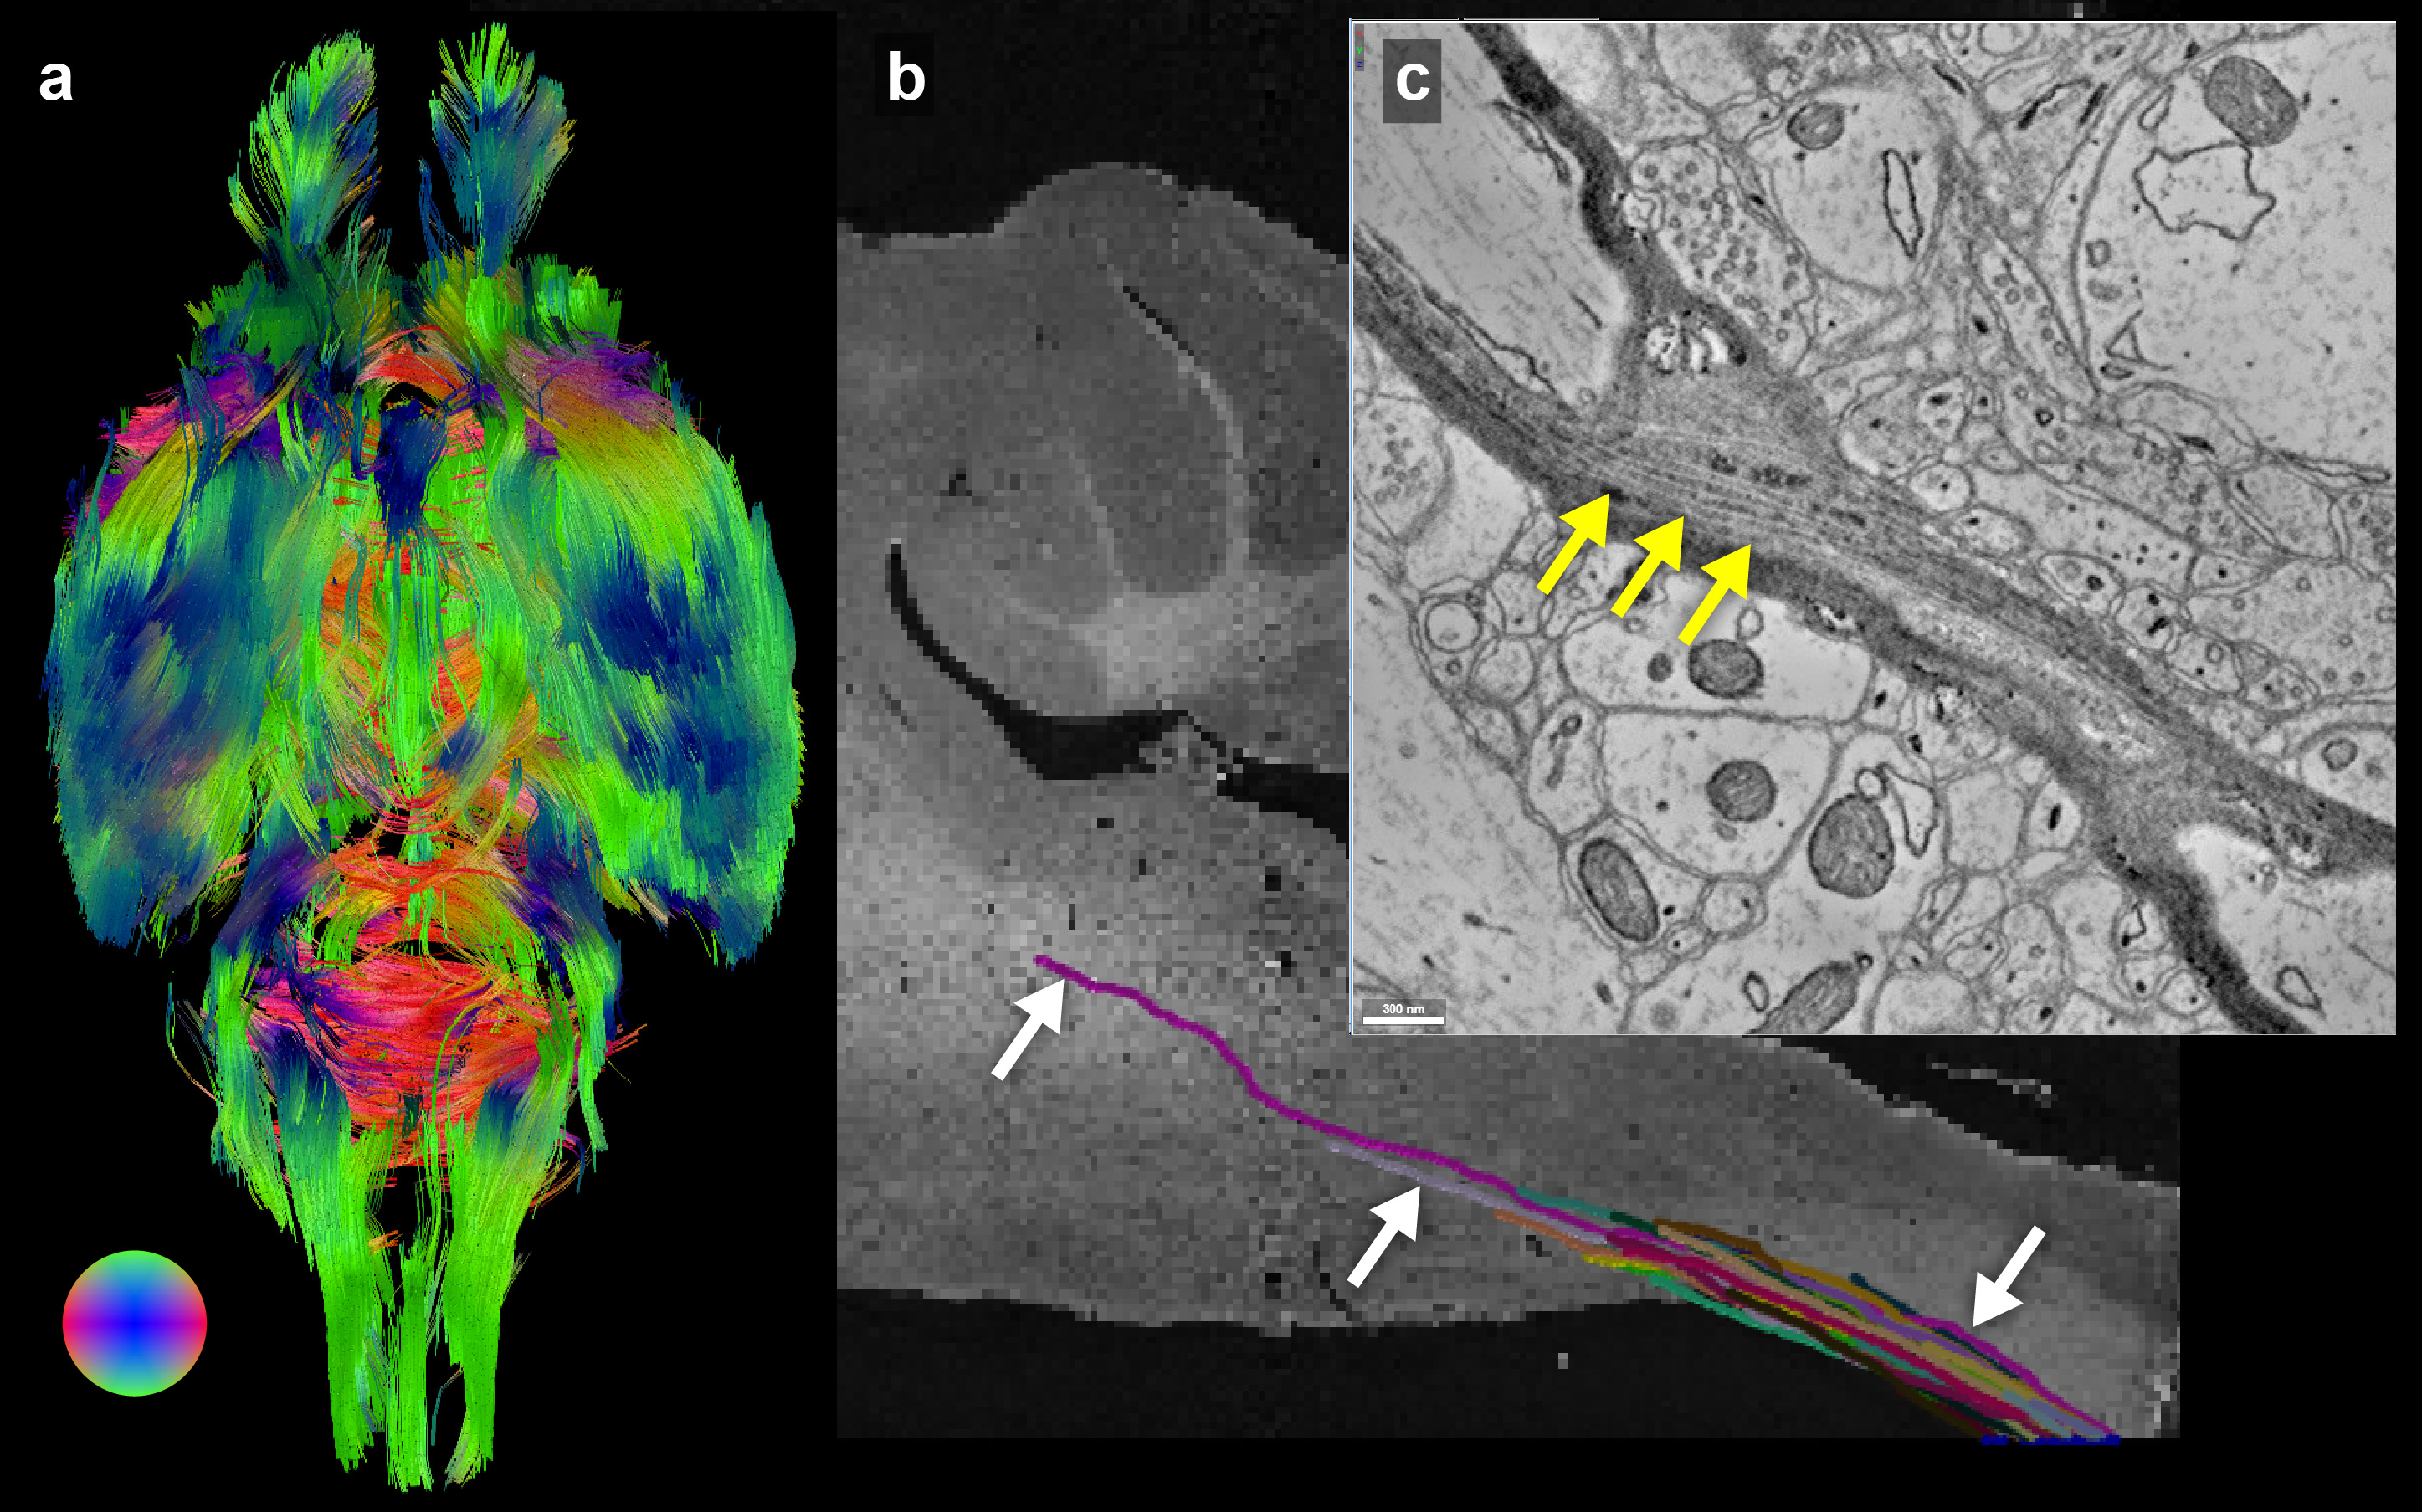
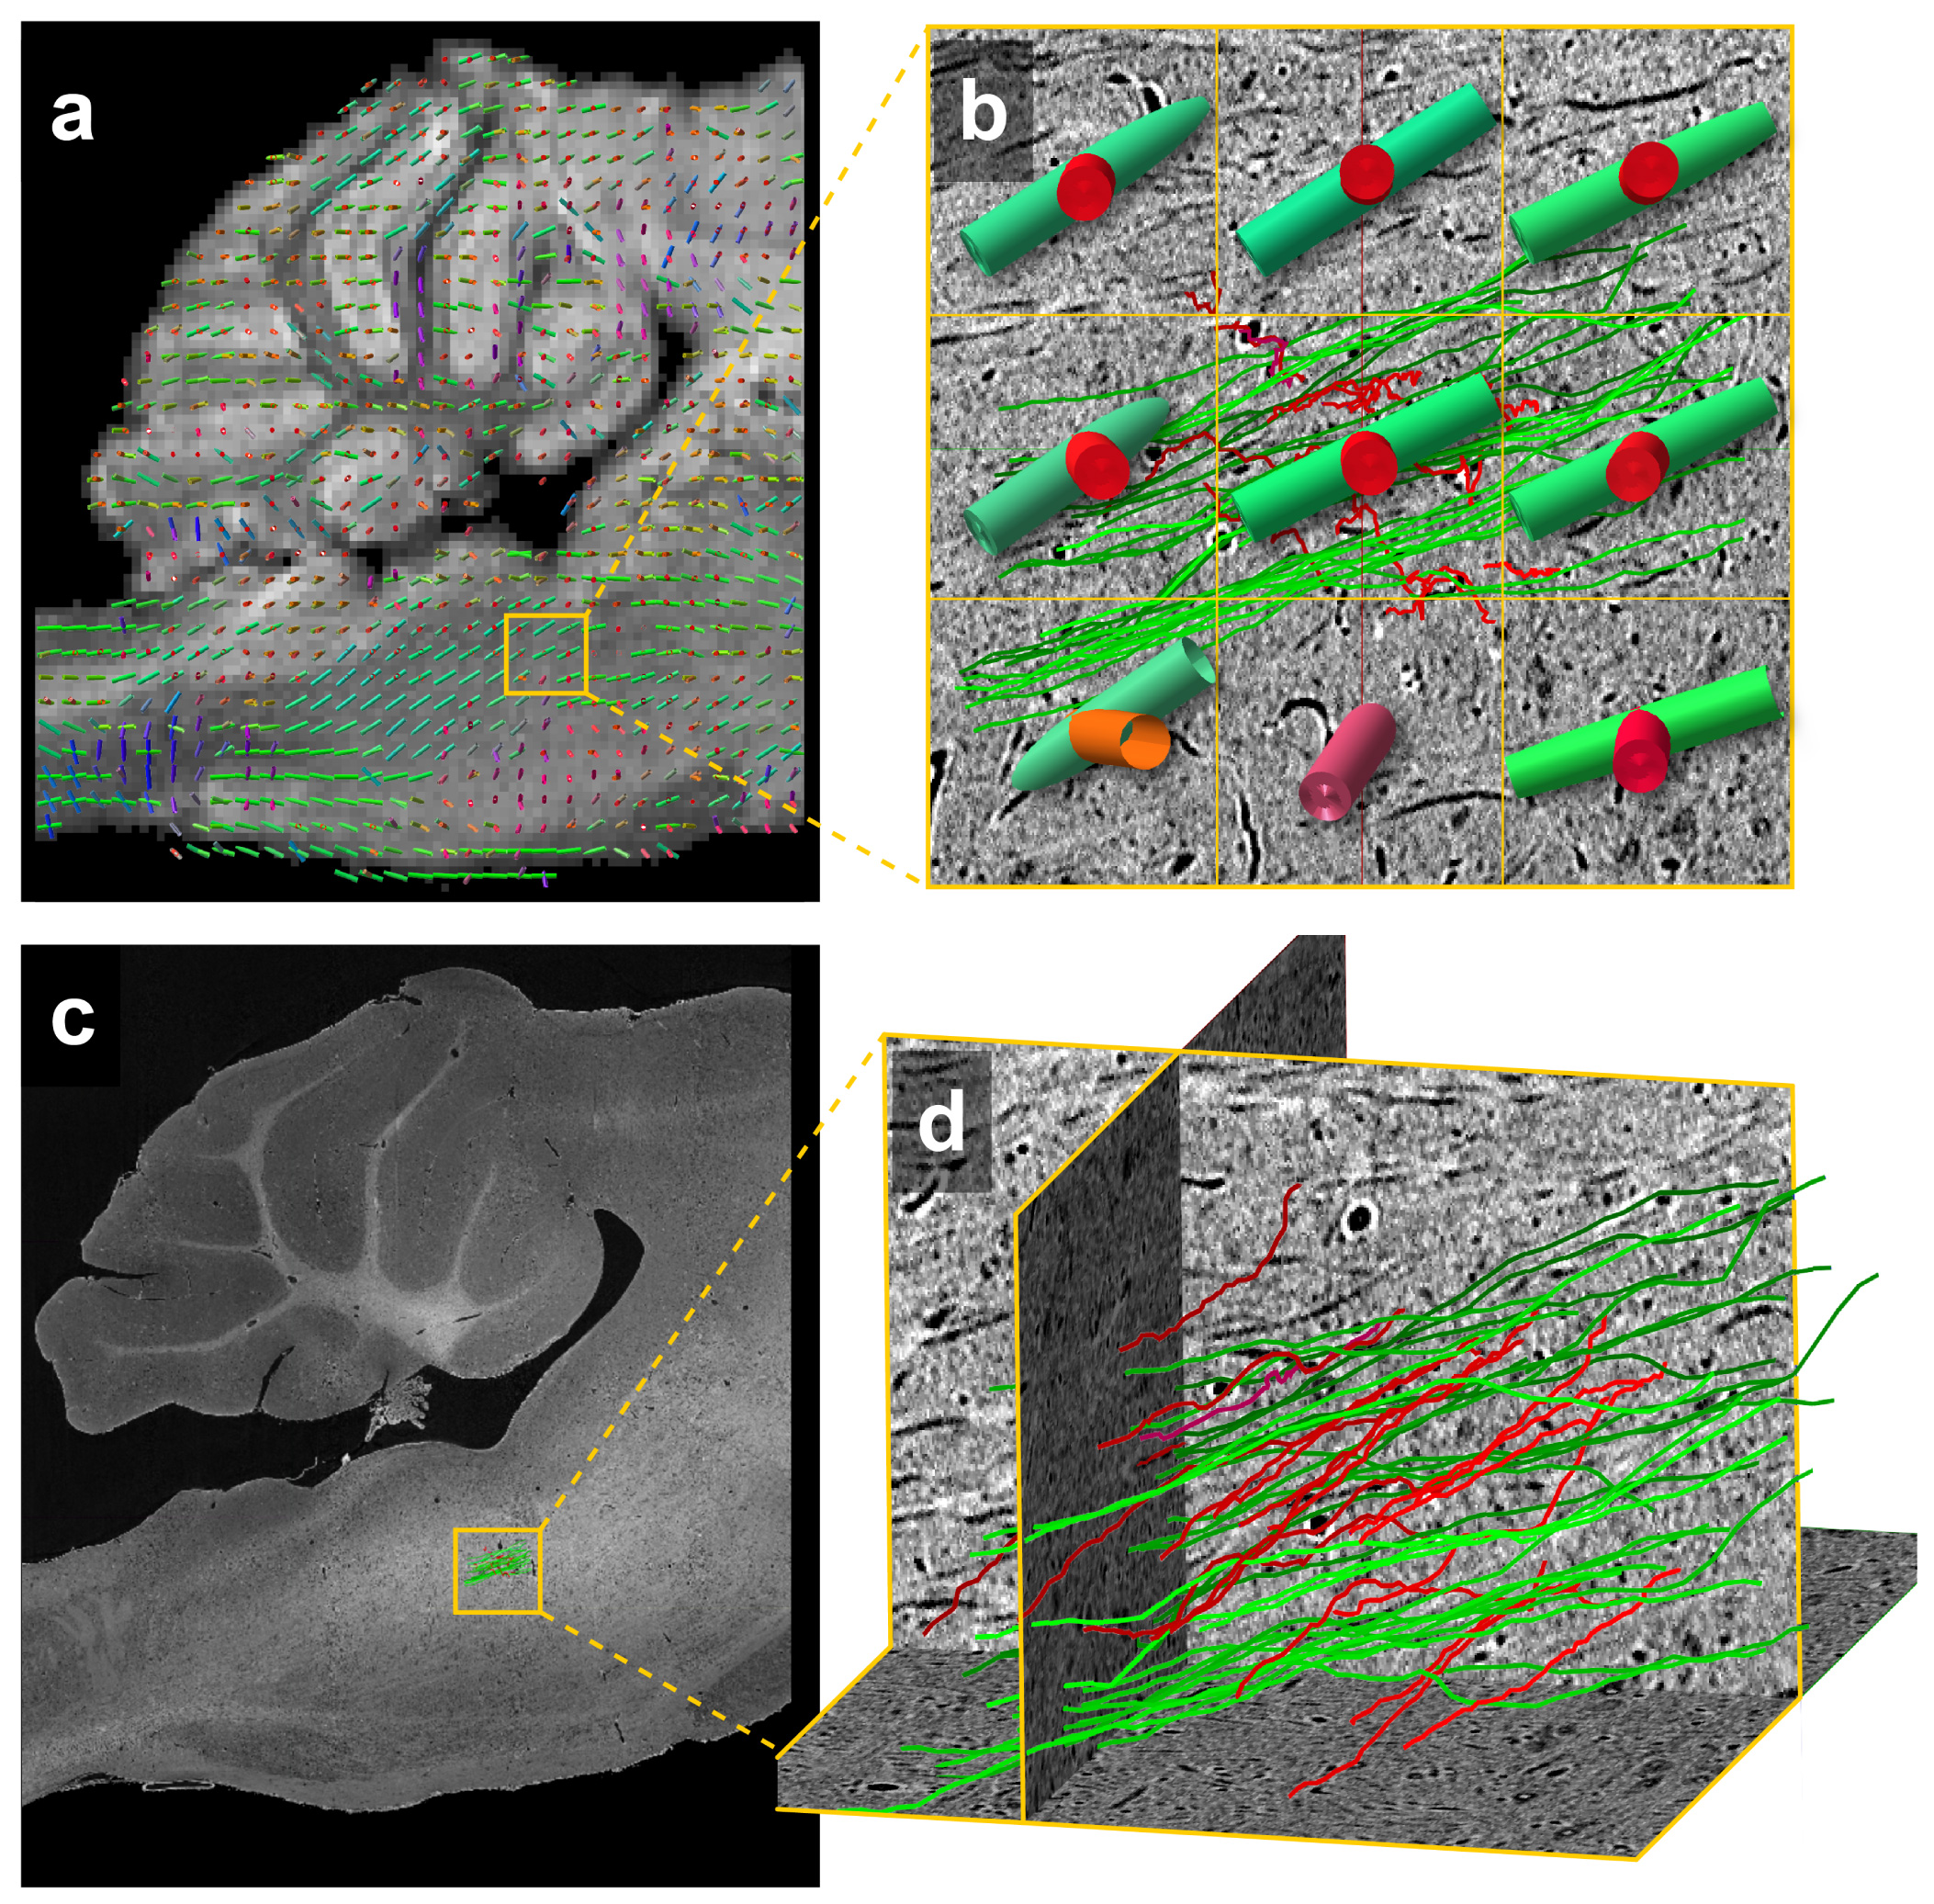
Figure 5 demonstrates estimates of fiber bundle orientations produced from MRI data with individually traced axons from μCT data. Overlain on the MRI structural scan are estimates of crossing fibers in each voxel (Fig. 5b). The individually traced axons from μCT were similarly color-coded for comparison (Fig. 5d). The yellow boxes in Figures 5a and c indicate the location of 9 MRI voxels in which 47 individual axons were traced in the µCT data.
Discussion
We describe a pipeline using three imaging modalities, providing unprecedented views across 5 orders of magnitude of resolution in a single mouse brain sample. This approach allows for potentially novel understandings and/or interpretations of results within each modality, currently constrained by scale-dependent differences in each individual approach.Because MRI contrast is explicitly sensitive to tissue water, regardless of tissue type, and osmium (the contrast stain for both μCT and EM) stains membranes of any type of cell in any type of tissue 14, this pipeline works on brains (or any other organ type) of any species.
Finally, in a single brain sample, our pipeline reveals the relative locations of nearly every soma, blood vessel, myelinated axon and synapse. Using μCT and EM to inform contrast variability in MRI data over entire brains would significantly narrow the search for pathological structural change and lead to improved specificity. This would also lead to potential in vivo MRI biomarkers of disease.
Acknowledgements
The authors thank Shawn Mikula for help with sample preparation for μCT and EM. N.K. and V.S. are supported from a Technical Innovation Award from the McKnight foundation, a Brain Initiative of the National Institutes of Health (U01 MH109100), and National Science Foundation Neuro Nex grant. P.LR. is partially supported by the National Institutes of Health (R01EB026300). S.T. is supported by the National Institute of Neurological Disorders and Stroke of the National Institutes of Health (F31NS113571). Additional funding supporting this work was provided by the National Institutes of Health (S10-OD025081, S10-RR021039, and P30-CA14599). This research used resources of the Advanced Photon Source, a U.S. Department of Energy (DOE) Office of Science User Facility operated for the DOE Office of Science by Argonne National Laboratory under Contract No. DE-AC02-06CH11357. This research also used resources of the Argonne Leadership Computing Facility, which is a DOE Office of Science User Facility supported under Contract DE-AC02-06CH11357.References
1. C. S.R., Textura del sistema nervioso del hombre y de los vertebrados. (Imprenta y Librería de Nicolás Moya Madrid., 1899).
2. J. Grutzendler, N. Kasthuri, W.B. Gan, "Long-term dendritic spine stability in the adult cortex," Nature 420, 812-816 (2002).
3. M. Helmstaedter, "Cellular-resolution connectomics: challenges of dense neural circuit reconstruction," Nature methods 10, 501 (2013).
4. K.E. Bouchard, J.B. Aimone, M. Chun, T. Dean, M. Denker, M. Diesmann, D.D. Donofrio, L.M. Frank, N. Kasthuri, C. Koch, "High-performance computing in neuroscience for data-driven discovery, integration, and dissemination," Neuron 92, 628-631 (2016).
5. E.L. Dyer, W. Gray Roncal, J.A. Prasad, H.L. Fernandes, D. Gursoy, V. De Andrade, K. Fezzaa, X. Xiao, J.T. Vogelstein, C. Jacobsen, K.P. Kording, N. Kasthuri, "Quantifying Mesoscale Neuroanatomy Using X-Ray Microtomography," eNeuro 42017).
6. R. Vescovi, M. Du, V. de Andrade, W. Scullin, D. Gursoy, C. Jacobsen, "Tomosaic: efficient acquisition and reconstruction of teravoxel tomography data using limited-size synchrotron X-ray beams," J Synchrotron Radiat 25, 1478-1489 (2018).
7. N. Kasthuri, K.J. Hayworth, D.R. Berger, R.L. Schalek, J.A. Conchello, S. Knowles-Barley, D. Lee, A. Vazquez-Reina, V. Kaynig, T.R. Jones, M. Roberts, J.L. Morgan, J.C. Tapia, H.S. Seung, W.G. Roncal, J.T. Vogelstein, R. Burns, D.L. Sussman, C.E. Priebe, H. Pfister, J.W. Lichtman, "Saturated Reconstruction of a Volume of Neocortex," Cell 162, 648-661 (2015).
8. S. Mikula, J. Binding, W. Denk, "Staining and embedding the whole mouse brain for electron microscopy," Nat Methods 9, 1198-1201 (2012).
9. S. Mikula, W. Denk, "High-resolution whole-brain staining for electron microscopic circuit reconstruction," Nat Methods 12, 541-546 (2015).
10. S. Foxley, M. Domowicz, G.S. Karczmar, N. Schwartz, "3D high spectral and spatial resolution imaging of ex vivo mouse brain," Medical physics 42, 1463-1472 (2015).
11. M. Jenkinson, S. Smith, "A global optimisation method for robust affine registration of brain images," Medical image analysis 5, 143-156 (2001).
12. T.E. Behrens, M.W. Woolrich, M. Jenkinson, H. Johansen-Berg, R.G. Nunes, S. Clare, P.M. Matthews, J.M. Brady, S.M. Smith, "Characterization and propagation of uncertainty in diffusion-weighted MR imaging," Magnetic resonance in medicine 50, 1077-1088 (2003).
13. M. Helmstaedter, K.L. Briggman, W. Denk, "High-accuracy neurite reconstruction for high-throughput neuroanatomy," Nat Neurosci 14, 1081-1088 (2011).
14. S.L. Palay, G.-R.S. Mc, S. Gordon, Jr., M.A. Grillo, "Fixation of neural tissues for electron microscopy by perfusion with solutions of osmium tetroxide," J Cell Biol 12, 385-410 (1962).
Figures