0288
T2* of human brain metabolites estimated from a single proton MRS acquisition
Chloé Najac1, Marjolein Bulk1, Hermien E. Kan1, Andrew G. Webb1, and Itamar Ronen1
1C.J. Gorter Center for High Field MRI, Department of Radiology, Leiden University Medical Center, Leiden, Netherlands
1C.J. Gorter Center for High Field MRI, Department of Radiology, Leiden University Medical Center, Leiden, Netherlands
Synopsis
We propose a method to calculate T2* values of brain metabolites from a series of time-shifted datasets obtained from a single 1H magnetic resonance spectroscopy acquisition. T2* values from five brain metabolites were measured in the posterior cingulate cortex. Robust T2* values were obtained for all five metabolites, including J-coupled metabolites such as glutamate and myo-inositol, for which T2* estimation is otherwise not possible. We show in a subsequent reproducibility study that the water linewidth within the same volume can be used to account for variability in local B0 inhomogeneity and reduce the associated variability across measurements.
Introduction
R2* is a sensitive marker for iron accumulation in the brain, and changes in T2*-weighted contrast have been reported in several neurodegenerative diseases1,2,3. Iron accumulation in disease can also be cell-type specific3,4. Magnetic resonance spectroscopy (MRS) offers the unique ability to investigate cell-specific properties that affect the MR signal. While water is ubiquitous in tissue, brain metabolites are almost exclusively found in the intracellular space and are preferential to cell types5,6. Metabolite T2* could therefore reflect cell-type specific susceptibility changes in brain disorders, such as activation of glial cells associated with iron accumulation4. While the linewidth (FWHM) of a single resonance (i.e. creatine peak at 3.0ppm) can be used to estimate its T2*, the estimation of T2* for J-coupled systems (such as glutamate (Glu) and myo-inositol (Ins)) requires a more sophisticated approach. We propose a method that uses a single MRS acquisition to generate a set of time-shifted free induction decays (FIDs) from which metabolite T2* is estimated (fig.1). We measured T2* of five brain metabolites in a cohort of ten healthy volunteers, and studied reproducibility in three healthy volunteers.Materials and methods
Experiments were conducted on a 7T whole-body MRI scanner (Philips Healthcare, The Netherlands) equipped with a volume transmit/32-channel receive head coil (Nova Medical, USA).Data acquisition: In all experiments, 3D-T1W gradient-echo images (TR/TE=5/2ms, resolution=1x1x1mm3) were used for planning, and an 8mL volume-of-interest was positioned in the posterior cingulate cortex (PCC, fig.2) for the MRS experiment.
Cross-sectional study: Data were acquired in 10 heathy subjects (6F/4M) as part of data collection for the EUFIND consortium7. Metabolite and water spectra were acquired using sLASER (TR/TE=8000ms/34ms, NSA=32).
Reproducibility assessment: Repeated data were collected from 3 heathy subjects (1F/2M, nsubject1=6/ nsubject2=4/nsubject3=5). Metabolite and water spectra were acquired from the same location in the PCC with sLASER (TR/TE=6000ms/29ms, NSA=48) with different shim settings on different days.
T2* calculation: The process is illustrated in fig.1. A set of FIDs with different time-shifts was generated by progressively discarding the first points of the originally acquired FID. Seven spectra were thus generated, with shift values between 0ms and 30ms in 5ms intervals. The resulting spectra were quantified using LCModel8. A basis-set was simulated for each time-shift, accounting for any J-evolution and the first-order phase variation across the spectrum induced by the time-shift. To estimate metabolite T2*, a linear regression was performed to fit the logarithm of the metabolite signal as a function of the time-shift. The water and total creatine (tCr) resonance linewidths (FWHMwater/FWHMtCr) were measured with an in-house Matlab® linear prediction and singular value decomposition (LPSVD) routine.
Statistical analysis: Statistical significance was tested using GraphPad Prism 7 (GraphPad Software, USA) using a paired Student’s t-test.
Results and discussion
The LCModel fits to the time-shifted data were excellent for five brain metabolites (N-acetyl-aspartate (NAA), Glu, Ins, total choline (tCho) and tCr, fig.1B), showing that the basis-sets fully accounted for any J-evolution and first-order phase evolution caused by the time-shift.In our cross-sectional experiment, the shim was relatively constant (FWHMwater~10.2-11.5Hz), LCModel Cramer-Rao lower bounds for all metabolites and all time-shifts < 15, and the variance in metabolite T2* values across subjects was low. As illustrated in fig.2B/C, the ln(tCr) decreased linearly with time-shift (R2=0.98, p<0.0001) and the FWHMtCr estimated from the T2* value was linearly correlated with the one measured with LPSVD (R2=0.89, p<0.0001). This suggests that T2* of brain metabolites can be reliably obtained in a simple manner with similar shim values across subjects. As shown in fig.3A, the linear regression of the ln(metabolite signal) with respect to the time-shift was also highly significant for all other metabolites (R2>0.89, p<0.001). These tight fits to a mono-exponential T2*, together with small variations in B0 homogeneity resulted in significant differences in T2* across metabolites (fig.3B). These differences can be attributed to a combination of intrinsic T2 differences across metabolites9 and local susceptibility differences across cell types.
In the reproducibility study, we intentionally introduced a larger range of shim values across measurements, resulting in FWHMwater values between 10 and 15Hz. Differences in B0 homogeneity strongly affected the variance in T2* estimates within subjects (fig.4A). Strong correlation between metabolite and water T2* (fig.4B) suggested that the FWHMwater could be used to account for some of the variance introduced by differences in B0 homogeneity. Fig.4C shows the T2* values of the same metabolites normalized by the water T2*. The variance of normalized metabolite T2* values within subject significantly decreased (fig.4D).
Conclusion
We showed that the T2* of brain metabolites can be reliably obtained in a simple manner from a set of time-shifted FIDs originating from a single MRS dataset. With constant shim values across subjects, T2* values were significantly different across metabolites within a small cohort. As shown in our reproducibility study, normalization to FWHMwater can be partly used to account for the variance of T2* values due to shim differences across acquisitions. However, since the FWHMwater depends also on local tissue susceptibility, we are investigating the possibility of using B0 maps to account exclusively for shim differences. We envision a variety of applications for this method, including studying cell-specific changes in T2* in disease and assessing the BOLD effect on metabolite T2* during a functional task10.Acknowledgements
This project has received funding from the Leiden University Fund (W-19356-2-32), and LEaDing Fellows COFUND programme. We thank Drs. D. Deelchand and P.G. Henry from Center of Magnetic Resonance Research at University of Minnesota (USA) and Dr. Julien Valette at Atomic Energy and Alternative Energies Commission in Paris (France) for sharing their Matlab programs to create LCModel basis-sets. We thank the European Ultrahigh-Field Imaging Network for Neurodegenerative Diseases (EUFIND) for letting us use the MRS data we acquired for the consortium.References
[1] S. Rooden et al., Alzheimers Dement. (2014); [2] J.M.G. van Bergen et al., Am. J. Neuroradiol. (2016); [3] M. Bulk et al., Neuroimage Clin. (2020); [4] K.M. Gillen et al., Front Immunol. (2018); [5] Urenjak et al., J. Neurosci. (1993); [6] Choi et al., NMR Biomed. (2007); [7] E. Düzel et al., J. DADM. (2019); [8] Provencher et al., MRM (1993); [9] M. Malgorzata et al. NMR Biomed. (2012); [10] Bednařík et al., J. Cereb. Blood Flow Metab. (2015)Figures
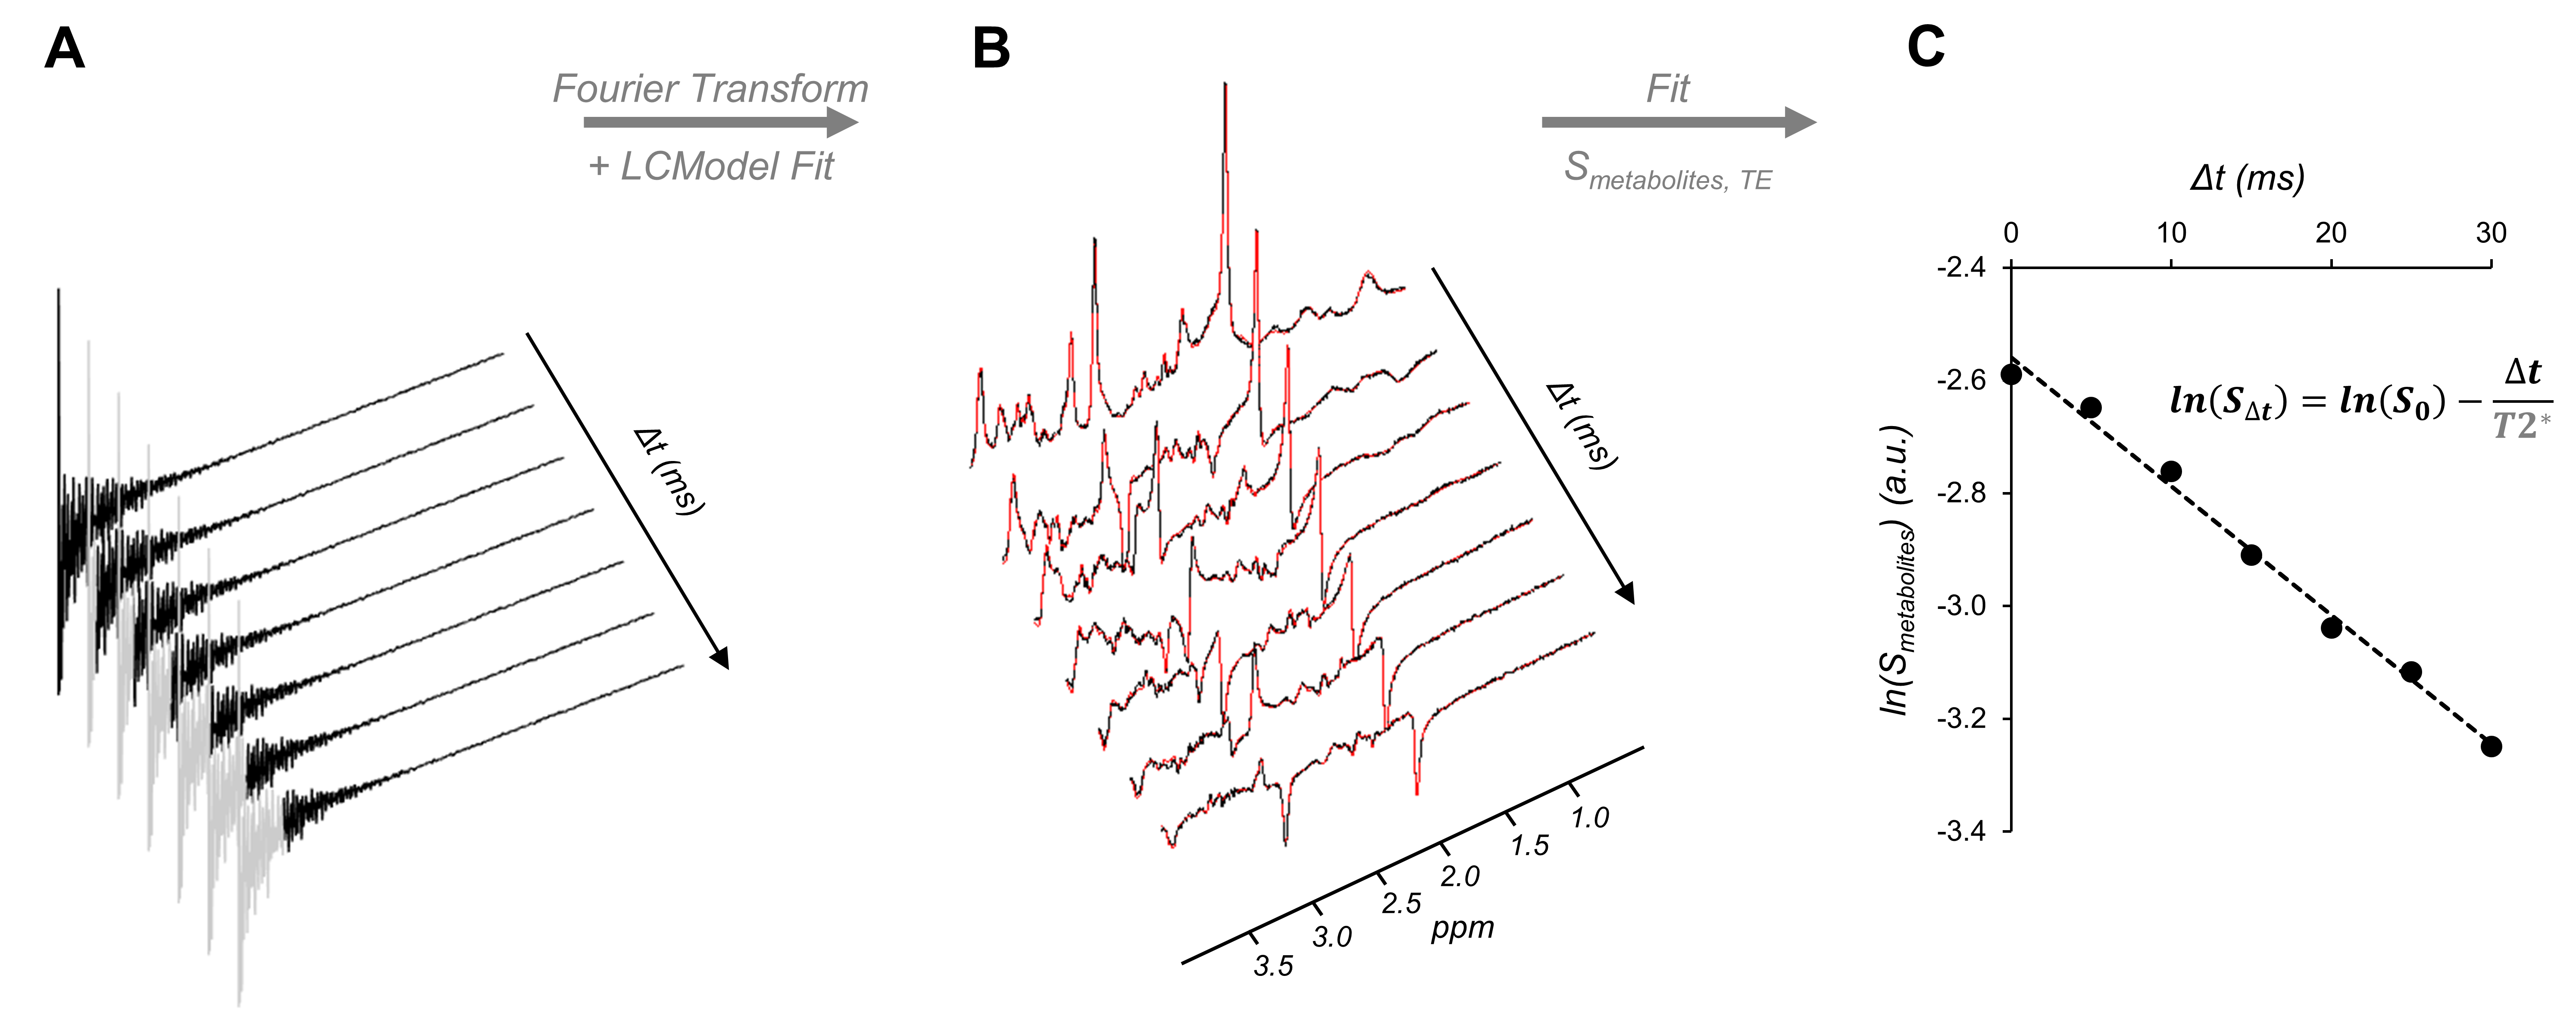
Figure 1:
Illustration of the T2* calculation procedure. (A) A set of FIDs with different time-shifts (Δt)
was generated (shift between 0ms and 30ms in 5ms interval) by
progressively discarding the first points (represented in grey) of the originally
acquired FID. (B) FIDs were Fourier transformed (spectra shown in black) and
fitted with LCModel (fits shown in red). A basis-set was generated using a Matlab® routine
for each Δt. (C) A linear regression was used to fit the logarithm of
the signal of five brain metabolites as a function of Δt. T2* values
were estimated as -1/slope of the fit.
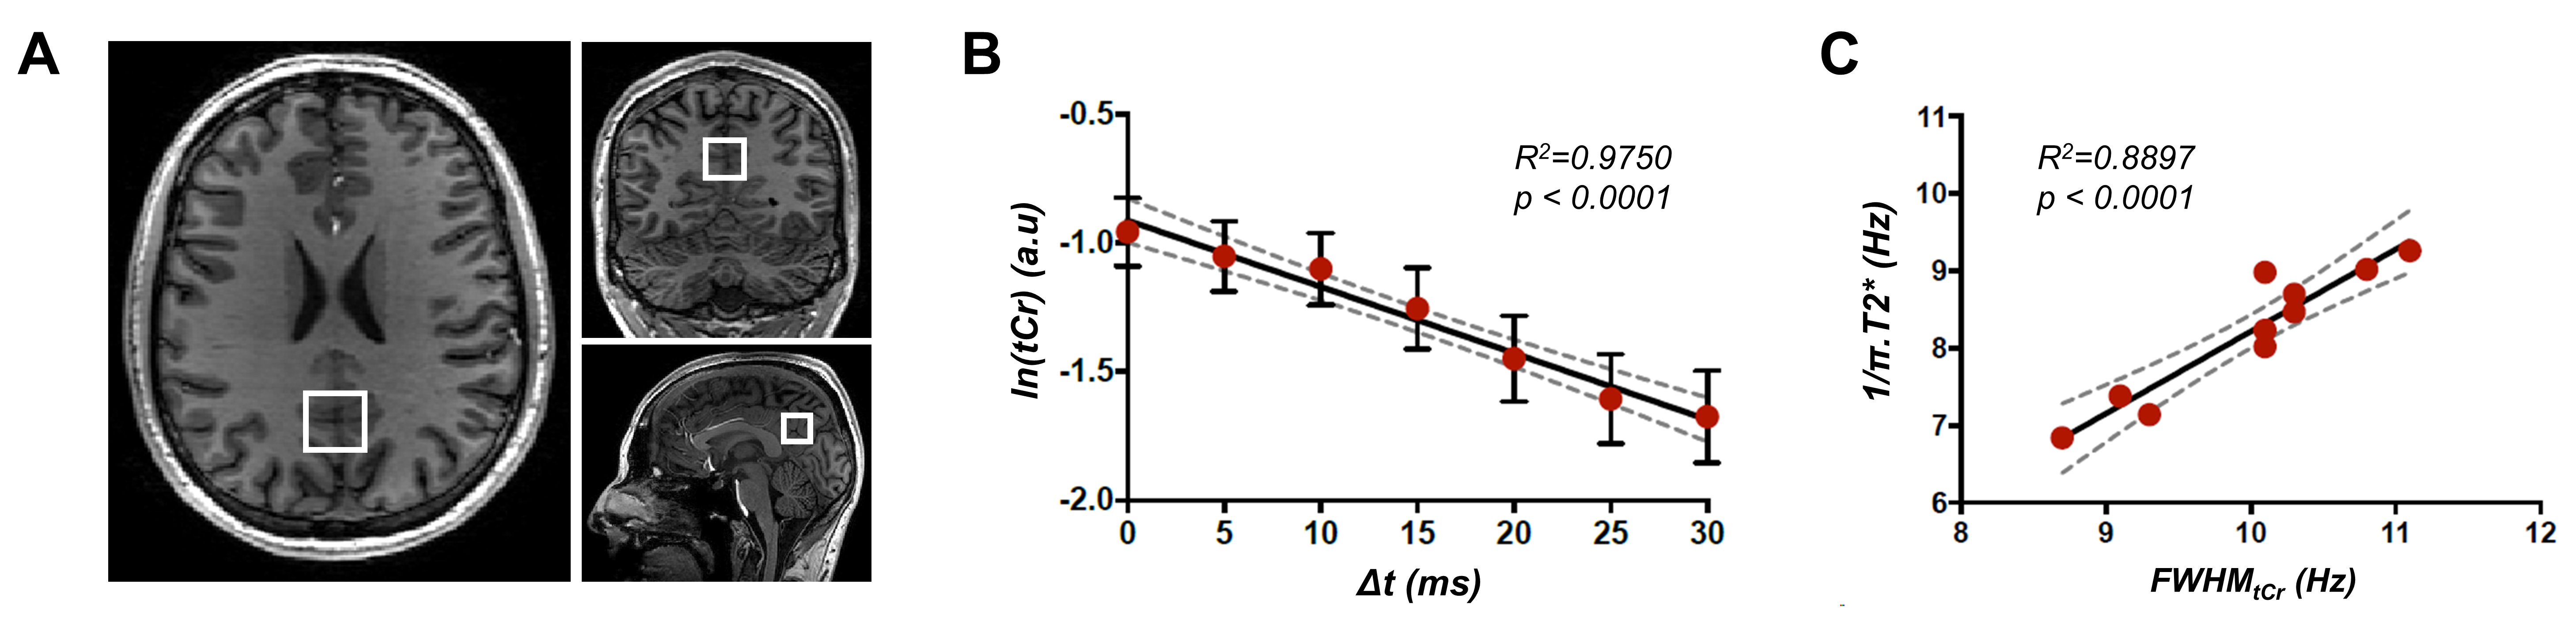
Figure 2: (A) Positioning of the volume-of-interest on anatomical 3D-T1W images in the posterior cingulate cortex
region. (B) Logarithm of the signal of tCr was quantified at all time-shifts (Δt) and
fitted with a linear regression. The data (red circle) and fit (black line) for
the mean over all participants is illustrated. The error bars represent the
standard deviation over subjects. (C) The correlation between the FWHMtCr
estimated from T2* values and measured with LPSVD is shown. The dashed grey
line indicates the 95% confidence interval.
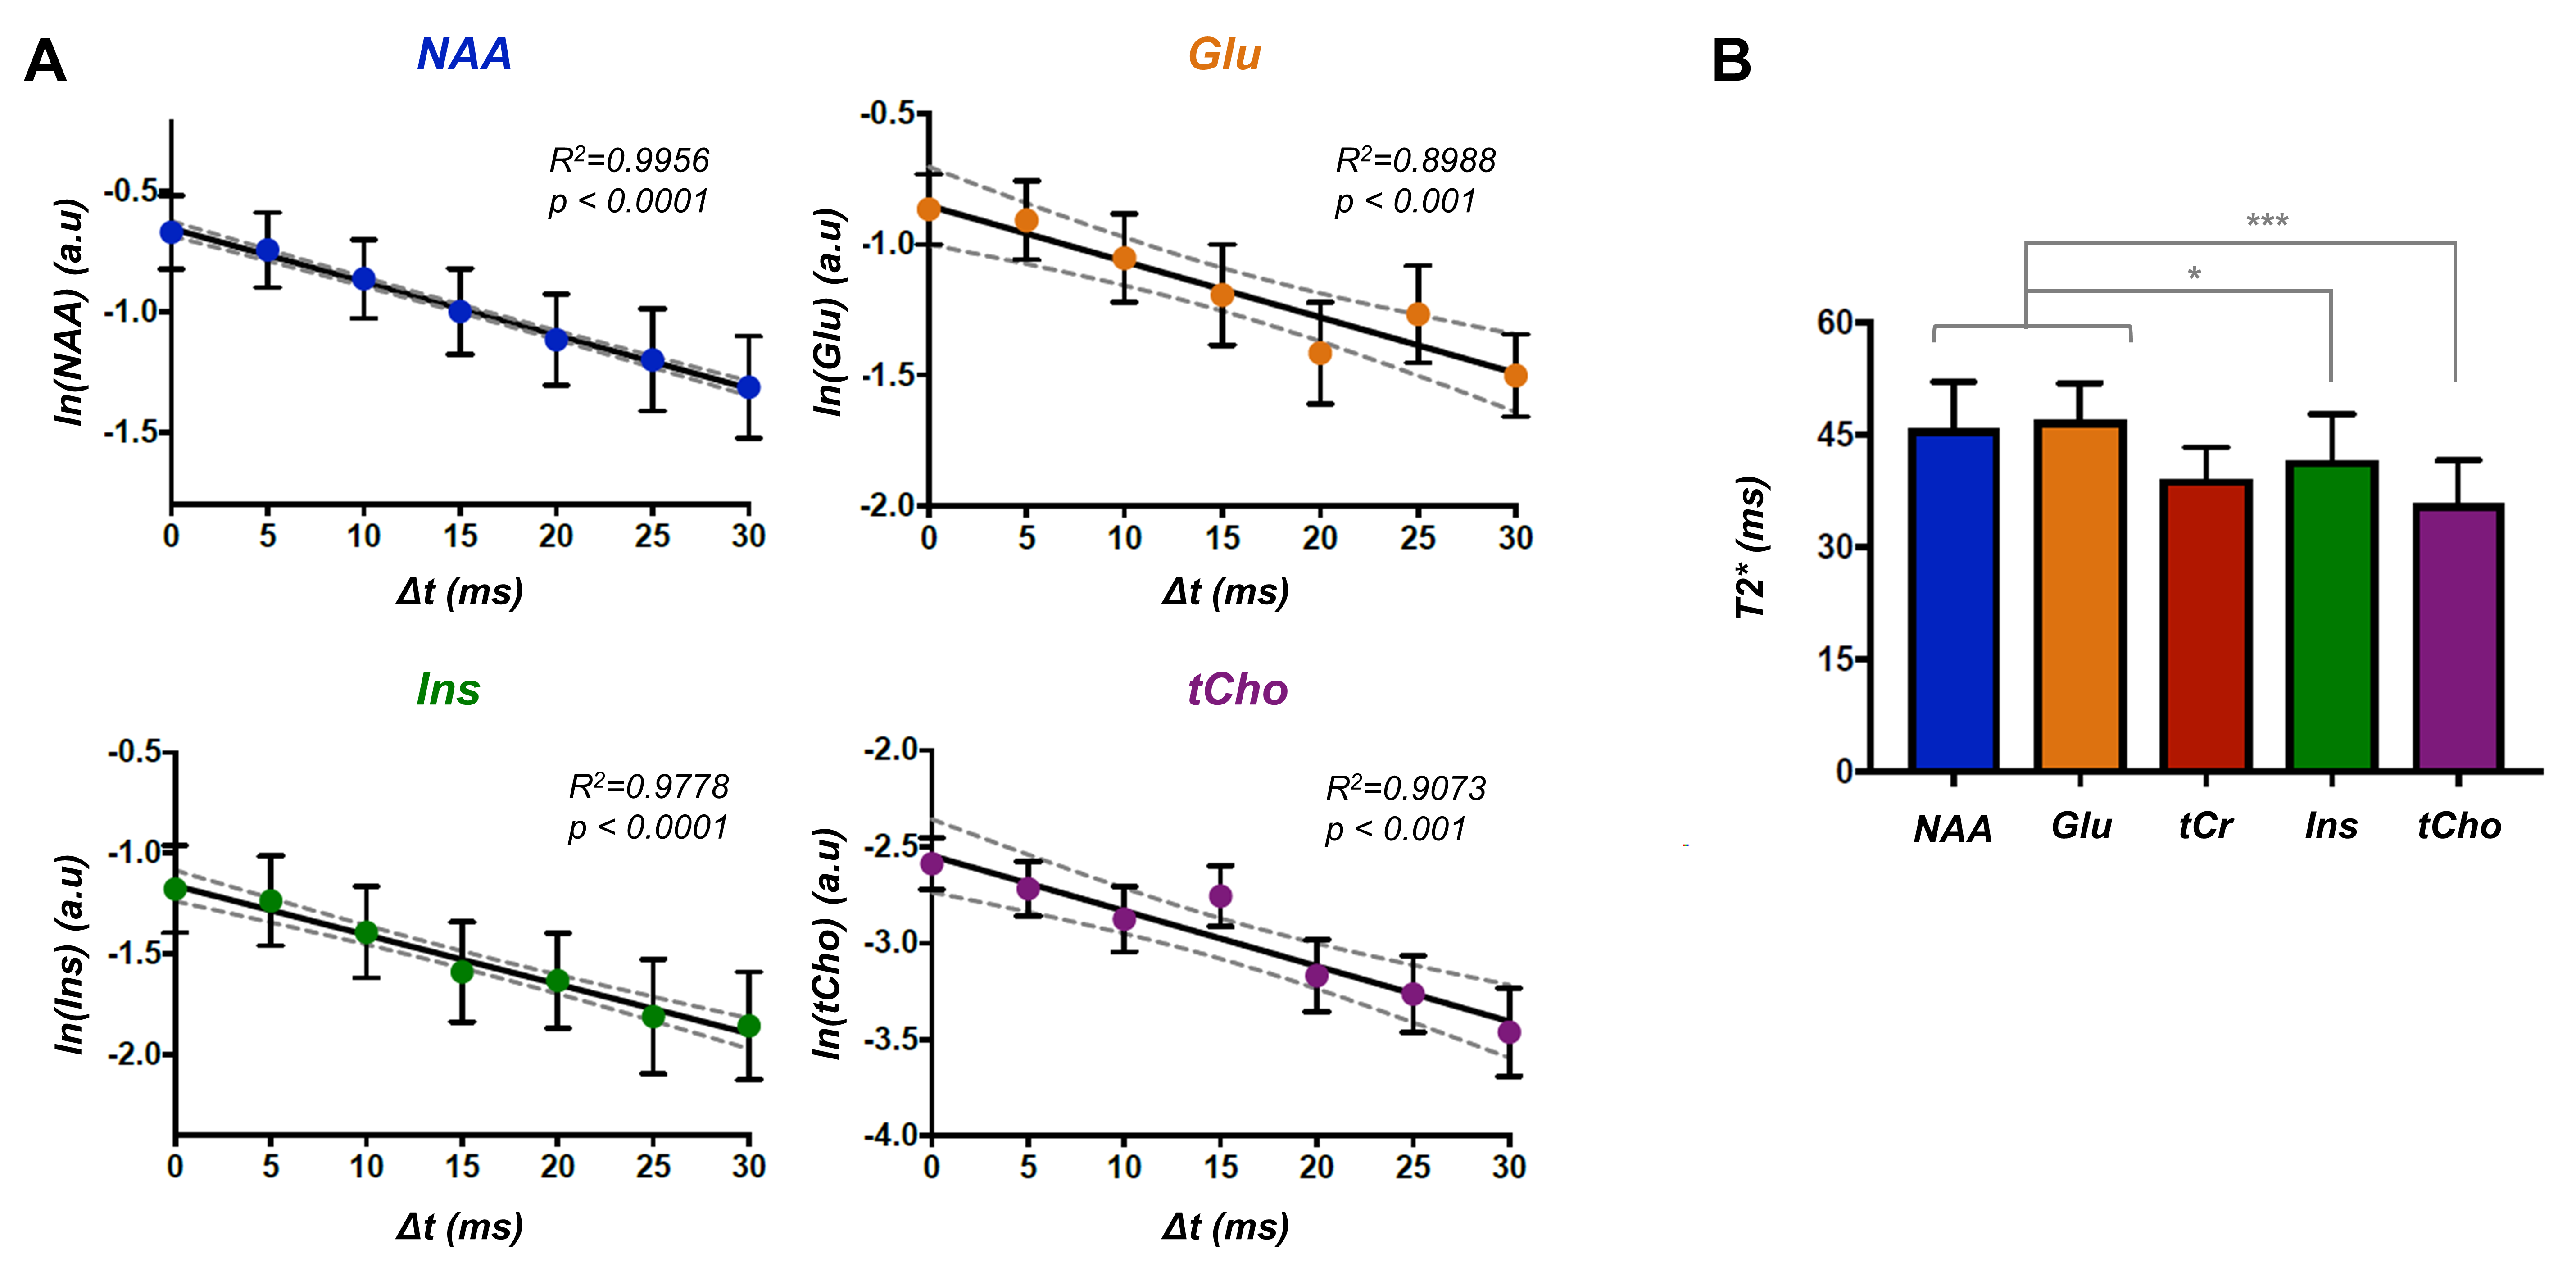
Figure 3: (A) Logarithm of the signal of metabolites was quantified at all
time-shifts (Δt)
and fitted with a linear regression. The data (circle) and fit (black line) for
the mean over all participants is shown. The error bars represent the standard
deviation over subjects and the dashed grey line indicates the 95% confidence
interval. (B) T2* values of five brain metabolites are shown, suggesting lower
values in astrocytes cells. Paired Student’s t-test was used to estimate
differences (*p< 0.05, ***p< 0.001). The error bars
represent the standard deviation over subjects.
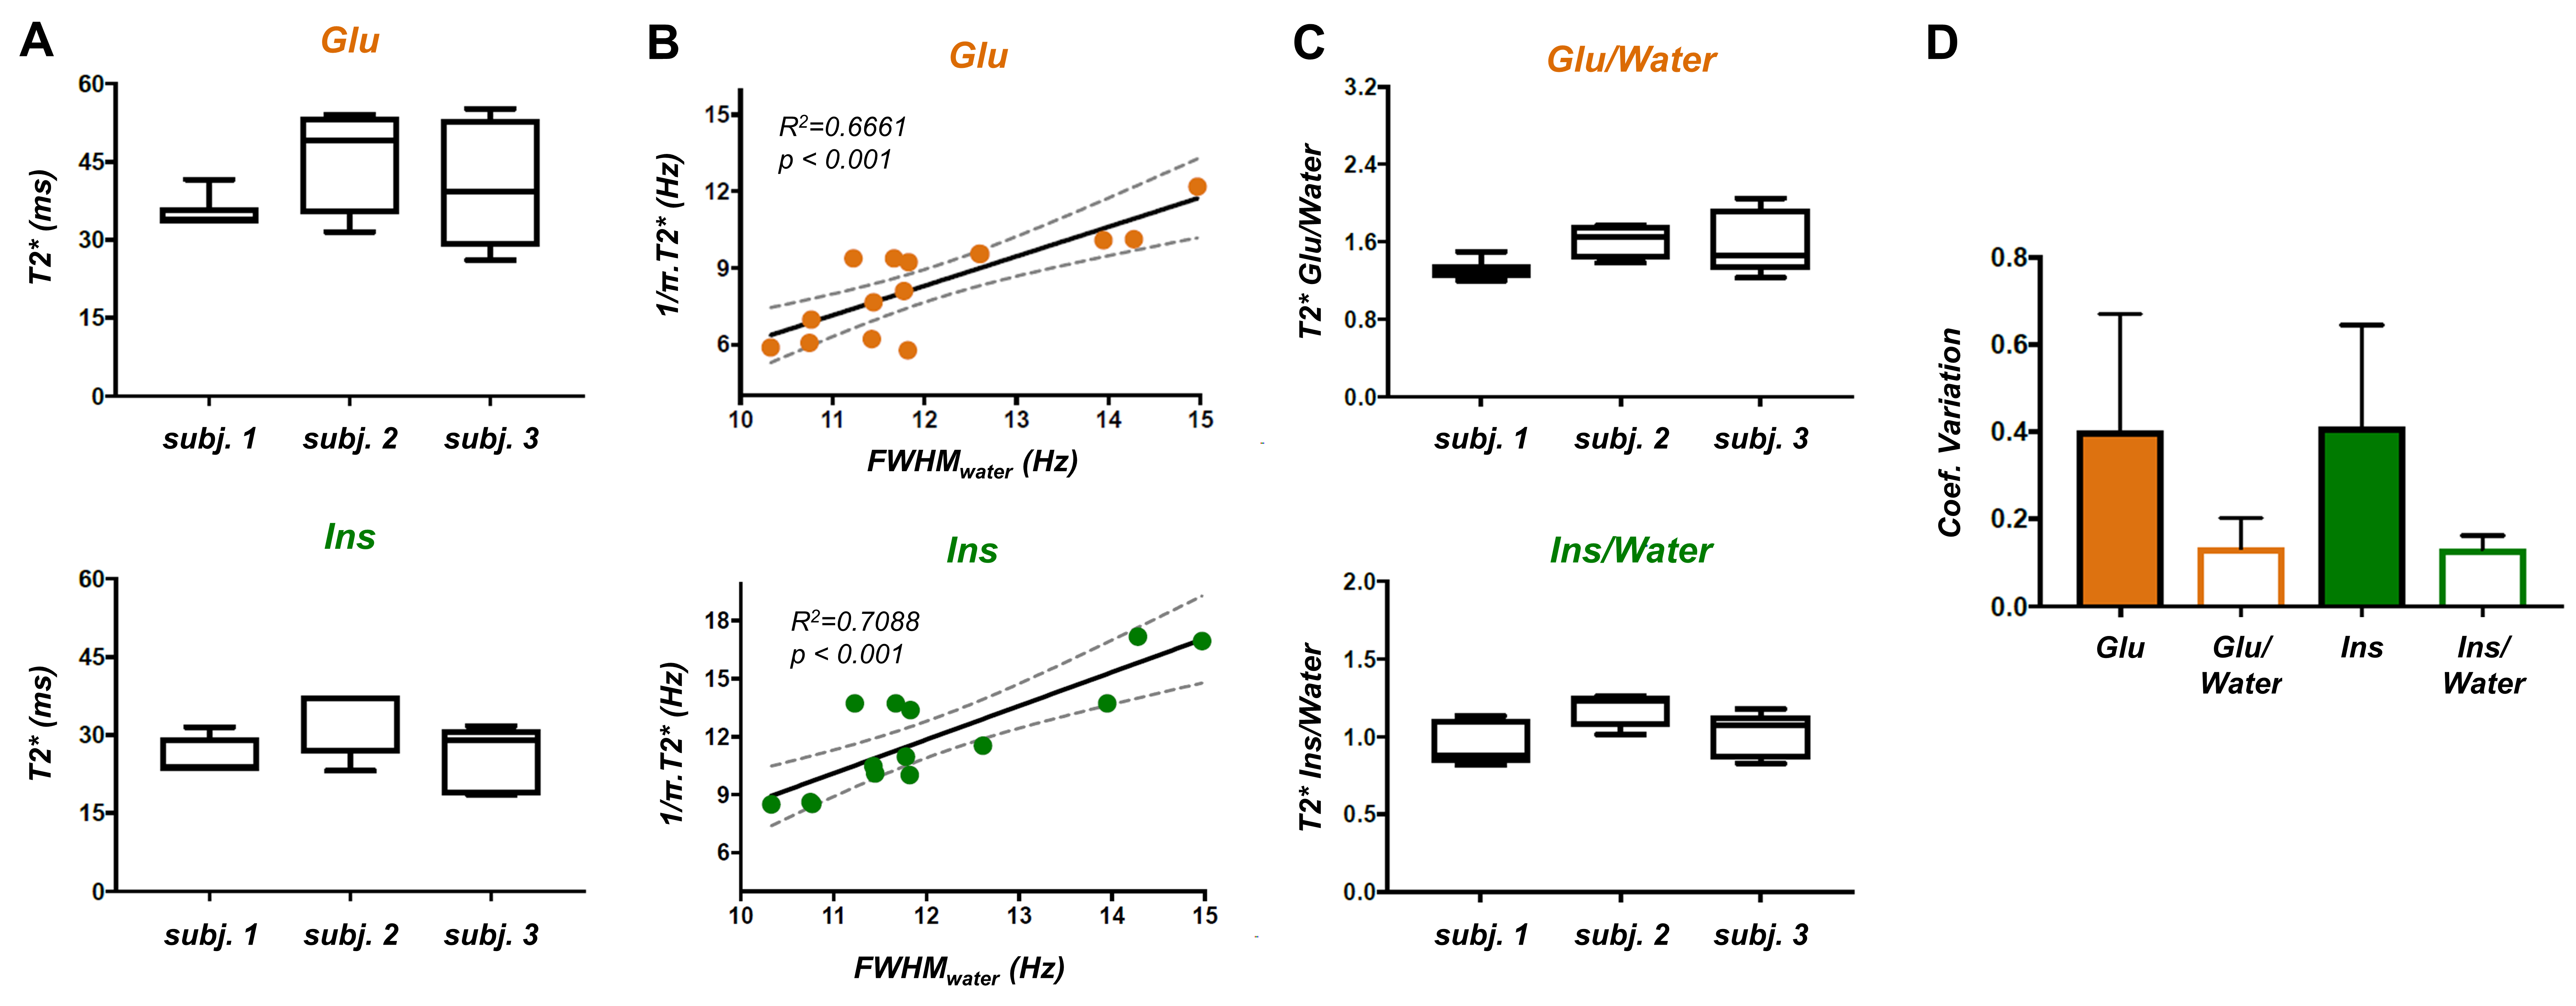
Figure 4: (A) Box plots show the variation in Glu and Ins T2*
values within subjects. (B) Correlations between Glu and Ins FWHM, estimated
from their T2*, and FWHMwater, estimated from LPSVD, are shown, suggesting local B0 inhomogeneities
affect T2* measurement. (C) Box plots show the variation of the ratio of T2*
Glu/Water and Ins/Water. (D) Coefficient of variation of the measured T2*
(mean±s.d. over 3 subjects) is significantly reduced when metabolite T2* is
normalized to water T2*, illustrating a possible correction for shim differences across
acquisitions.