0287
Short-TE ECLIPSE for Macromolecular-Nulled MRSI in the Human Brain1Department of Radiology and Biomedical Imaging, Magnetic Resonance Research Center, Yale University, New Haven, CT, United States
Synopsis
An ECLIPSE-IVS based MRSI method was developed utilizing 3 ms GOIA-WURST RF pulses (BW = 15 kHz), operating at an RF amplitude B1(95%) = 0.87 kHz. The ECLIPSE-IVS method was preceded with a water suppression module incorporating an optional inversion recovery (IR) component, to achieve macromolecule-nulled acquisitions. MRSI in vivo demonstrate robust extracranial lipid suppression with reliable, artifact-free metabolic maps generated with peak integration and LCModel fitting.
Introduction
Short TE (~ 20ms) MRSI in combination with a macromolecule-nulled inversion recovery (IR) module minimizes J-modulation effects, and provides high SNR spectra devoid of overlapping macromolecular resonances. Elliptical localization with pulsed second-order fields (ECLIPSE1,2) has previously been used for robust extracranial lipid-suppressed MRSI acquisitions. Gradient offset-independent adiabaticity (GOIA) pulses3, specifically hyperbolic secant (HS) and WURST modulations, are popular choices to realize high BW and SAR compatible GOIA pulses4,5. Previous ECLIPSE-based inner volume selection (IVS) MRSI methods with an adiabatic double spin-echo, were limited to TE > 35 ms1,2, primarily due to system RF and gradient limitations. In this work, the development of a ~20 ms TE ECLIPSE-IVS method is investigated with GOIA pulses to realize a robust macromolecule-nulled MRSI method. The eventual goal of this study is to investigate spectral quantification with LCModel fitting of macromolecule-nulled and non-nulled MRSI data in the human brain.Methods
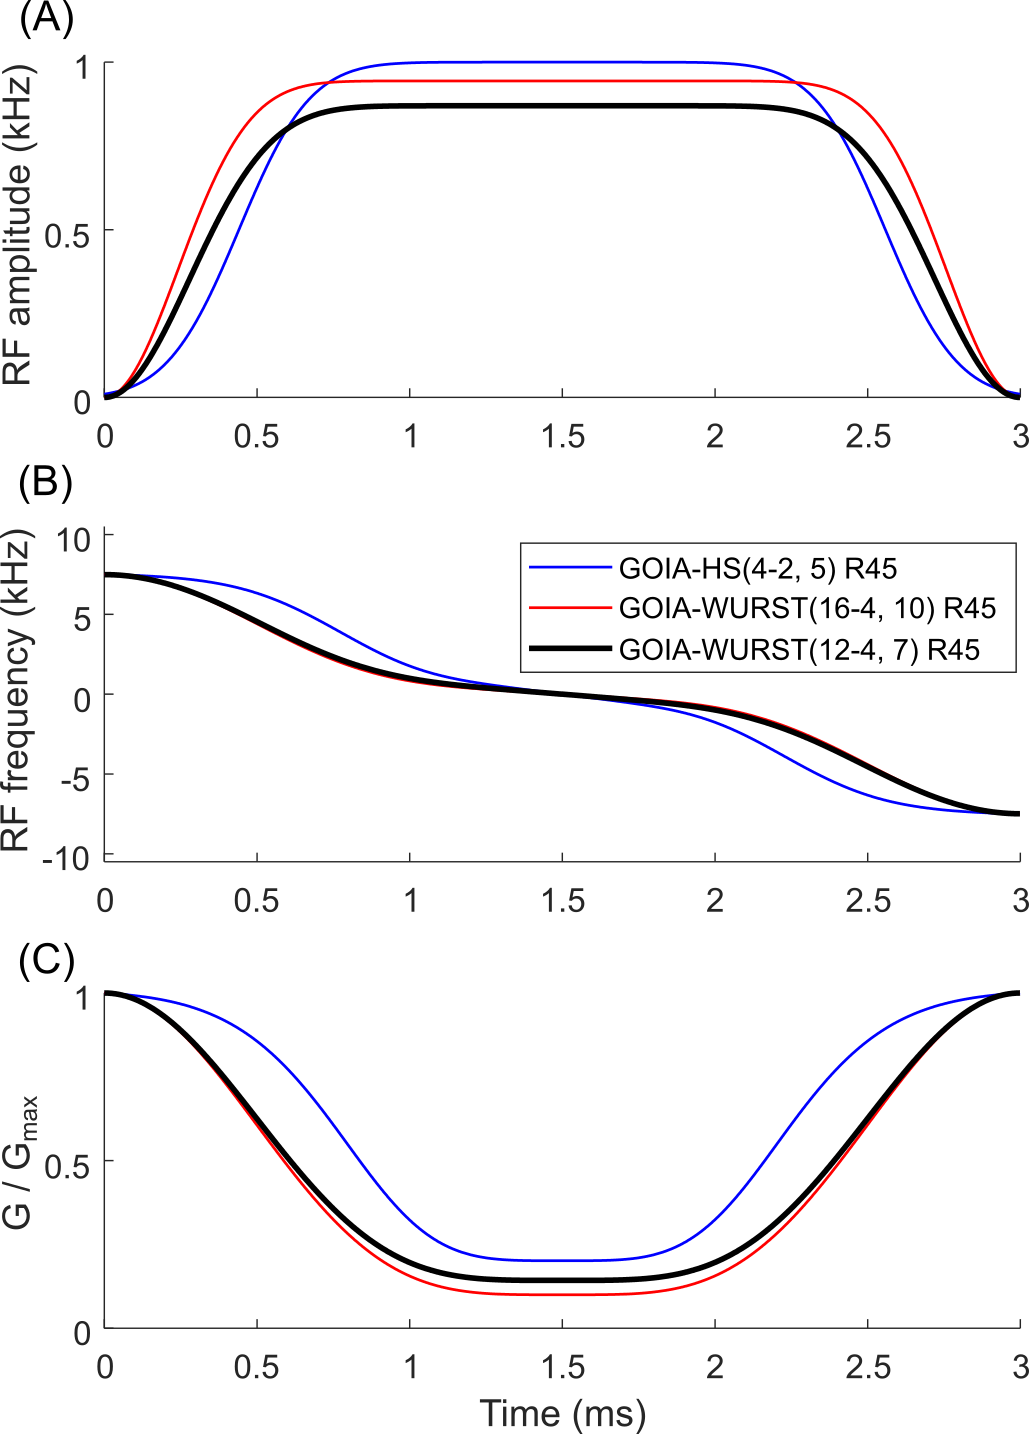
We investigated an R = 45 (Tp = 3 ms, BW = 15 kHz) variant of the GOIA-WURST (16-4,10) pulse (with R = 70) previously reported4 (amplitude modulation (AM) exponent of 16, gradient modulation (GM) exponent 4, and GOIA factor of 10). Requirements for the R = 45, GOIA-WURST pulse variant included: 1) peak B1 < 0.9 kHz for Tp = 3 ms, considering inversion profile smearing associated with GOIA pulses due to chemical shift2,4,5, 2) a reduction in SAR relative to a GOIA-HS(4-2,5) pulse used in a previous ECLIPSE-IVS study2, to allow an additional AFP pulse inversion base IR module for ECLIPSE-IVS (described below).A GOIA-WURST (12-4,7) pulse was designed and compared against GOIA-HS(4-2,5) and GOIA-WURST(16-4,10) pulses in simulation, all with R = 45. Figure 1 illustrates AM, frequency modulation (FM), and GM functions for the three pulses.
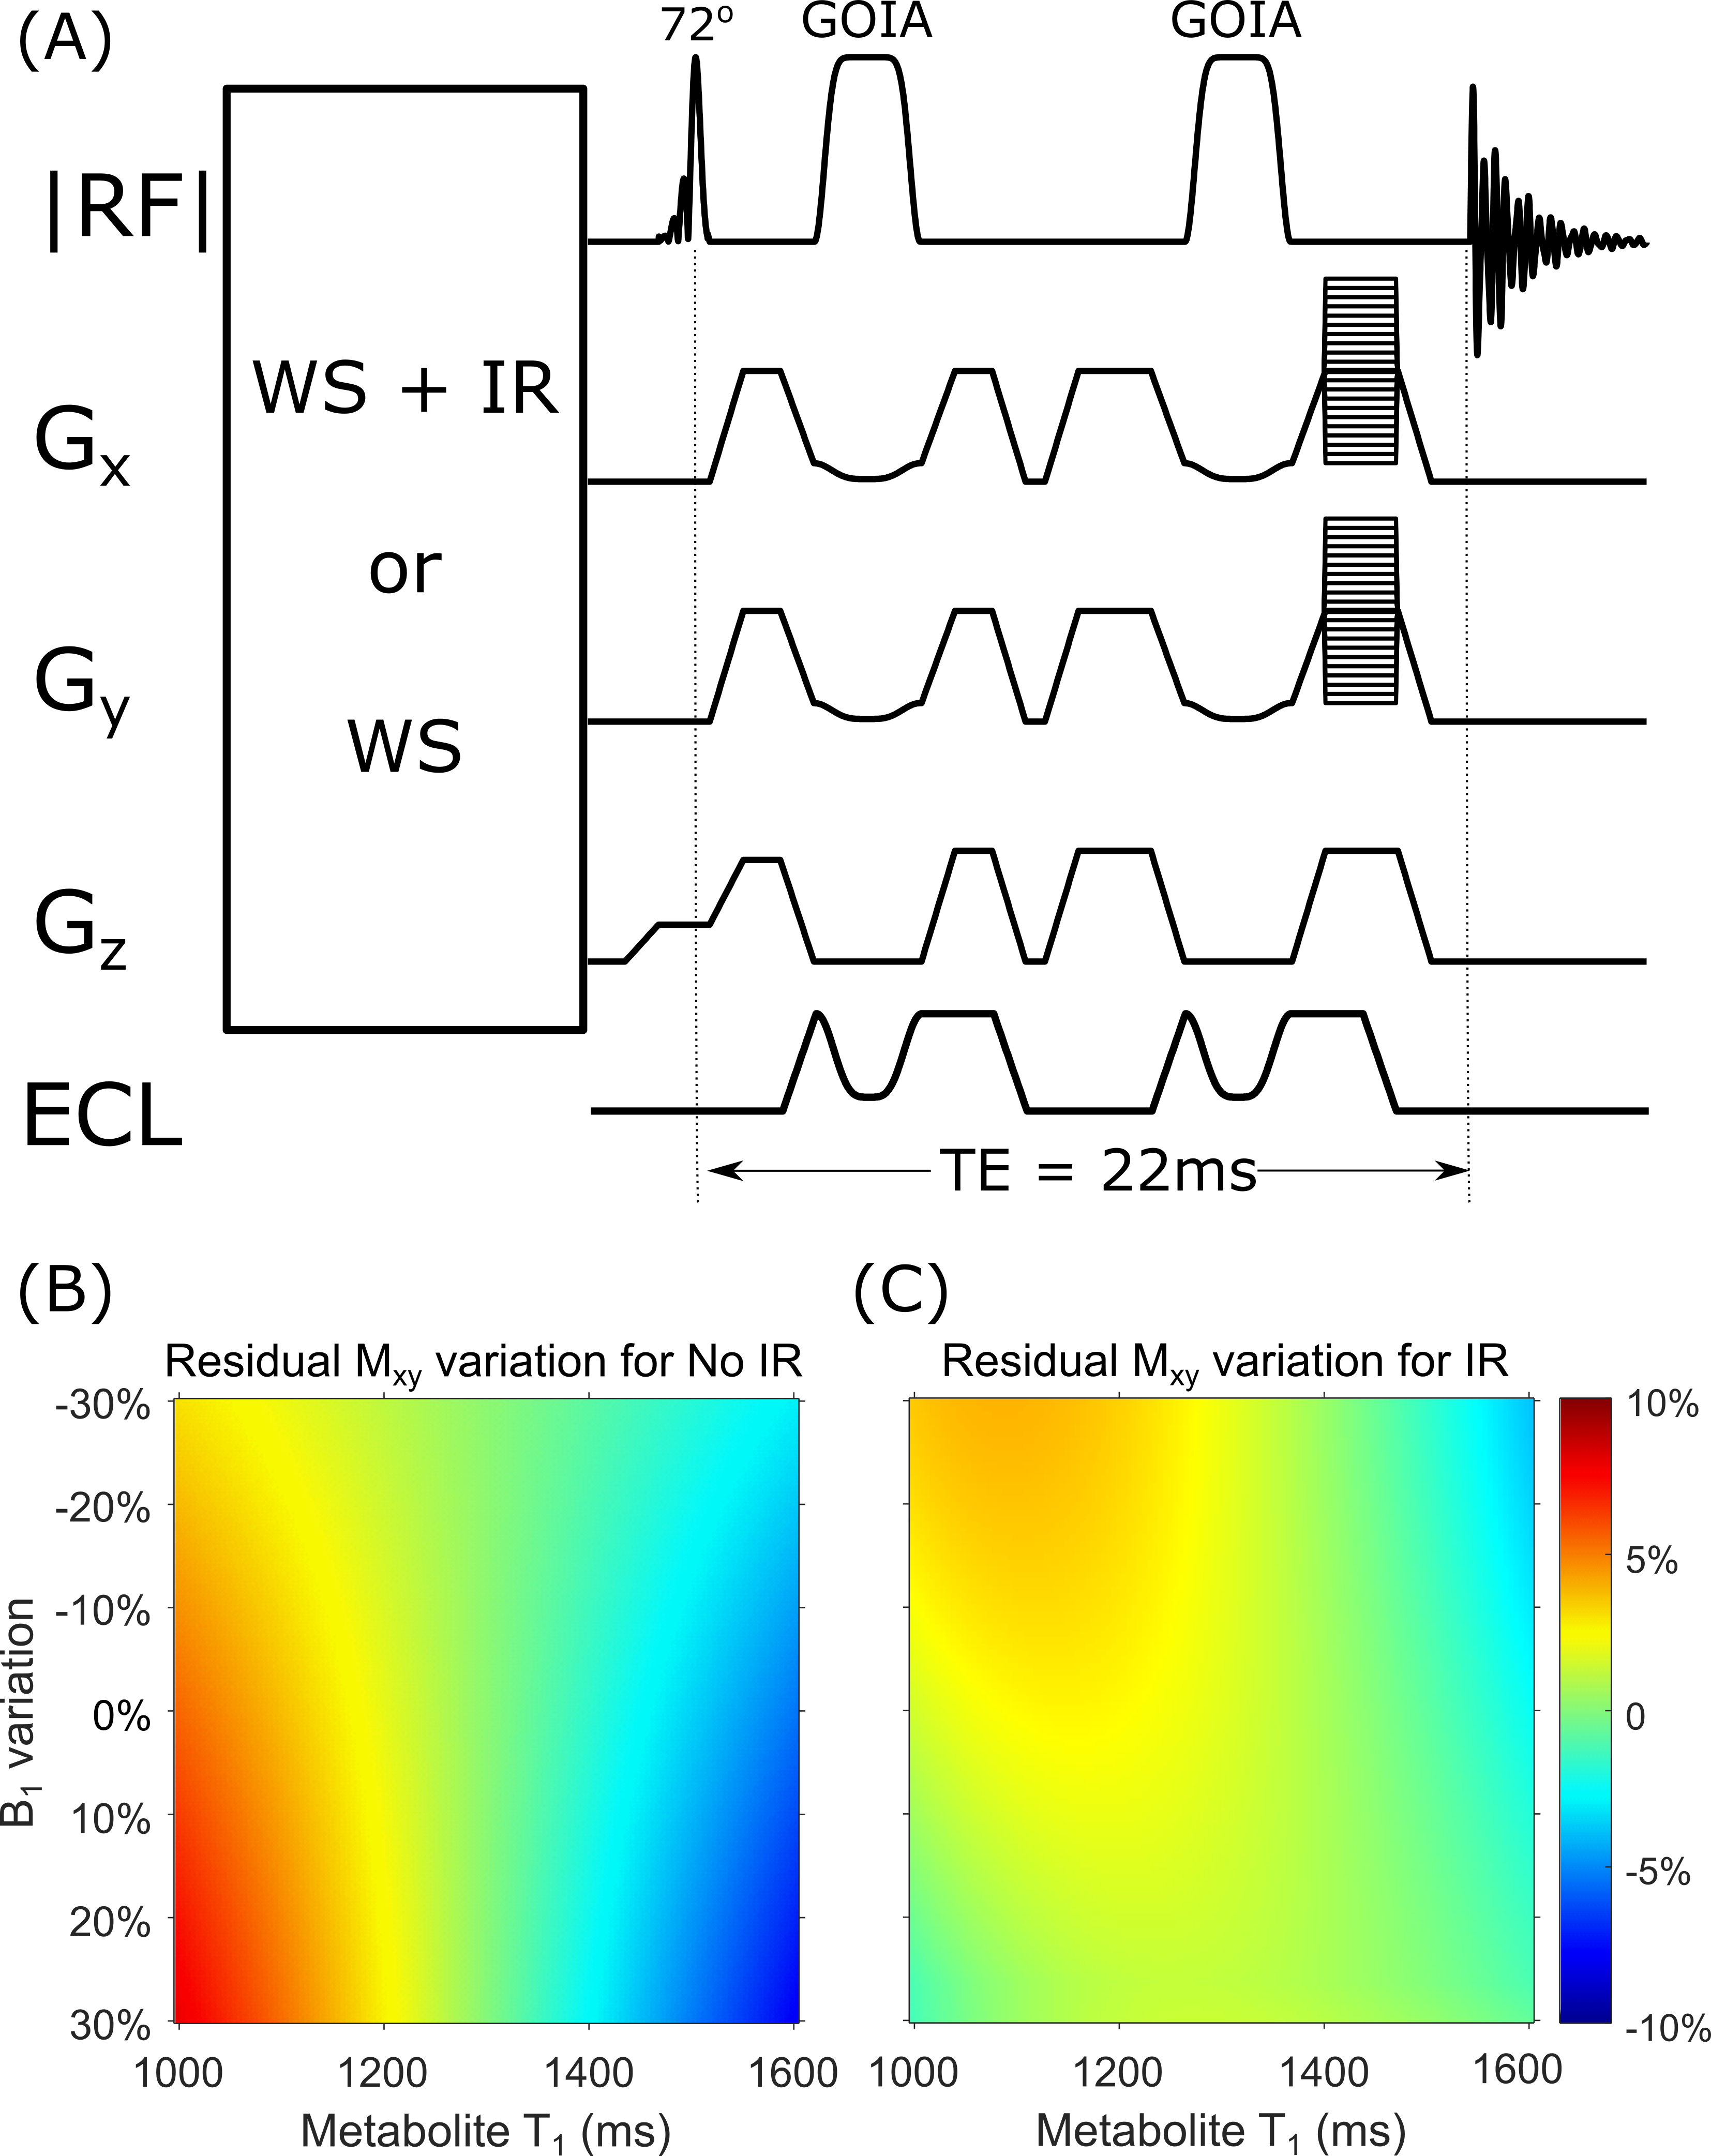
An ECLIPSE-IVS1 method with TE = 22.2 ms, utilizing the GOIA-WURST(12-4,7) was developed with a preceding: 1) macromolecule-nulling IR method (TI = 200 ms) with optimized water suppression2 hereafter called IR, and 2) an 8-pulse VAPOR6 module (hereafter termed non-IR). Global IR was achieved with an AFP-HS4 pulse (Tp = 6.66 ms, BW = 3.0 kHz). Excitation was achieved with an asymmetric SLR pulse (Tp = 1.44 ms, BW = 4 kHz, asymmetry factor = 0.28).
Peak integration over a ± 0.1 ppm range of NAA was used to evaluate extracranial lipid suppression and to compare signal intensities between the two acquisition methods. LCModel7 was used to fit data acquired with the IR method. The required basis sets were generated using SpinWizard, an in-house developed spin system simulator, accounting for RF pulses and delays. The LCModel fitting included sixteen metabolites, and one macromolecule at 0.9 ppm.
All MR experiments were performed on a 4 T 94 cm Medspec scanner (Bruker corporation. Ettlingen, Germany). An 8-element Tx/Rx volume head coil was used. The ECLIPSE system1 is a home-built, unshielded gradient insert consisting of Z2, X2Y2, and XY second order spherical harmonic magnetic fields, interfaced to a home-built multi-channel gradient controller8.
Results
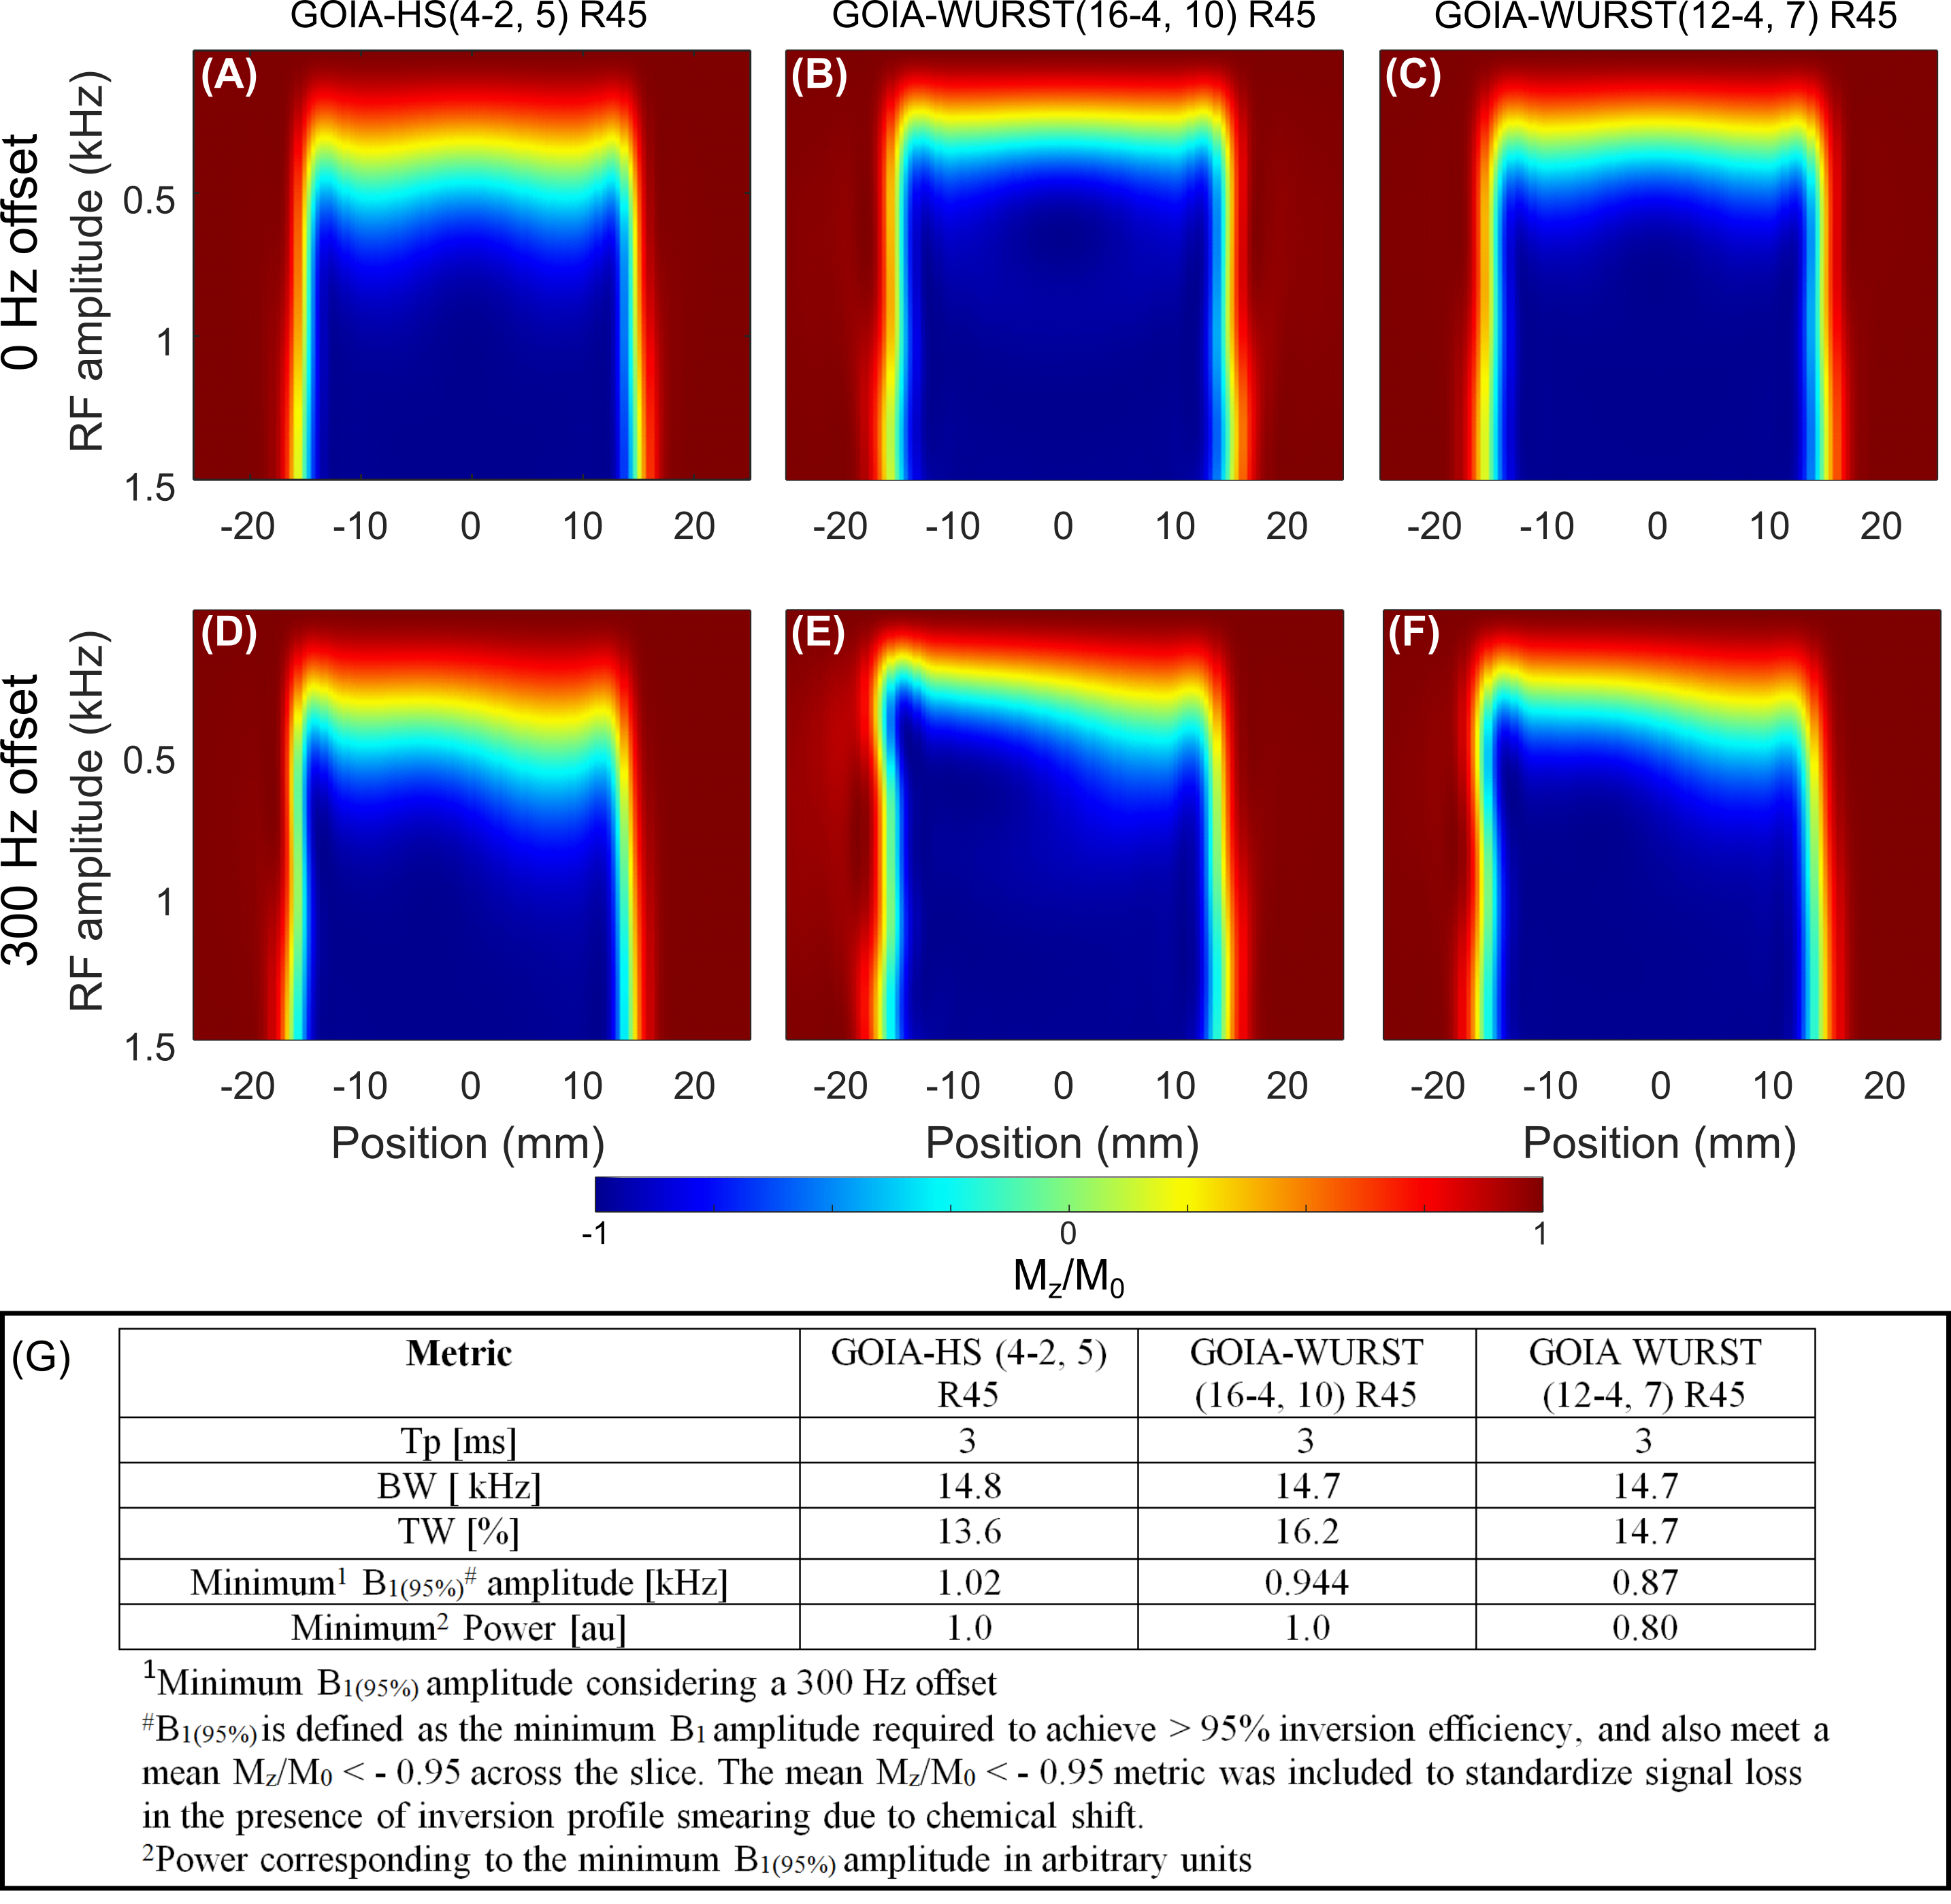
Figure 2 shows Bloch simulations for the three GOIA pulses vs B1 amplitude for on resonance (A-C) and off-resonance (D-F) conditions. Figure 2(G) summarizes metrics for the three pulses. While all pulses have similar transition width (TW) metrics, B1(95%) was lowest with the GOIA-WURST(12-4,7) at 0.87 kHz, and consumes 20% less power than both the other pulses.The IR and no-IR methods were implemented with TR = 2.5 s (Figure 3) and an excitation angle of 72°, to minimize T1 saturation effects at steady-state. The deviation of Mxy/Mz due to B1 inhomogeneity and metabolite T1 species is illustrated in Figure 3 (B-C), where a maximum variation of ± 10% is shown for both methods. A mean reduction in signal of 36% was present with the IR method relative to the No-IR method in simulation (not shown).
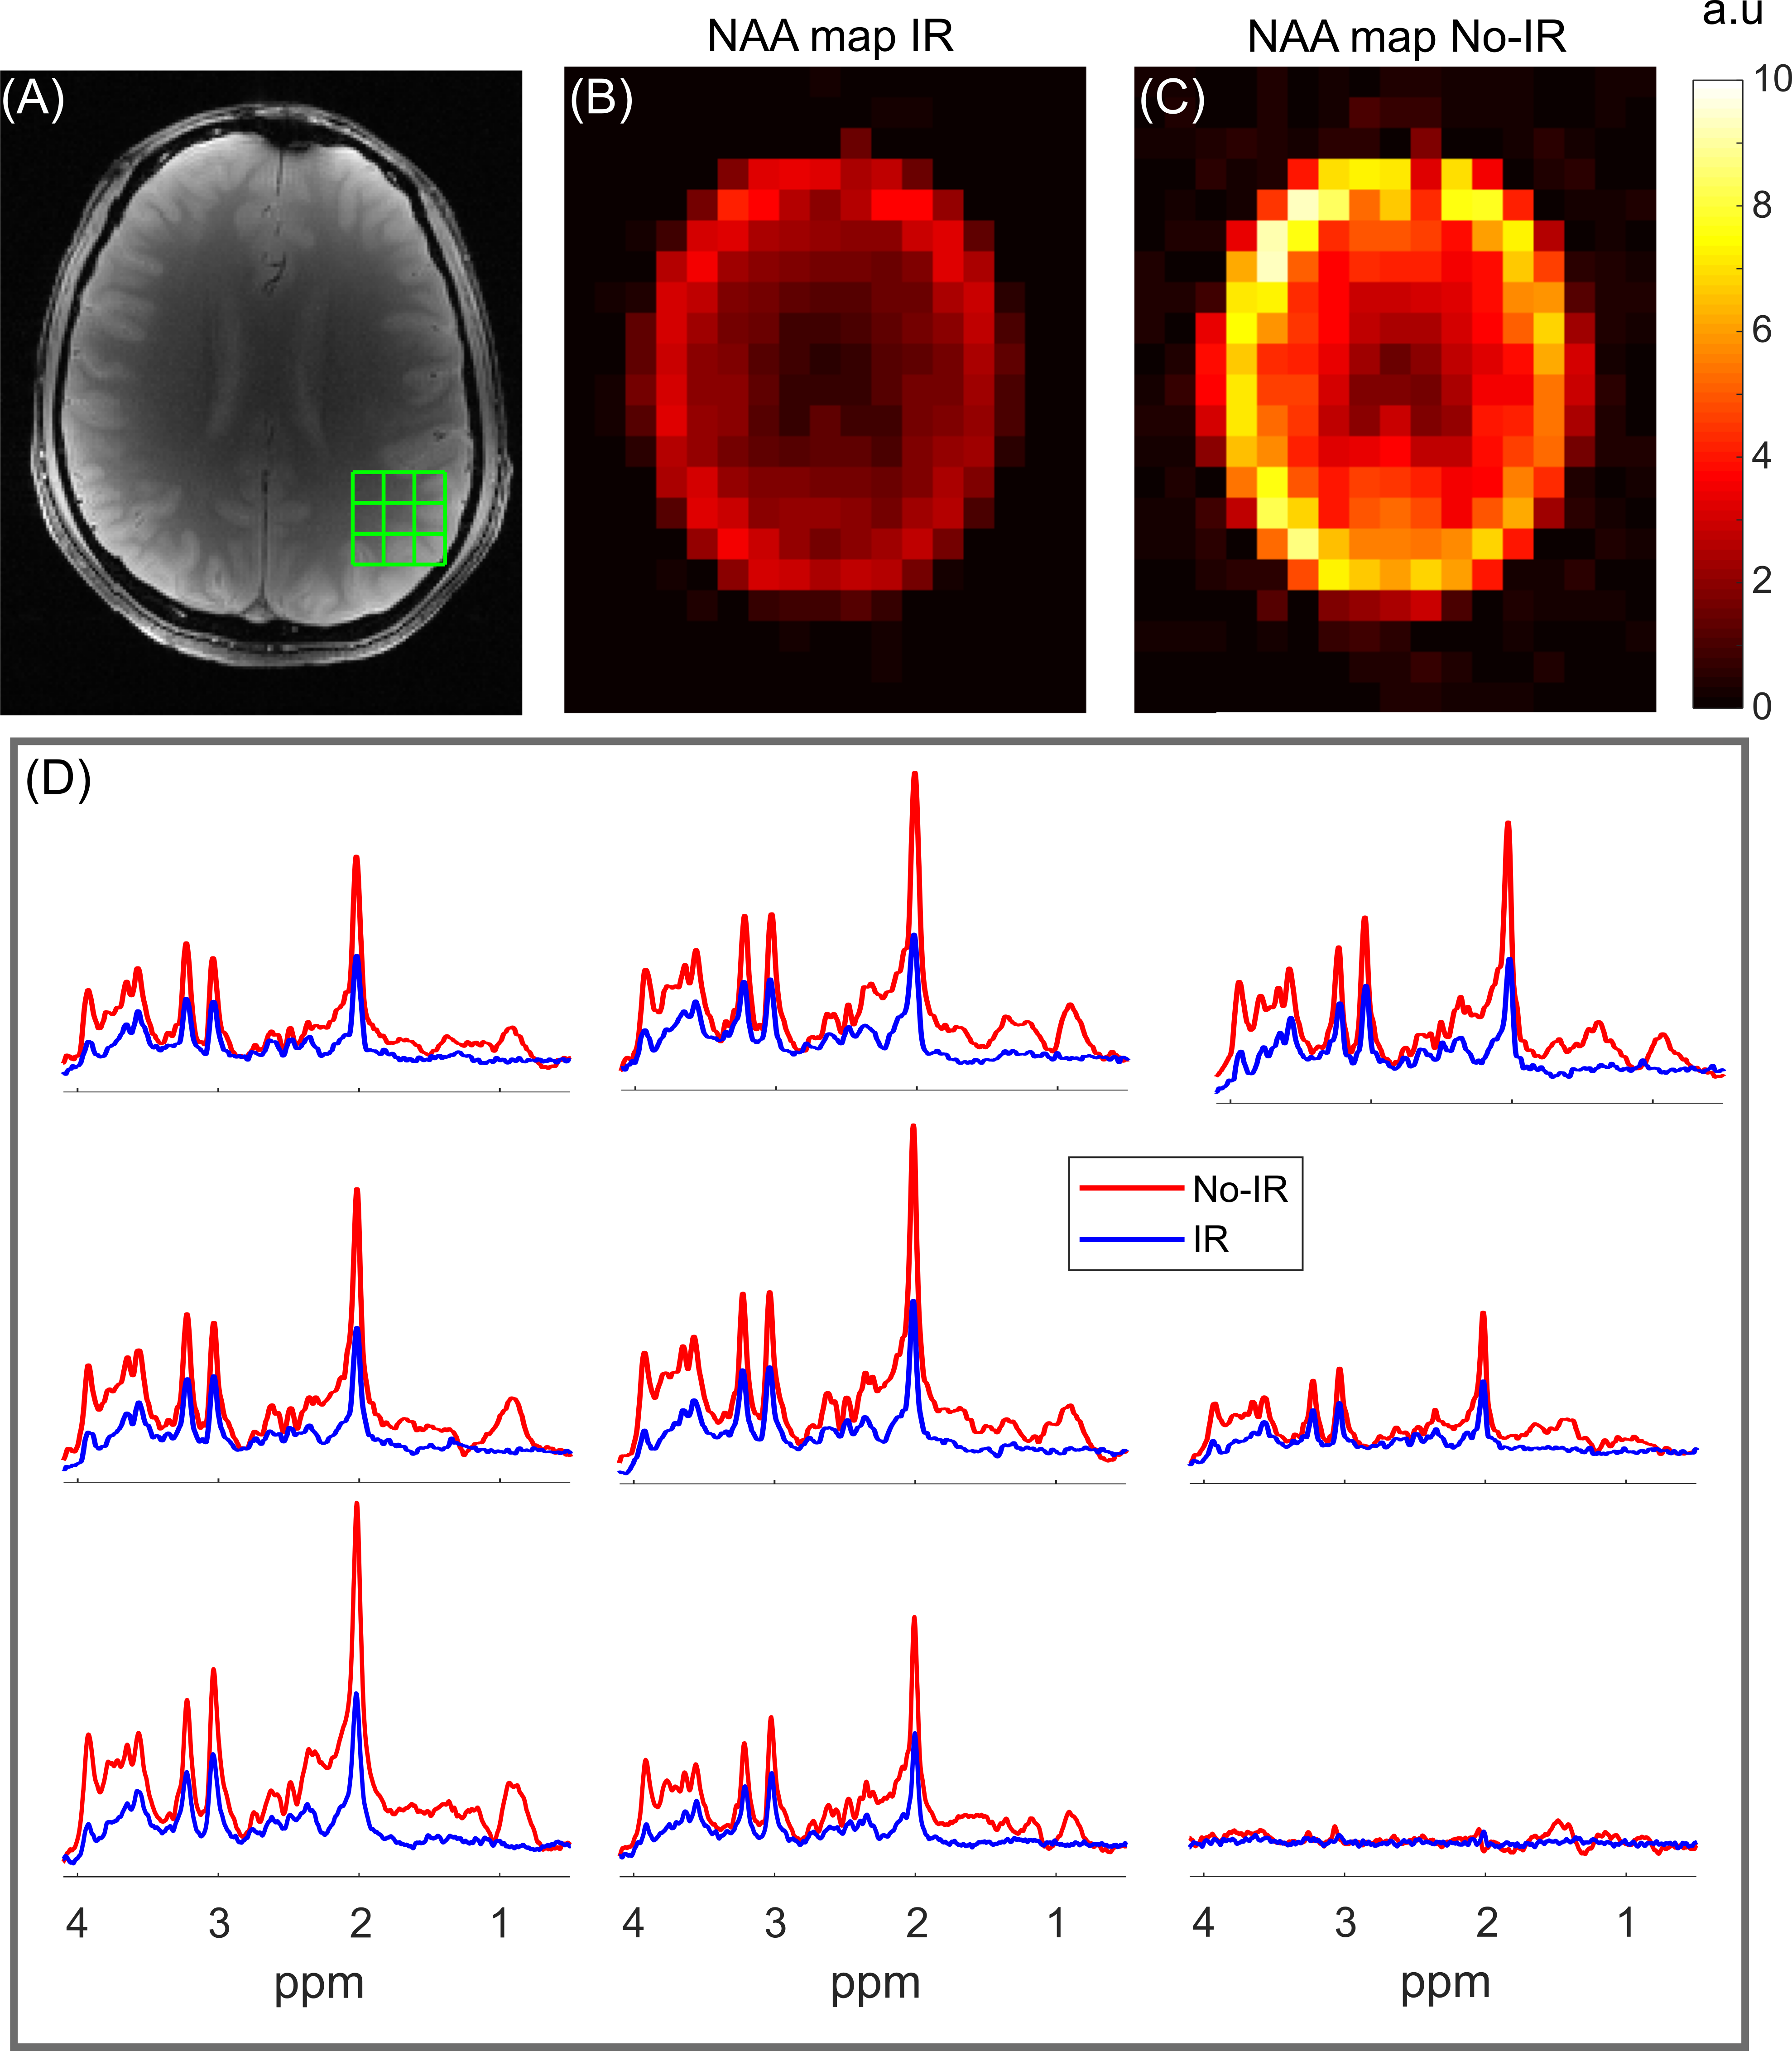
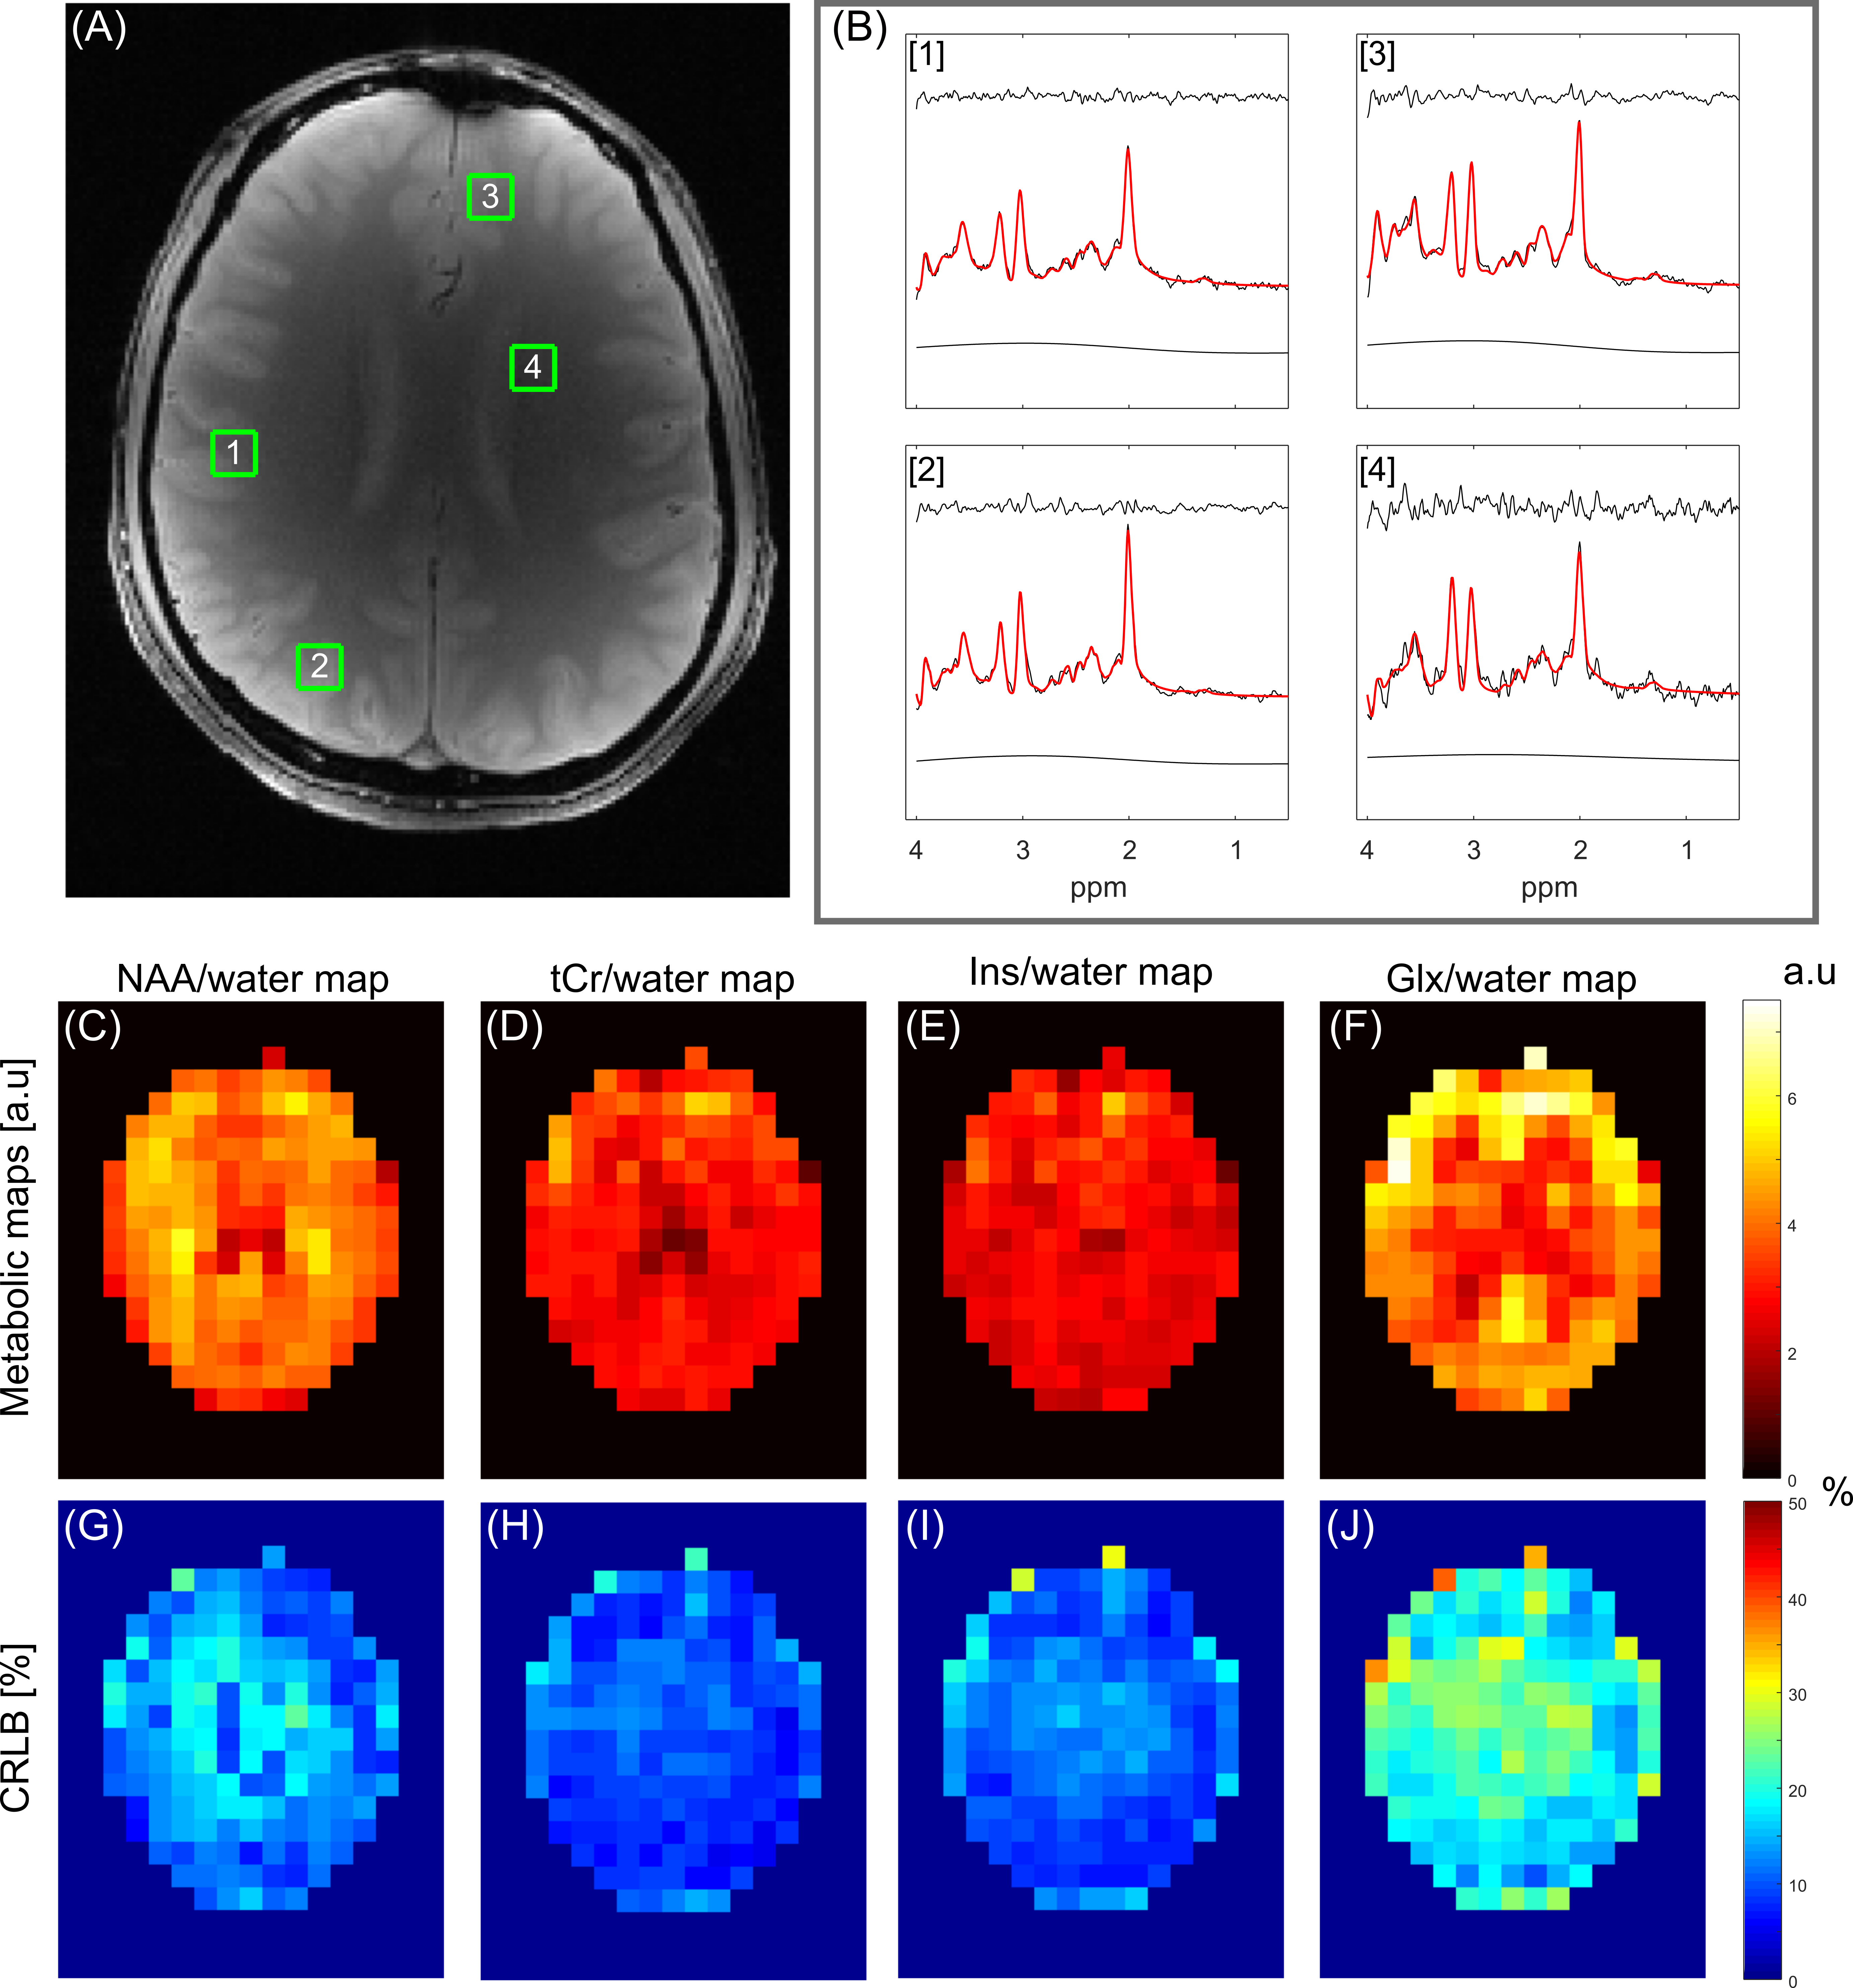
Figure 4 illustrates IR and No-IR MRSI data acquired from the brain in vivo. Metabolic maps for NAA, as based on spectral integration, demonstrate excellent extracranial lipid suppression for both methods, with a consistent reduction in integrated NAA intensity of 60-70% for the IR method. The signal reduction is consistent with nulling of the macromolecular signal contribution achieved by T1-based signal nulling, combined with signal reduction due to partial recovery of the metabolite resonances.
Figure 5 is an extension of data in Figure 4, with LCModel fitting of the IR dataset. The fitted data show good agreement with the measured data. Note that the LCModel fit was completed with a gentle spline baseline, in stark contrast to the typical high-order functions needed to describe MM signal in non-IR data.
Discussion
The proposed modification to the GOIA-WURST(16-4,10) pulse with (12-4,7) provides a reduction in B1 amplitude of 0.87 kHz and SAR, for an R = 45 implementation, and can allow shorter TE sLASER and LASER MRS/MRSI methods on clinical MRI scanners. The high quality of the current IR and non-IR-based MRSI data provides an ideal platform to evaluate the advantages of experimental nulling of MM signals for metabolite quantification accuracy and precession.Acknowledgements
This research was supported by NIH grant R01- EB014861.References
[1] de Graaf RA, Brown PB, De Feyter HM, McIntyre S, Nixon TW. Elliptical localization with pulsed second-order fields (ECLIPSE) for robust lipid suppression in proton MRSI. NMR in Biomedicine 2018;31(9):e3949.
[2] Kumaragamage C, De Feyter HM, Brown P, McIntyre S, Nixon TW, de Graaf RA. ECLIPSE utilizing gradient-modulated offset-independent adiabaticity (GOIA) pulses for highly selective human brain proton MRSI. NMR in Biomedicine 2020; 34:e4415.
[3] Tannus A, Garwood M. Adiabatic pulses. NMR in Biomedicine 1997;10(8):423–434.
[4] Andronesi OC, Ramadan S, Ratai E, Jennings D, Mountford C, Sorensen AG. Spectroscopic imaging with improved gradient modulated constant adiabaticity pulses on high-field clinical scanners, Journal of Magnetic Resonance 2010; 203: 283-293.
[5] Deelchand DK, Berrington A, Noeske R, et al. Across-vendor standardization of semi-LASER for single-voxel MRS at 3T. NMR in Biomedicine 2019;e4218.
[6] Tkáč I, Dellchand D, Dreher W, et al. Water and lipid suppression techniques for advanced 1H MRS and MRSI of the human brain: Experts’ consensus recommendations. NMR in Biomedicine 2020 [accepted].
[7] Provencher SW. Estimation of metabolite concentrations from localized in vivo proton NMR spectra. Magnetic Resonance in Medicine 1993; 30:672-679.
[8] Nixon TW, McIntyre S, de Graaf RA. The design and implementation of a 64 channel arbitrary gradient waveform controller. Proc Int Soc Magn Reson Med. 2017;25:969.
Figures