0286
Using selective RF pulses in diffusion-weighted MRS for lactate diffusion measurements with minimal J-modulation1Université Paris-Saclay, Commissariat à l'Energie Atomique et aux Energies Alternatives (CEA), Centre National de la Recherche Scientifique (CNRS), Molecular Imaging Research Center (MIRCen), Laboratoire des Maladies Neurodégénératives, Fontenay aux Roses, France
Synopsis
Brain lactate compartmentation is an important but debated neuroscience question. By assessing local microstructure where lactate is diffusing in, diffusion-weighted MRS has unique potential to non-invasively assess lactate compartmentation. We propose to increase lactate signal using selective pulses (SP) to cancel J-modulation. We compare lactate signal behavior in diffusion-weighted experiments performed in vivo, using either spin echo or stimulated echo sequence relying on selective pulses. We verify here that the signal increases in both cases, compared to conventional cases using broad pulses. Spin echo using SP appears the most valuable option to measure lactate diffusion at high b-values.
INTRODUCTION
Non-invasive assessment of lactate content inside the different cellular compartments in the brain would be invaluable to investigate energy metabolism and astrocyte-to-neuron lactate shuttle hypothesis1,2. Diffusion-weighted magnetic resonance spectroscopy (DW-MRS) may provide information about the microstructural environment of lactate, and thus allow assessing in which cellular compartment it is diffusing3. Nevertheless, lactate diffusion measurements are made extremely difficult by low lactate’s signal-to-noise ratio, especially when the diffusion-weighting (b) increases.We propose to apply selective pulses (SP) to increase the signal of the CH3 lactate peak at 1.3 ppm by cancelling the effect of scalar coupling (J) with the CH lactate peak at 4.1 ppm. We demonstrate experimentally the signal gain that this method can yield, and evaluate its benefits for two classes of sequences used in DW-MRS: spin echo (SE) sequence and stimulated echo (STE) sequence4.
METHODS
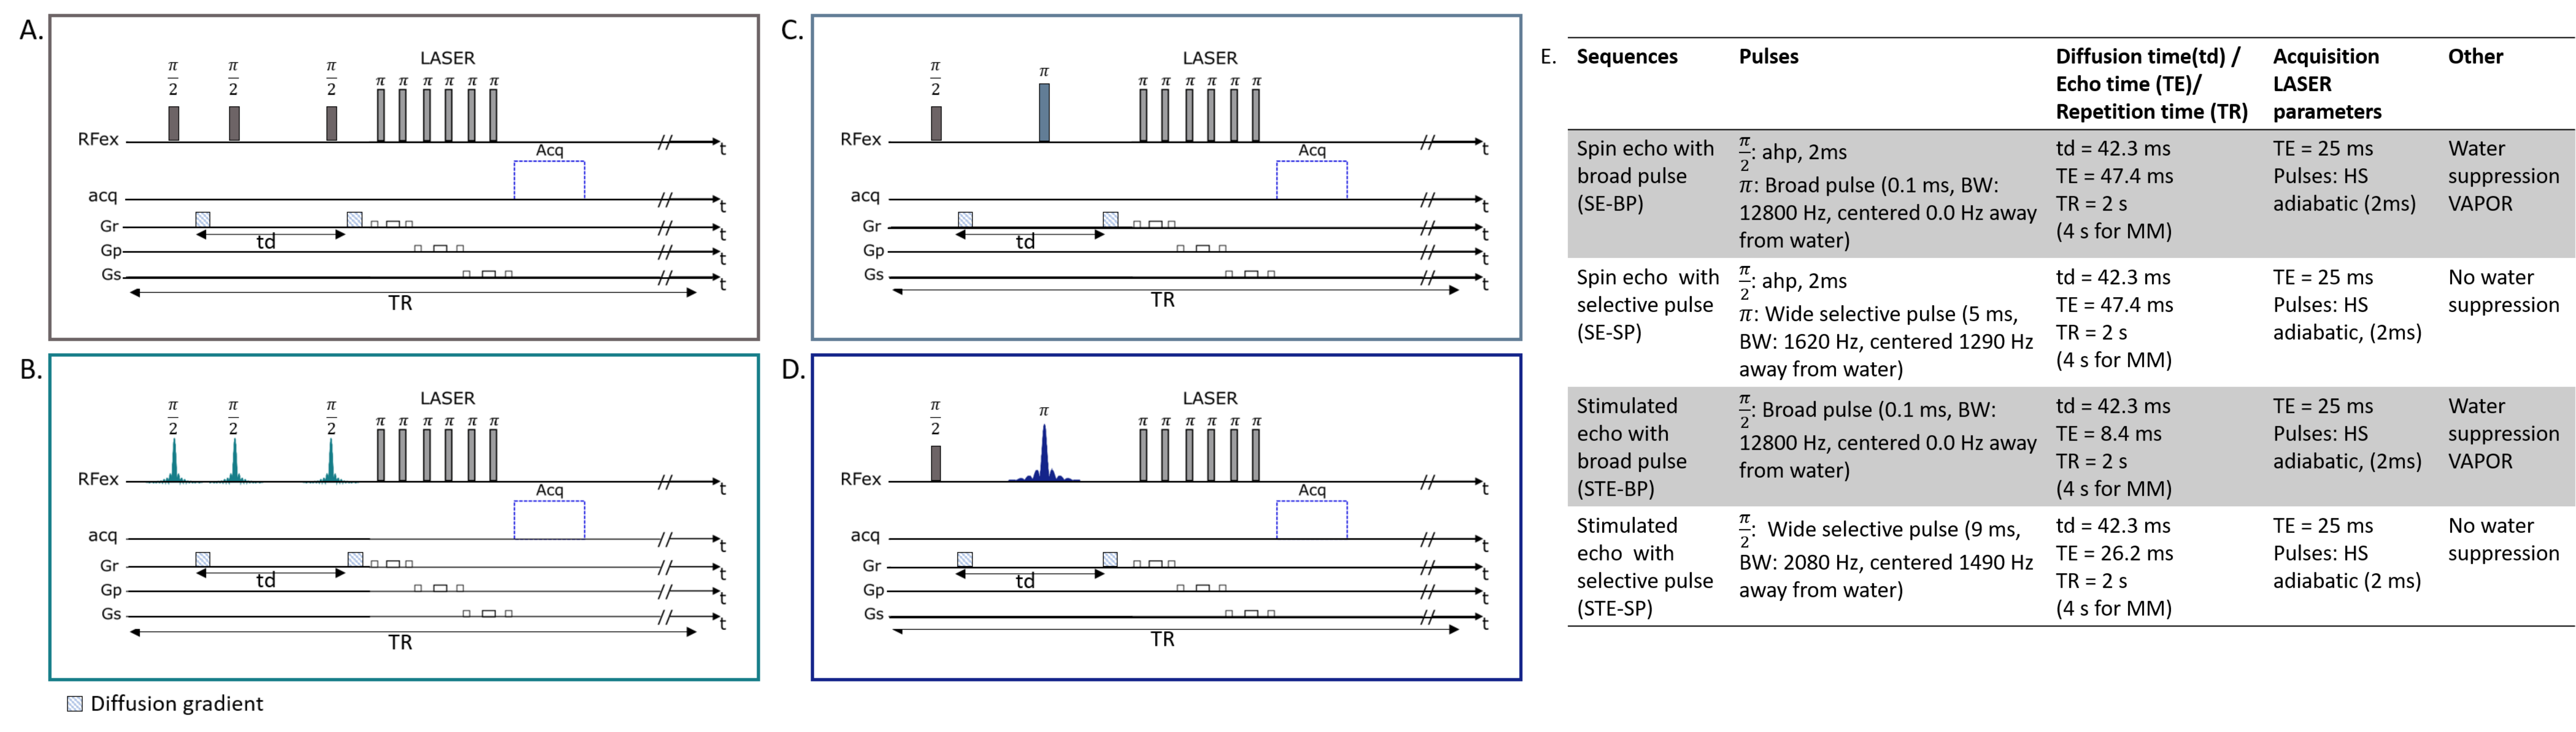
We investigated sequence performances with two-by-two comparisons: diffusion-weighting STE using broadband pulses followed by an adiabatic LASER localization module (STE-LASER5), as classically used in our lab (Fig. 1A), versus its selective STE counterpart (Fig. 1B); broadband versus selective diffusion-weighting spin echo sequences (Fig. 1C and 1D); and broadband STE versus selective SE sequence. For SE, excitation was achieved with AHP pulse and refocusing was achieved with either a 0.1-ms broad pulse or a 5-ms selective homemade π pulses. STE consisted in either three 0.1-ms broad pulses or three 9-ms $$$\frac{\pi}{2}$$$ SP. SP were designed to select the [4.1; 0.8] ppm range, using Shinnar-Le Roux (SLR) algorithm6. Note that, while a VAPOR water suppression module was required when using broad pulses, sequences using partially selective pulses did not require water suppression. Figure 1E lists main sequence parameters.Three anesthetized C57/BL6 mice were scanned in a Bruker Scanner at 11.7 T equipped with a cryoprobe. Isoflurane level ranged from 1 % to 1.3 % between animals, but was kept constant throughout the experiment for each animal. Diffusion-weighted experiments were performed in four blocks of 32 averages for five different b (0.02, 3.02, 8, 15, 20 ms/µm2) to measure the diffusion attenuation of metabolites (Lac, NAA, myo-inositol Ins, total creatine tCr and choline compounds tCho). Spectra were acquired in a volume of 31.5 mm3 centered around the hippocampus, and analyzed with LCModel7. Experimental MM spectra were included in LCModel basis-sets. ADC was computed using the two lowest b-values (0.02 and 3.02 ms/µm2).
RESULTS
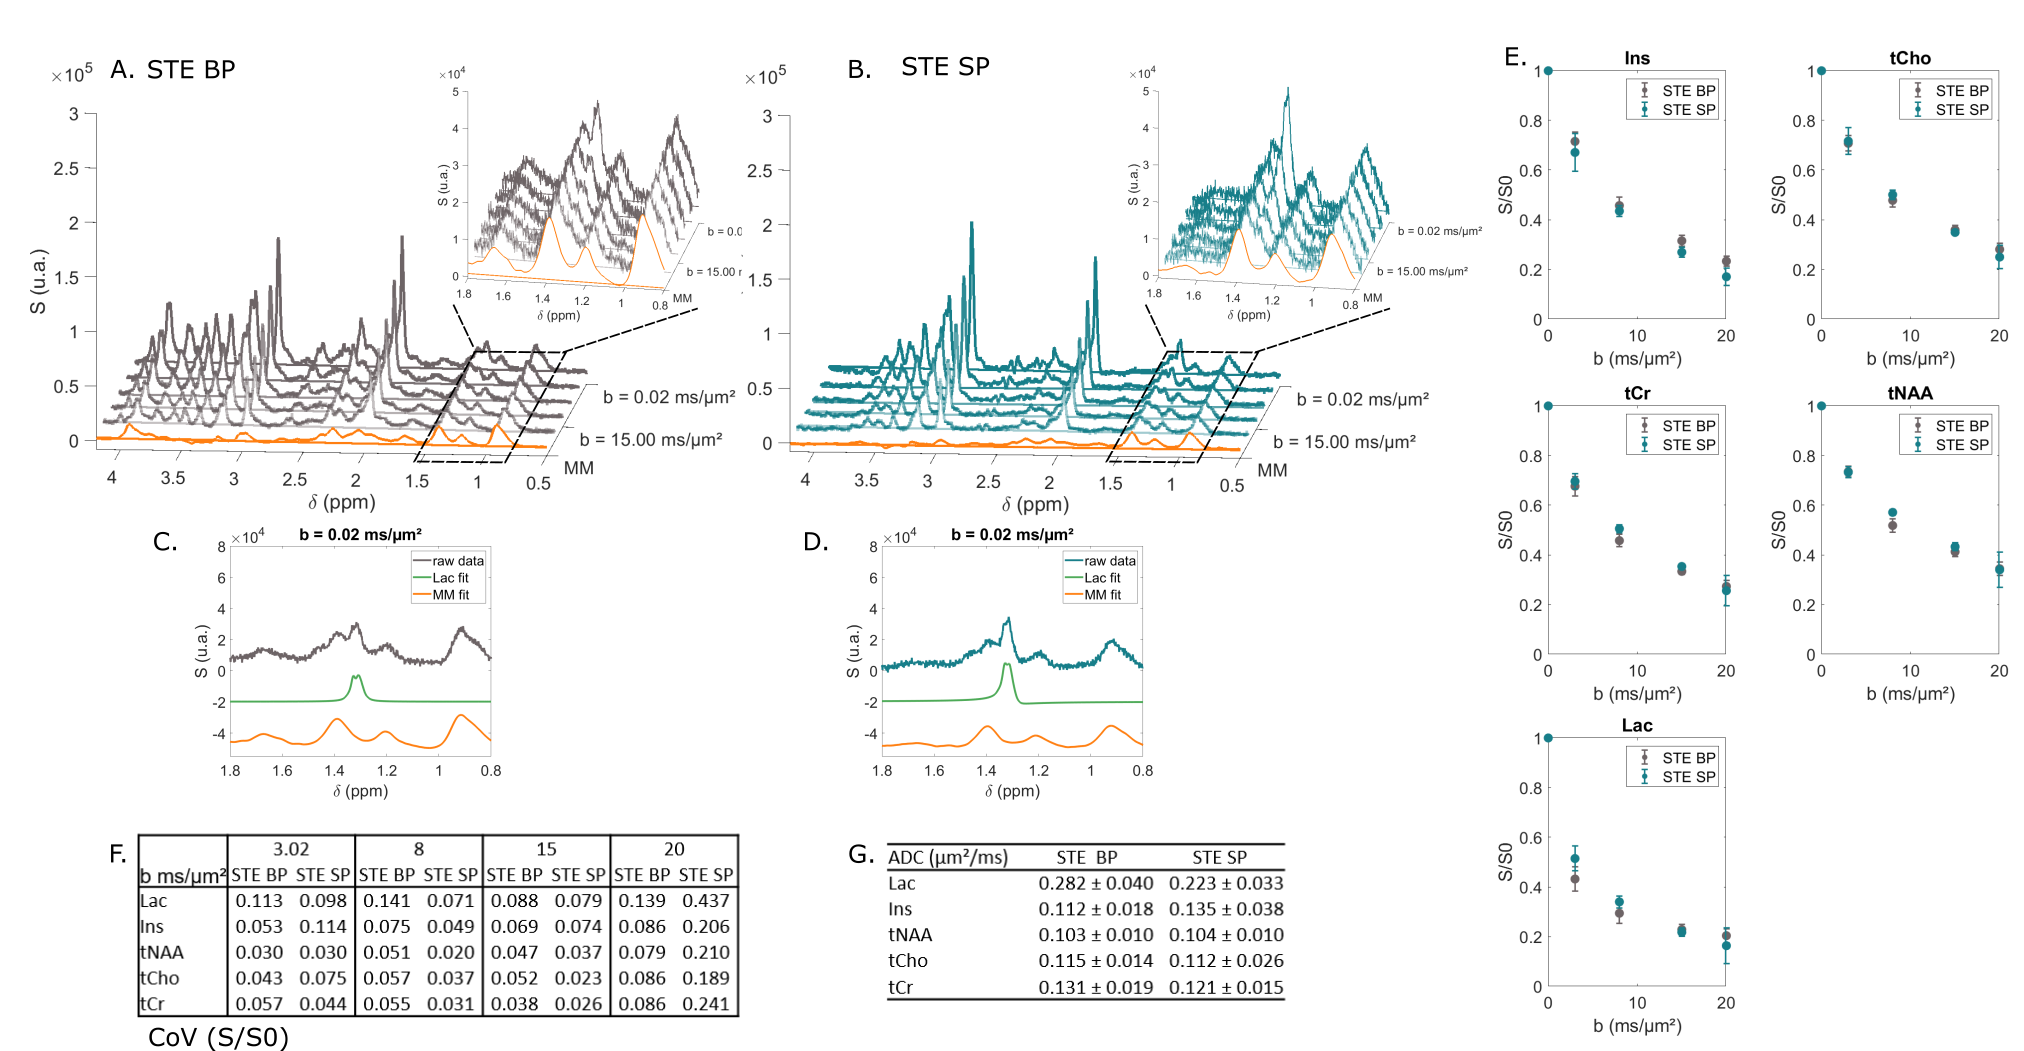
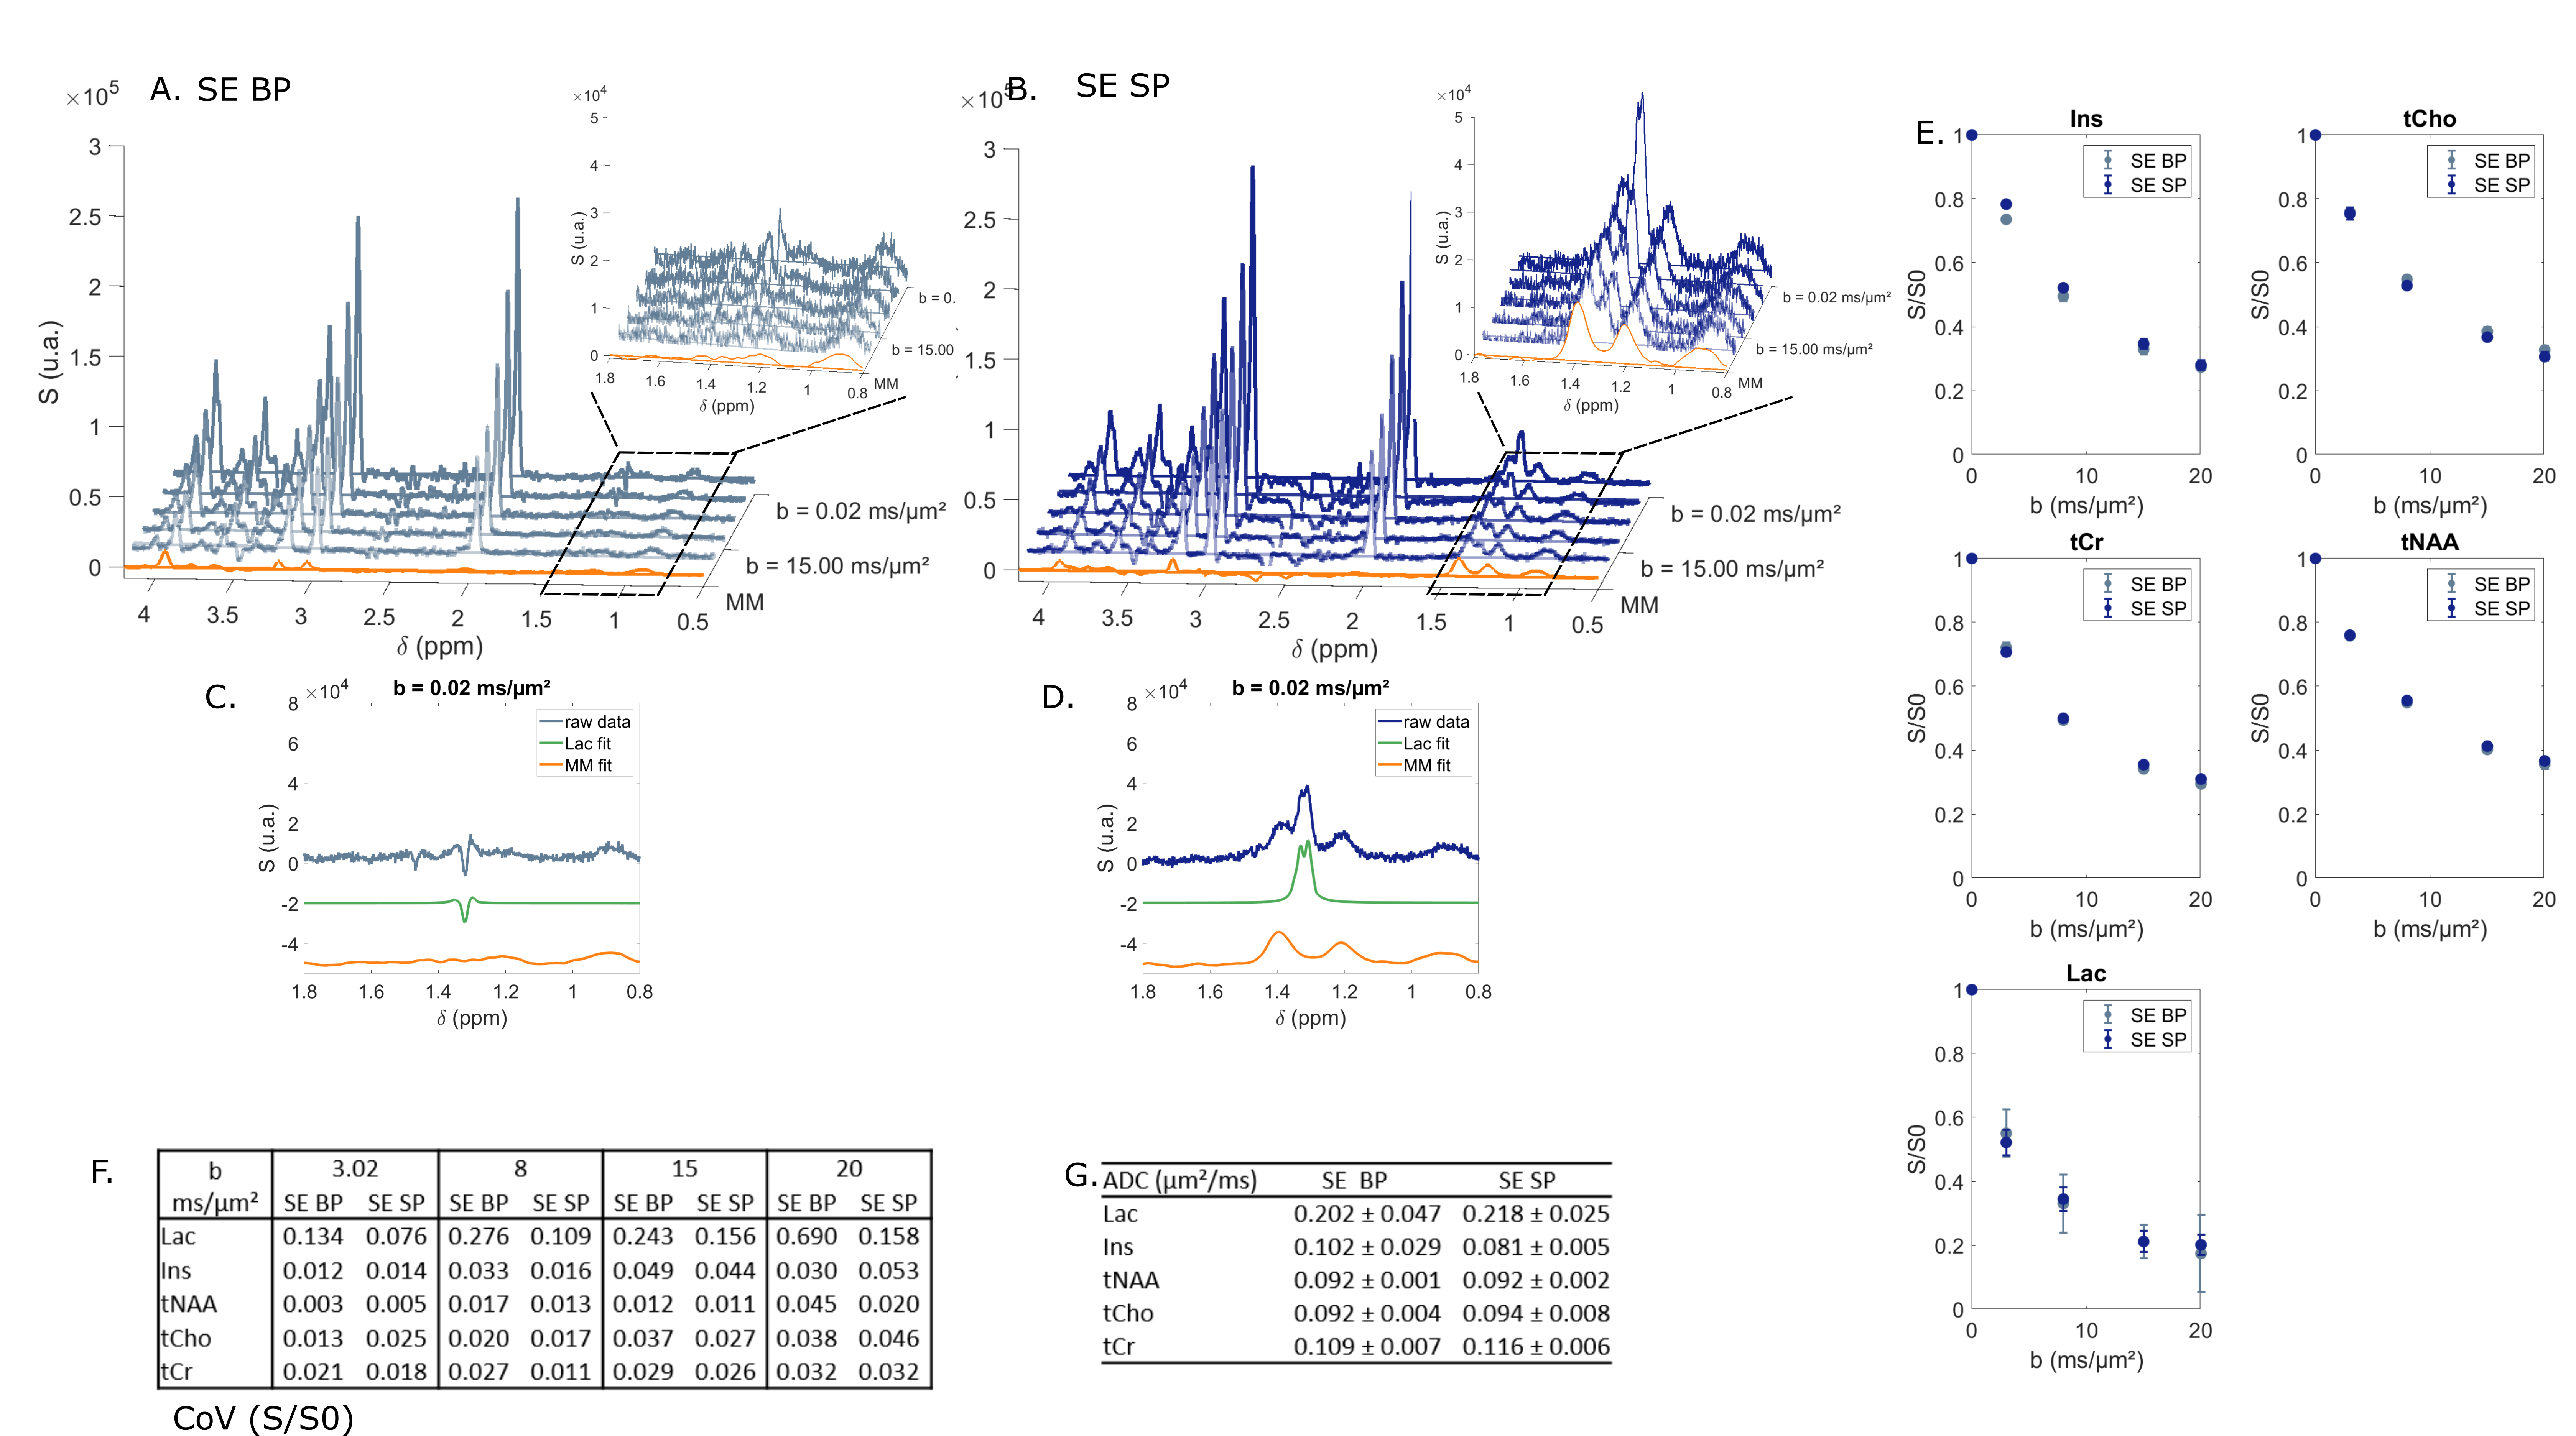
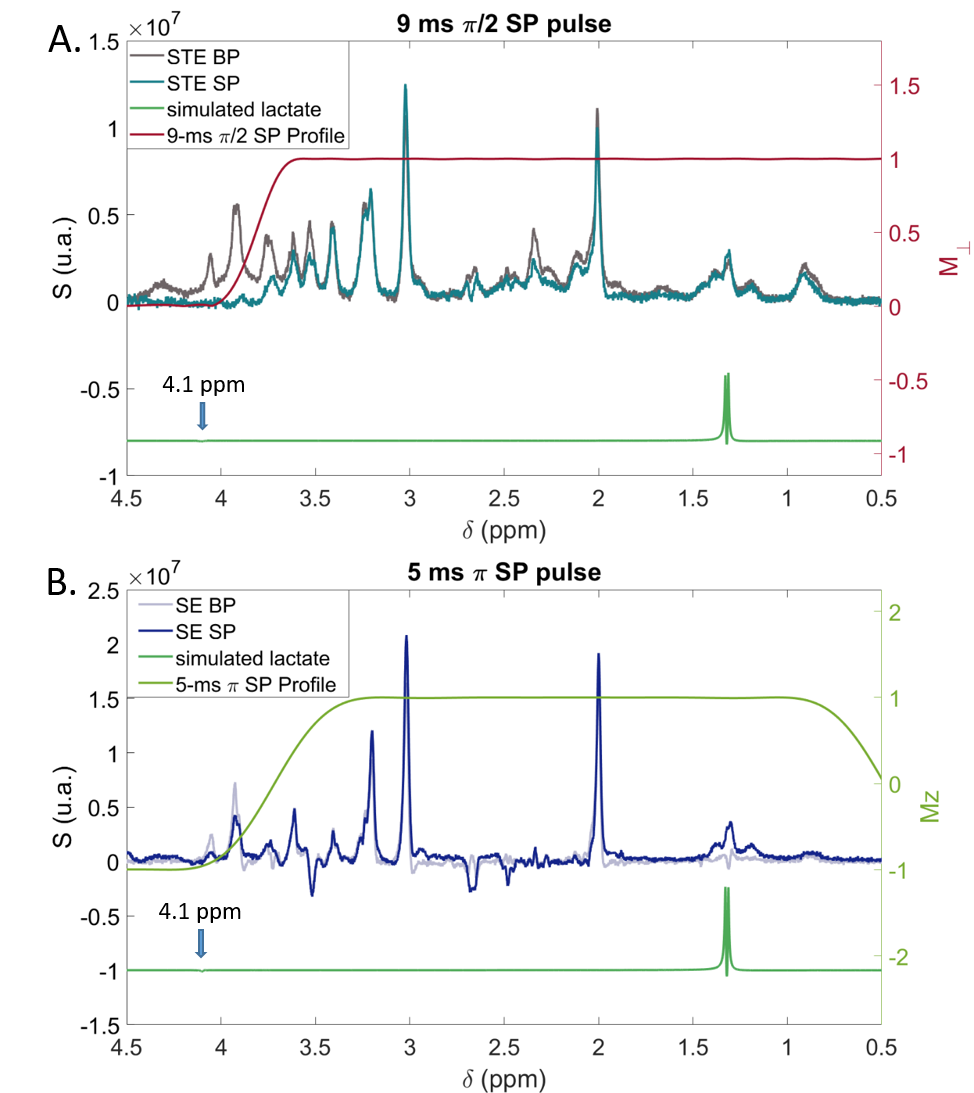
STE comparison demonstrates the selectivity of $$$\frac{\pi}{2}$$$ SP pulses over the [4; 0.5] ppm range (Fig. 2A-B). CH3 lactate peak at 1.3 ppm is higher by ~40% in the selective case (Fig. 2C-D). Selective STE generally appears slightly more precise than non-selective STE when looking at S/S0 (Fig. 2E-F). However, ADC precision is very similar in both cases (Fig. 2G).In the SE case (Fig. 3), selection is effective in almost the same range than in the STE case. CH3 peak at 1.3 ppm is totally in-phase in the selective case, due to suppressed J-modulation. Measurement with SE SP is more precise (i.e. coefficient of variation of S/S0 is smaller) than with SE BP: (Fig. 3E). In addition, SE SP ADC is more precise than in other SE case for lactate and myo-inositol.
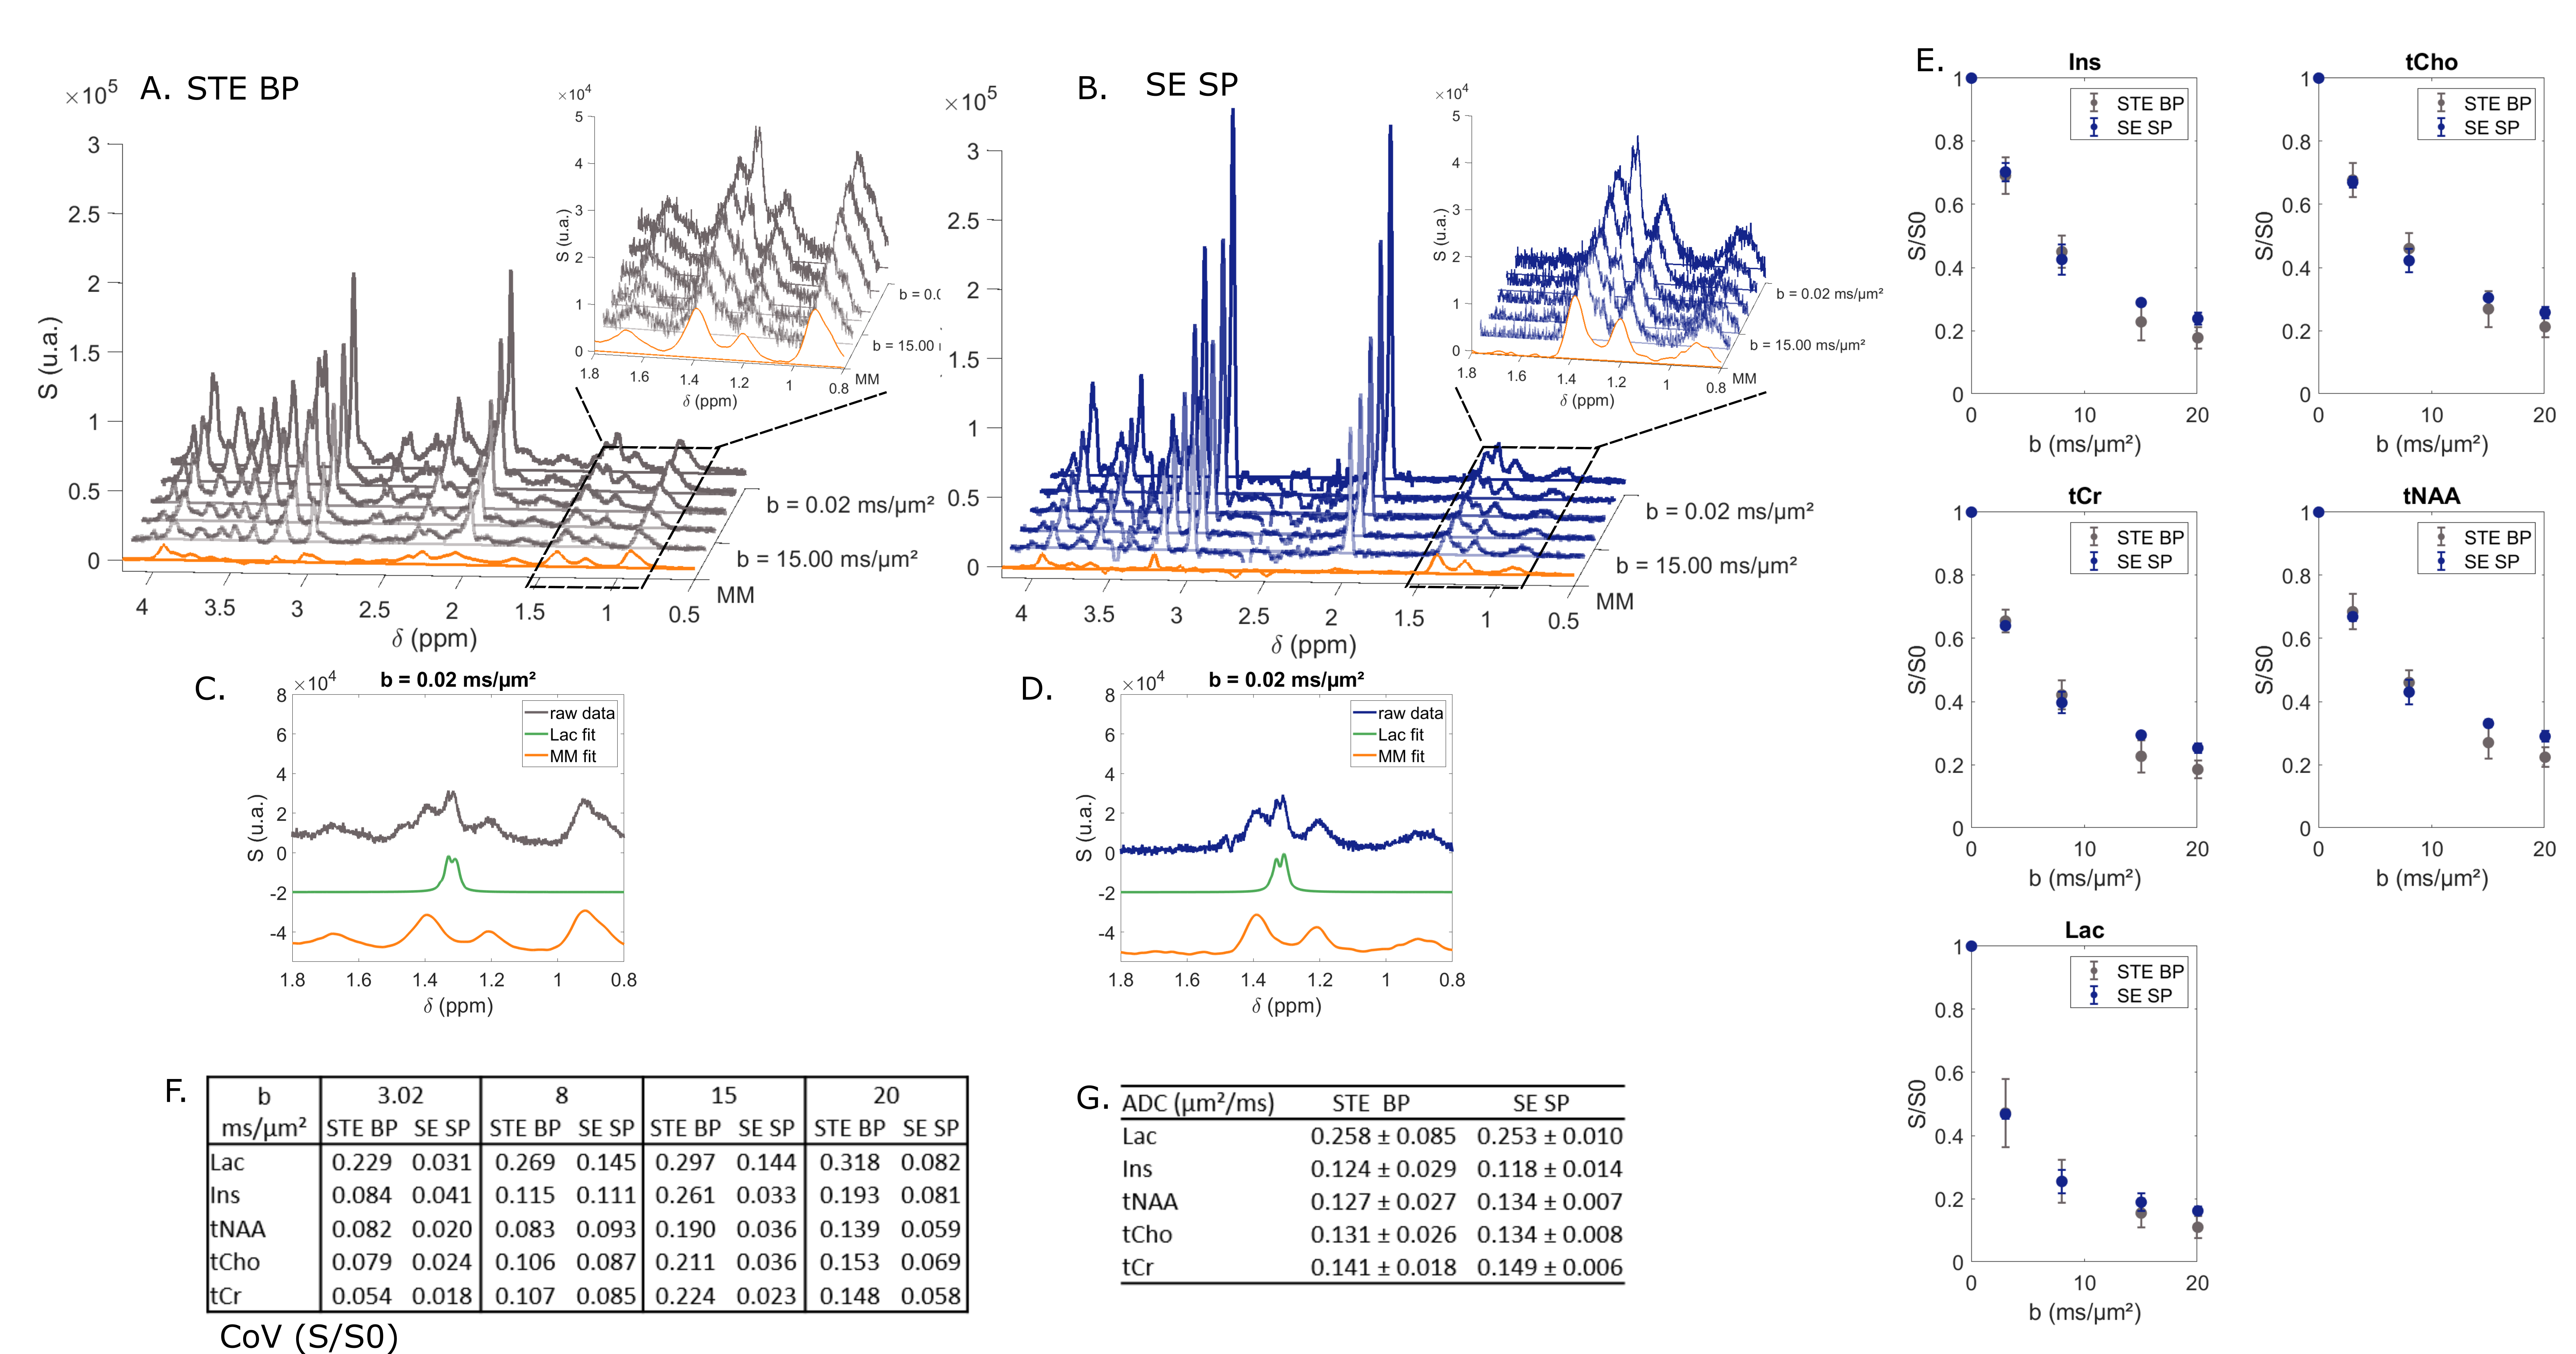
Finally, comparing selective SE to conventional STE BP, we do not observe a large rise of CH3 lactate peak at b = 0.02 ms/µm2 (Fig. 4C-D). Nevertheless, measurement precision with SE SP remains higher than in the STE case. From SE SP data, calculated ADC is much more precise than the one obtained from STE BP data.
DISCUSSION
Canceling J-modulation provides signal gain for the CH3 lactate peak at 1.3 ppm, which is particularly striking when comparing the two SE sequences. For the STE sequences, signal gain is mitigated by the long duration of SP pulses, which requires increased TE (3 times longer).Frequency profile of the 5-ms SP π pulse is slightly worse than that of the 9-ms SP $$$\frac{\pi}{2}$$$ pulse. The transition band begins around 4.1 ppm (Fig. 5B), so some residual J-coupling still occurs for lactate, which can be worsened by B1 inhomogeneity.
However, SE SP still provides the best measurement precision for lactate and other metabolites, even at high b. ADC is also evaluated more precisely with this sequence. Hence, SE SP has significant potential for diffusion measurement due to increased lactate signal, while still retaining signal for a large number of other metabolites at the same time (unlike polychromatic pulses that could also increase lactate signal at 1.3 ppm but would suppress most other metabolite resonances9).
CONCLUSION
Using selective pulses allows increasing lactate signal while retaining most spectral information about other metabolites. In the end, spin echo using SP seems the best option to precisely measure lactate diffusion at high b-values. This method could be very useful to perform DW-MRS to assess lactate compartmentation in brain.Acknowledgements
This project has received funding from the European Research Council (ERC) under the European Union’s Horizon 2020 research and innovation programmes (grant agreement No 818266).References
1. Pellerin L and Magistretti J, Glutamate uptake into astrocytes stimulates aerobic glycolysis: A mechanism coupling neuronal activity to glucose utilization. Proc. Natl. Acad. Sci. USA. 1994; 91: 10625-10629.
2. Bélanger M, Allaman I and Magistretti J, Brain Energy Metabolism: Focus on Astrocyte-Neuron Metabolic Cooperation. Cell Metab. 2011; 14: 724-738.
3. Ronen I and Valette J, Diffusion-Weighted Magnetic Resonance Spectroscopy. eMagRes.2015;4:733-949.
4. Ligneul et al., Diffusion-weighted magnetic resonance spectroscopy enables cell-specific monitoring of astrocyte reactivity in vivo. Neuroimage. 2019; 191: 457-469.
5. Ligneul C, Palombo M, Valette J. Metabolite diffusion up to very high b in the mouse brain in vivo: Revisiting the potential correlation between relaxation and diffusion properties. Magn Reson Med. 2017; 77(4): 1390-1398.
6. Pauly J, Parameter Relations for the Shinnar-Le Roux Selective Excitation Pulse Design Algorithm. IEEE TRANSACTIONS ON MEDICAL IMAGING.1991; 10(1): 53-65.
7. Provencher S W, Estimation of Metabolite Concentrations from Localized in Vivo Proton NMR Spectra. MRM.1993;30:672-679.
8. Hahn E L, Spin Echoes. Phys. Rev. 1950; 80: 580.
9. Shemesh N, Rosenberg J, Dumez JN et al. Metabolic properties in stroked rats revealed by relaxation-enhanced magnetic resonance spectroscopy at ultrahigh fields. Nat Commun.2014; 5: 4958.
Figures