0285
GABA measurement at 7T: short-TE or MEGA editing?1CIBM Center for Biomedical Imaging, Lausanne, Switzerland, 2Animal Imaging and Technology, EPFL, Lausanne, Switzerland
Synopsis
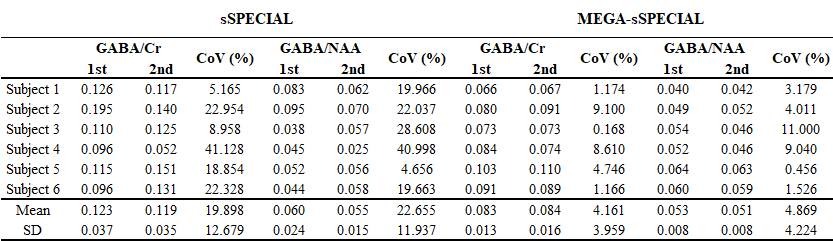
The purpose of the study is to compare short-TE and MEGA editing methods and verify reproducibility of GABA measurement in the motor cortex at 7T. The measured average GABA/Cr and GABA/NAA ratios were 0.121 ± 0.034 and 0.057 ± 0.019 respectively for short-TE sSPECIAL measurement and 0.083 ± 0.014 and 0.052 ± 0.008 respectively for MEGA-sSPECIAL sequence. 6 healthy volunteers were scanned two times and average coefficient of variances were 21.2 ± 11.8 % for short-TE measurement and 4.5 ± 3.9 for MEGA-sSPECIAL sequence.
Introduction
g-aminobutyric acid (GABA) in vivo measurement by 1H MRS is suffered by its low signal intensity, overlapping peaks with highly concentrated metabolites. Even though its important role in central nervous system regulation as the primary inhibitory neurotransmitter and a promising biomarker in various neuronal diseases, a robust measurement of GABA is still challenging. At 3T and lower magnetic field, spectral editing methods are often used to measure GABA. At 7T, with the improved spectral dispersion and SNR, the question to be addressed is whether a short-TE method could provide sufficiently reliable GABA measurement as spectral editing methods. In this study, test-retest measurements were performed with a short-TE method (sSPECIAL)1 and a newly implemented GABA-editing sequence (MEGA-sSPECIAL) to compare the reliability of GABA measurement at 7T.Methods
Six healthy volunteers (age : 21-33; 5 male and 1 female) were scanned two times and written informed consent under the approval of the swiss cantonal ethics committee was provided. All MR data acquisitions were performed on a 7T/68cm MR scanner (Magnetom, Siemens Medical Solutions, Erlangen, Germany) with a single-channel quadrature transmitter and a 32-channel receiver coil (Nova Medical Inc., MA, USA). The first- and second-order B0 shims were performed with FAST(EST)MAP . The voxel reference images were acquired using MP2RAGE2 (TR/TE = 6000/4.94 ms, TI1/TI2 =800/2700 ms, slice thickness = 0.6 mm, field of view = 192×192 mm2, and matrix size = 256×256). Localized single-voxel spectroscopy data from the motor cortex were acquired by sSPECIAL sequence (TE=16ms, TR=4000ms) and MEGA-sSPECIAL sequence using following parameters (TR/TE = 4000/80 ms, average = 128, number of data points = 2048, spectral width = 4000 Hz, volume of interests = 30×20×20 mm3) interleaved with VAPOR water suppression and lipid suppression using OVS bands. For the editing sequence, the asymmetric adiabatic and narrow gaussian pulses were used3. The in vivo data were processed using FID-A toolkit pipeline4. Zero filling or line-broadening was not applied to the data. All spectra were fitted using LCModel with a simulated basis set. White and gray matter composition of the voxel and T2 differences of metabolites were considered to correct GABA level.Results
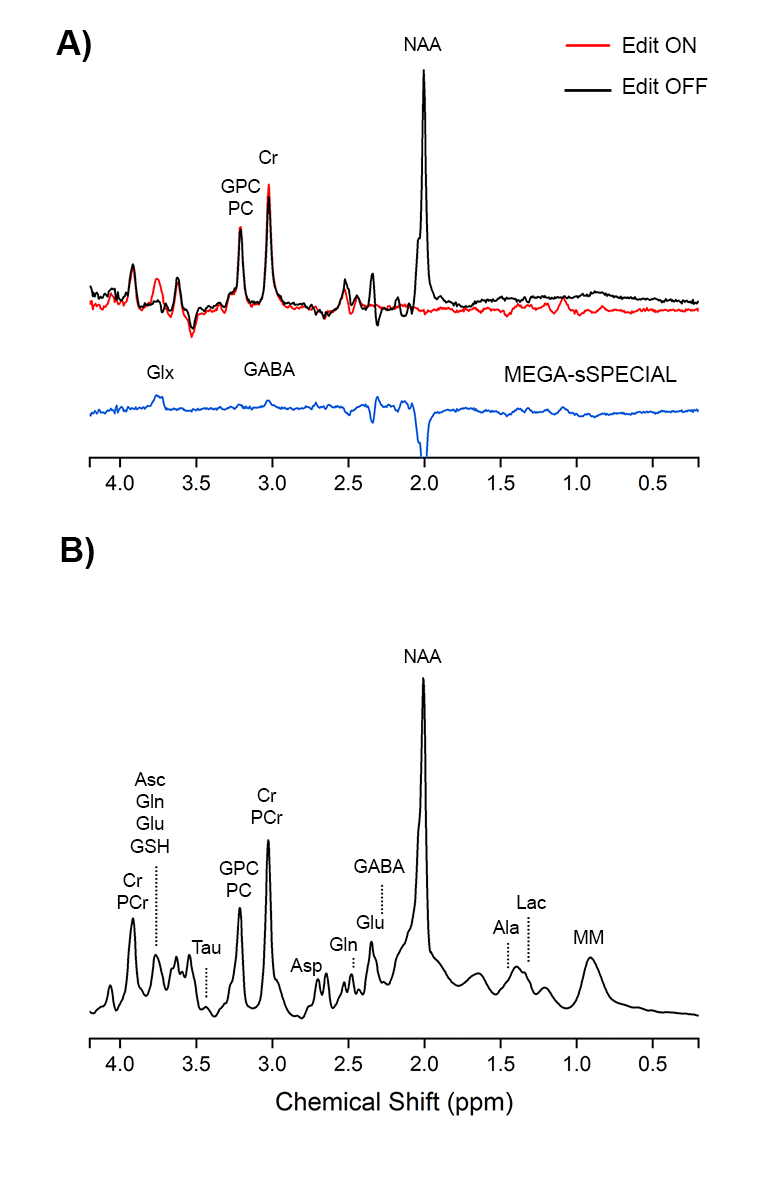
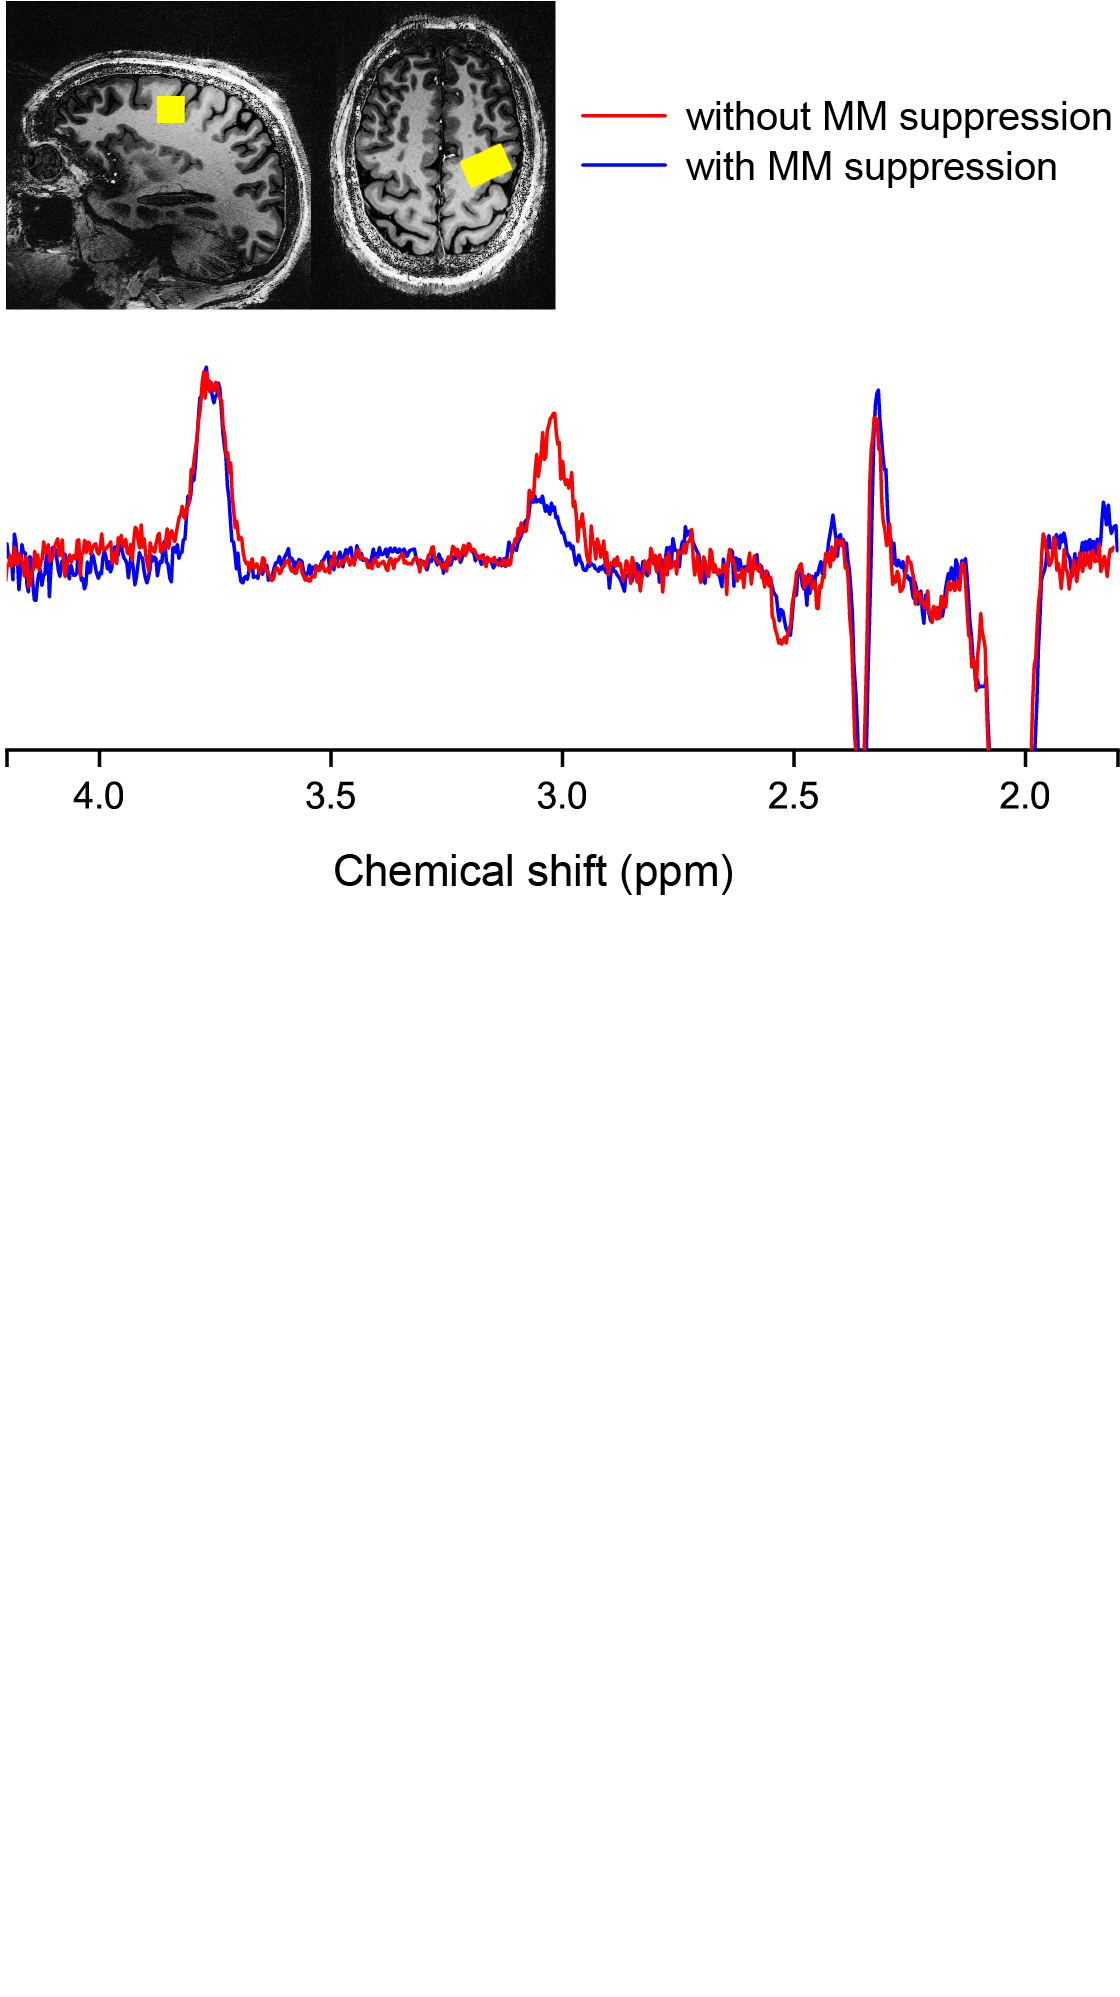
The measured water linewidth was 11.83± 0.61Hz. The average tissue composition in the target area was 0.304 (gray matter), 0.685 (white matter), and 0.011 (cerebrospinal fluid). Figure 1 illustrates the representative spectra acquired by MEGA-sSPECIAL and sSPECIAL sequences. Two sub-spectra of MEGA-editing spectra were well aligned with each other and the choline peak was completely subtracted. Figure 2 shows the difference between MM suppressed and MM unsuppressed data acquired using MEGA-sSPECIAL sequence with and without MM suppression pulse (highly selective gaussian pulse transmitted at 1.7 ppm). Table 1 shows metabolite ratios and reproducibility results. The measured average GABA/Cr and GABA/NAA ratios were 0.121 ± 0.034 and 0.057 ± 0.019 respectively for sSPECIAL measurement and 0.083 ± 0.014 and 0.052 ± 0.008 respectively for MEGA-sSPECIAL sequence.Discussion and Conclusion
In this study, MEGA-sSPECIAL and sSPECIAL method were evaluated for GABA measurement reproducibility in the motor cortex at 7T. MEGA-sSPEICAL sequence demonstrated much higher reproducibility with a mean CoV of 4-5%, while sSPECIAL has a mean CoV of 20-23%. We conclude that at 7T, spectral editing method is still a more sensitive method to study GABA changes with its high reproducibility relative to short TE type of method. However, due to the use of long TE in editing method, the potential changes in T2 relaxation time should be taken into account to avoid the effect on GABA measurement.Acknowledgements
This work was supported by the Swiss National Science Foundation (grants n° 320030_189064). We acknowledge access to the facilities and expertise of the CIBM Center for Biomedical Imaging, a Swiss research center of excellence founded and supported by Lausanne University Hospital (CHUV), University of Lausanne (UNIL), Ecole polytechnique fédérale de Lausanne (EPFL), University of Geneva (UNIGE) and Geneva University Hospitals (HUG).References
1. Xin L, Schaller B, Mlynarik V, Lu H, Gruetter R. Proton T1 relaxation times of metabolites in human occipital white and gray matter at 7 T. Magn. Reson. Med. 2013;69:931–936 doi: 10.1002/mrm.24352.
2. Marques JP, Kober T, Krueger G, van der Zwaag W, Van de Moortele PF, Gruetter R. MP2RAGE, a self bias-field corrected sequence for improved segmentation and T1-mapping at high field. Neuroimage 2010;49:1271–1281 doi: 10.1016/j.neuroimage.2009.10.002.
3. Song-I Lim, Lijing Xin, Improved GABA editing and macromolecule suppression with adiabatic and highlyselective Gaussian pulses at 7T. ISMRM & SMRT Virtual Conference & Exhibition08-14 August 2020.
4. Simpson R, Devenyi GA, Jezzard P, Hennessy TJ, Near J. Advanced processing and simulation of MRS data using the FID appliance (FID-A)—An open source, MATLAB-based toolkit. Magn. Reson. Med. 2017;77:23–33 doi: 10.1002/mrm.26091.
Figures