0284
Quantification of Human Brain Metabolites using Two-Dimensional J-Resolved Metabolite-Cycled semiLASER at 9.4 T1High Field Magentic Resonance, Max Planck Institute for Biological Cybernetics, Tuebingen, Germany, 2Faculty of Science, University of Tuebingen, Tuebingen, Germany, 3IMPRS for Cognitive Neuroscience, Tuebingen, Germany, 4Advanced Imaging Research Center, UT Southwestern Medical Center, Dallas, TX, United States
Synopsis
Crowded proton spectra with severely overlapped J-coupled resonances pose a challenge in the reliable quantification of metabolites in the human brain. Several advanced techniques such as editing methods, multi-dimensional spectroscopy methods, sophisticated processing or quantification pipelines were proposed in the past. In this work, we present a two-dimensional metabolite-cycled semiLASER technique at 9.4 T with maximum echo sampling scheme. This method helps well resolve the J-coupled peaks and clearly distinguish them. 2D spectral fitting is performed using ProFit2.0 and the metabolites are quantified using internal water referencing after correcting the fitted concentration for tissue content and relaxation effects.
Purpose
Reliable quantification of metabolites in the human brain has always been one of the prime aims of the magnetic resonance spectroscopy (MRS) community to understand metabolic processes and changes in them during various pathologies1. Consequently, there is constant development in better localization and quantification techniques. Bringing together the advantages of ultra-high field and two-dimensional J-resolved spectroscopy, here we performed quantitative 2D J-resolved semiLASER localization at 9.4 T in a voxel in the occipital lobe of the human brain. Furthermore, we quantified 16 metabolites in mmol/kg using the internal water referencing method2.Methods
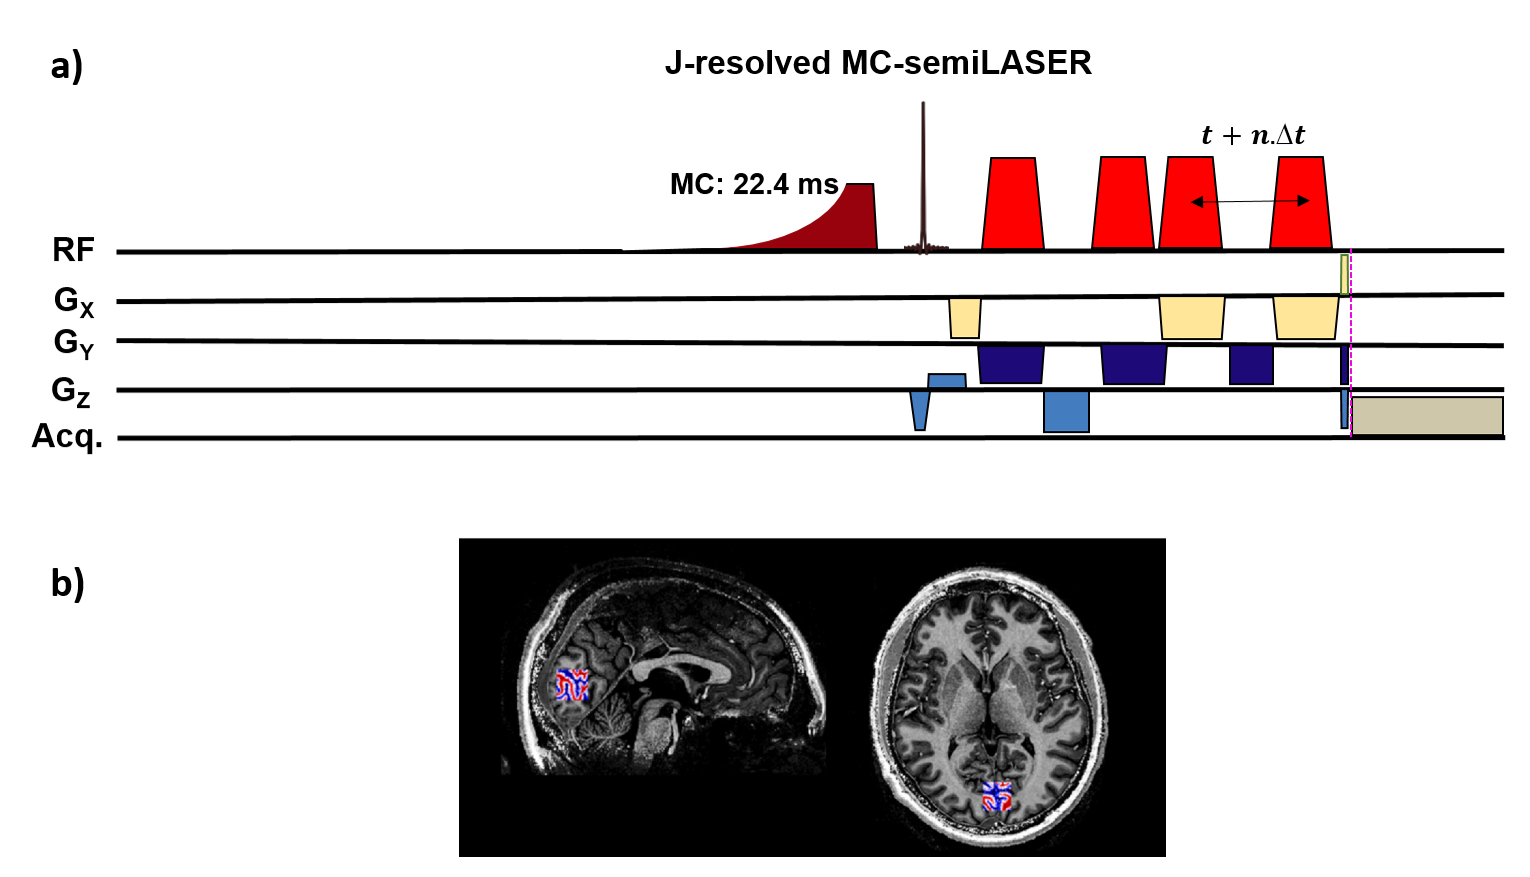
All experiments were performed on a 9.4T Siemens Magnetom whole-body MRI scanner (Erlangen, Germany). A home-built 8Tx16Rx coil3 was used in surface coil transmit mode for spectroscopy experiments driving power only to the bottom three channels, while receiving signal with all channels. A 2D J-resolved metabolite-cycled4 semiLASER sequence (Figure 1a) was implemented and optimized using phantom experiments. Ten healthy volunteers participated in this study after providing written informed consent. A GM-rich 2×2×2 cm3 voxel was chosen in the occipital lobe (Figure 1b). FASTESTMAP5 was used to shim and power calibration6,7 was performed on the voxel of interest. Spectra were then acquired using 2D J-resolved MC semiLASER (TR:6000 ms, TEstart:24 ms, TE steps $$$∆t$$$:2ms, number of TE steps $$$n$$$:85, TElast:194 ms, Averages per TE:8, Transmitter reference frequency:2.4 ppm).Water reference scans with the same acquisition parameters as metabolite spectra (except Averages per TE:1 and Transmitter reference frequency:4.7 ppm) were acquired.
2D J-resolved macromolecule (MM) spectra were acquired from 5 healthy volunteers using a double inversion recovery8 2D J-resolved MC semiLASER sequence (TR:8000 ms, TEstart:24 ms, $$$∆t$$$: 2ms, $$$n$$$:60, TElast:144 ms, Averages per TE:8, Transmitter reference frequency: 2.4 ppm, Bandwidth:8000 Hz) with TI1/TI2=2360/625 ms respectively.
Both metabolite and MM data were preprocessed in a similar fashion as described in Murali-Manohar et al9., taking into account $$$n$$$ of 85 and 60 respectively. Additionally zeroth and first order phase correction were performed in the preprocessing part of the ProFit10,11 tool.
MP2RAGE12 images were acquired by driving power to all eight channels. Tissue segmentation was performed using SPM1213.
Metabolite basis sets for N-acetyl-aspartate (NAA), N-acetyl-aspartyl-glutamate (NAAG), γ‐aminobutyric acid (GABA), aspartate (Asp), creatine (Cr), glutamate (Glu), glutamine (Gln), glutathione (GSH), glycerophosphocholine (GPC), glucose (Glc), glycine (Glyc), myo‐inositol (mI), scyllo‐inositol (Scy), lactate (Lac), phosphocreatine (PCr), phosphocholine (PCho), phosphoethanolamine (PE), and taurine (Tau) were simulated using VesPA14 for semiLASER sequence (85 TEs) including real pulse shapes. GPC, PCho and PE combined together is denoted by tCho. The sum of experimentally acquired MM spectra was included in the basis set to account for the MM contribution in the fitting of metabolite spectra.
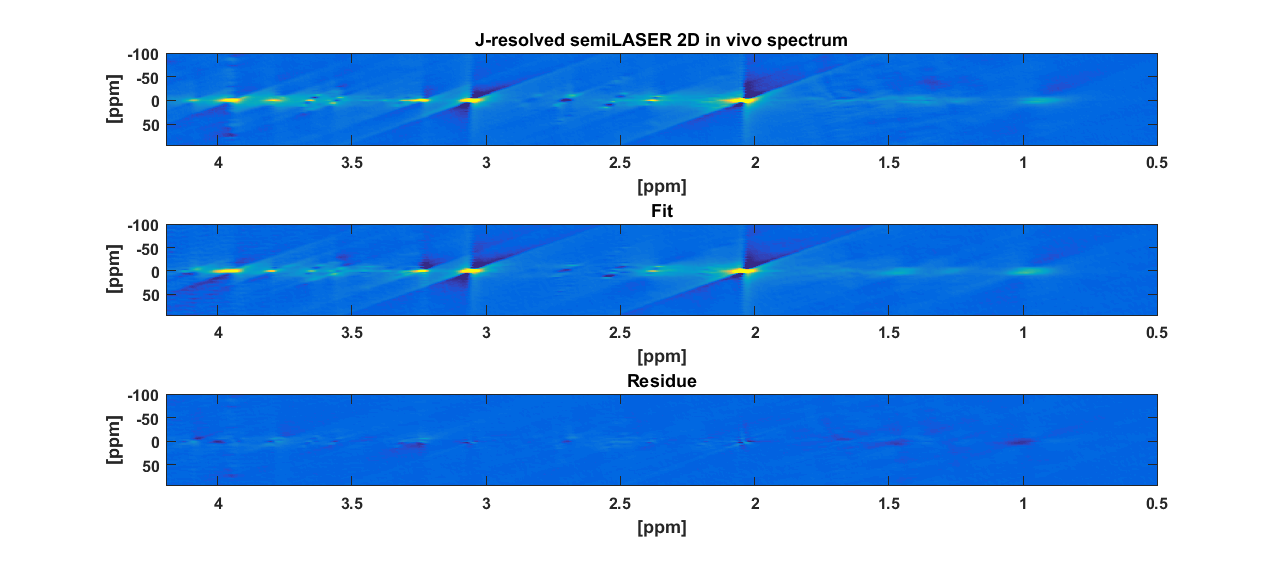
The 2D metabolite spectra were then fitted using ProFit 2.015 after Fourier transformation in both direct (f2) and indirect (f1) dimensions. Quantification of metabolites was performed using internal water referencing2. The fitted metabolite concentrations were corrected for tissue content, and T1 and T2 relaxation times of both water and metabolites. Final quantification results are reported in mmol/kg.
Results
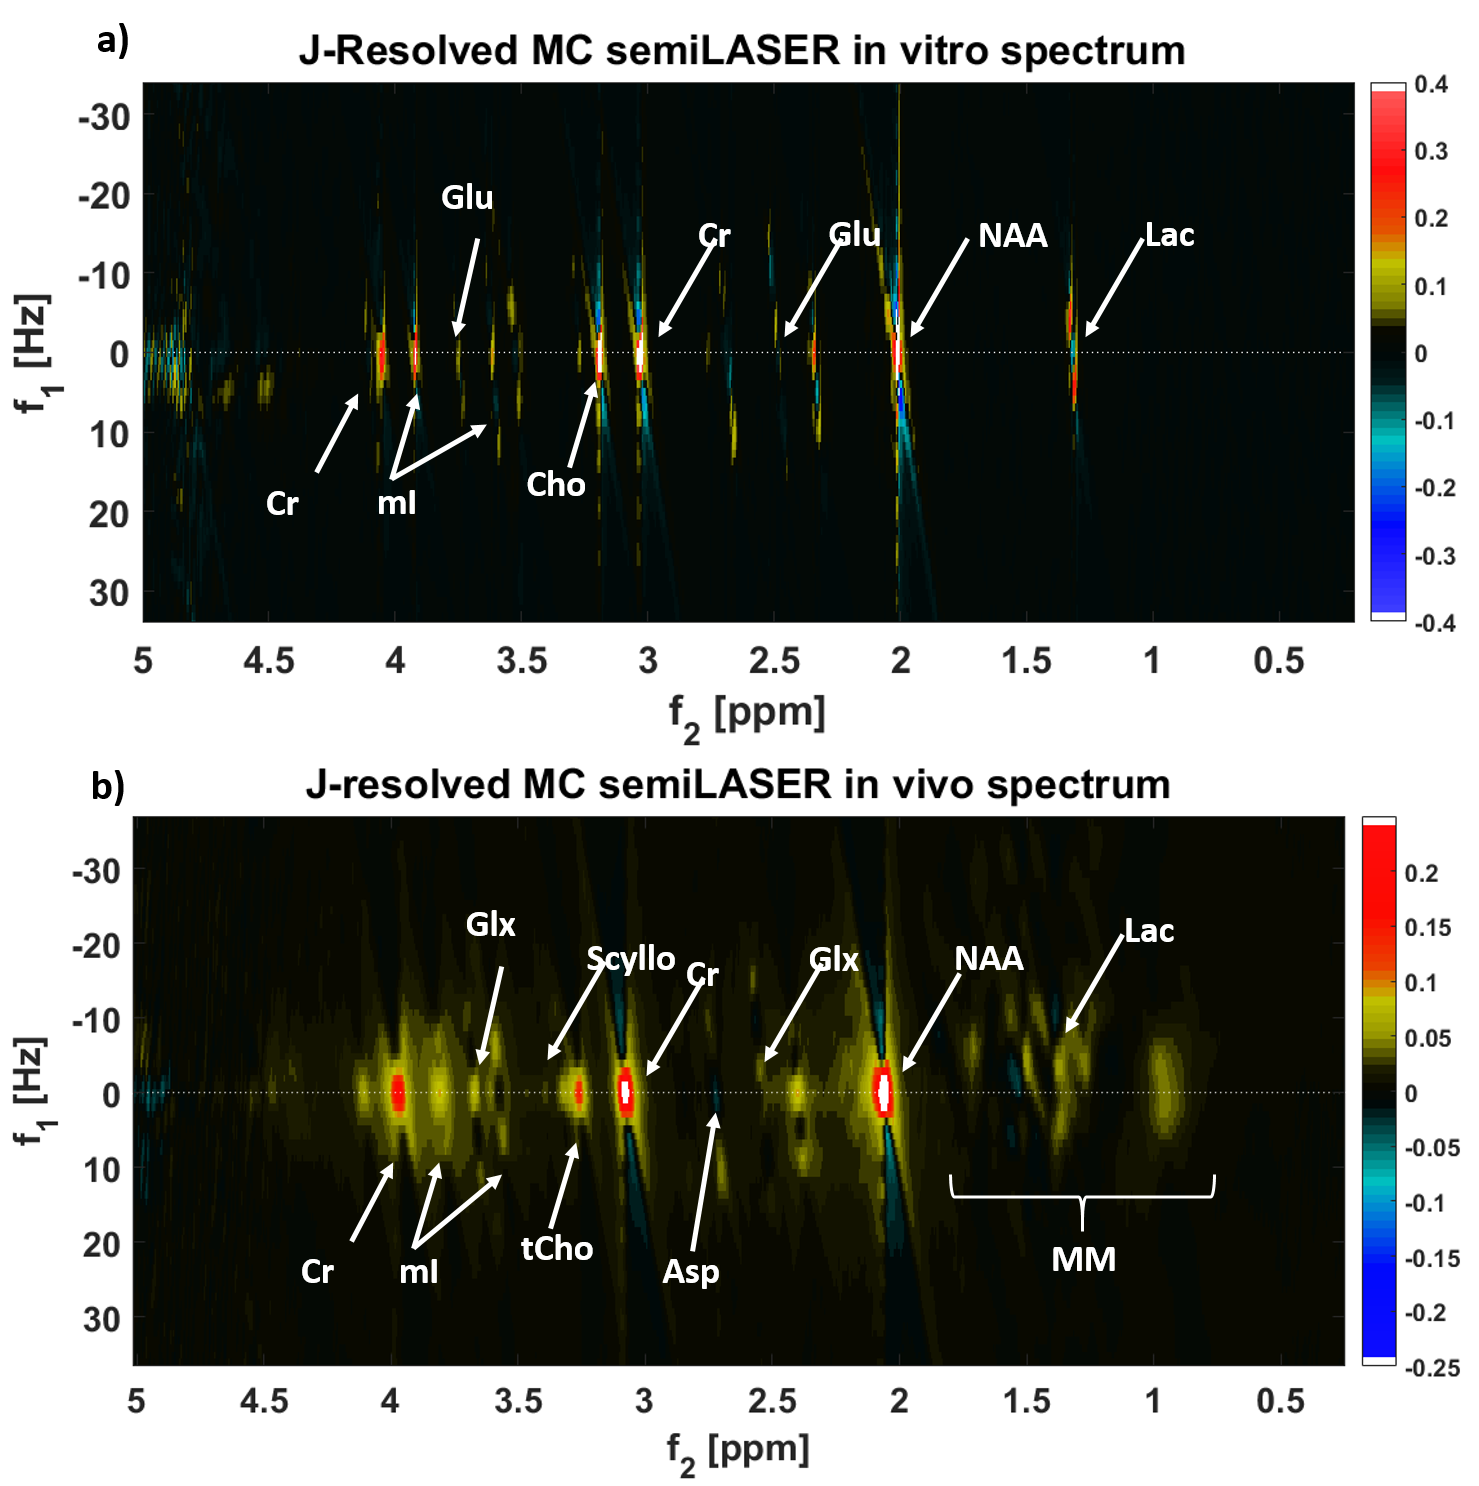
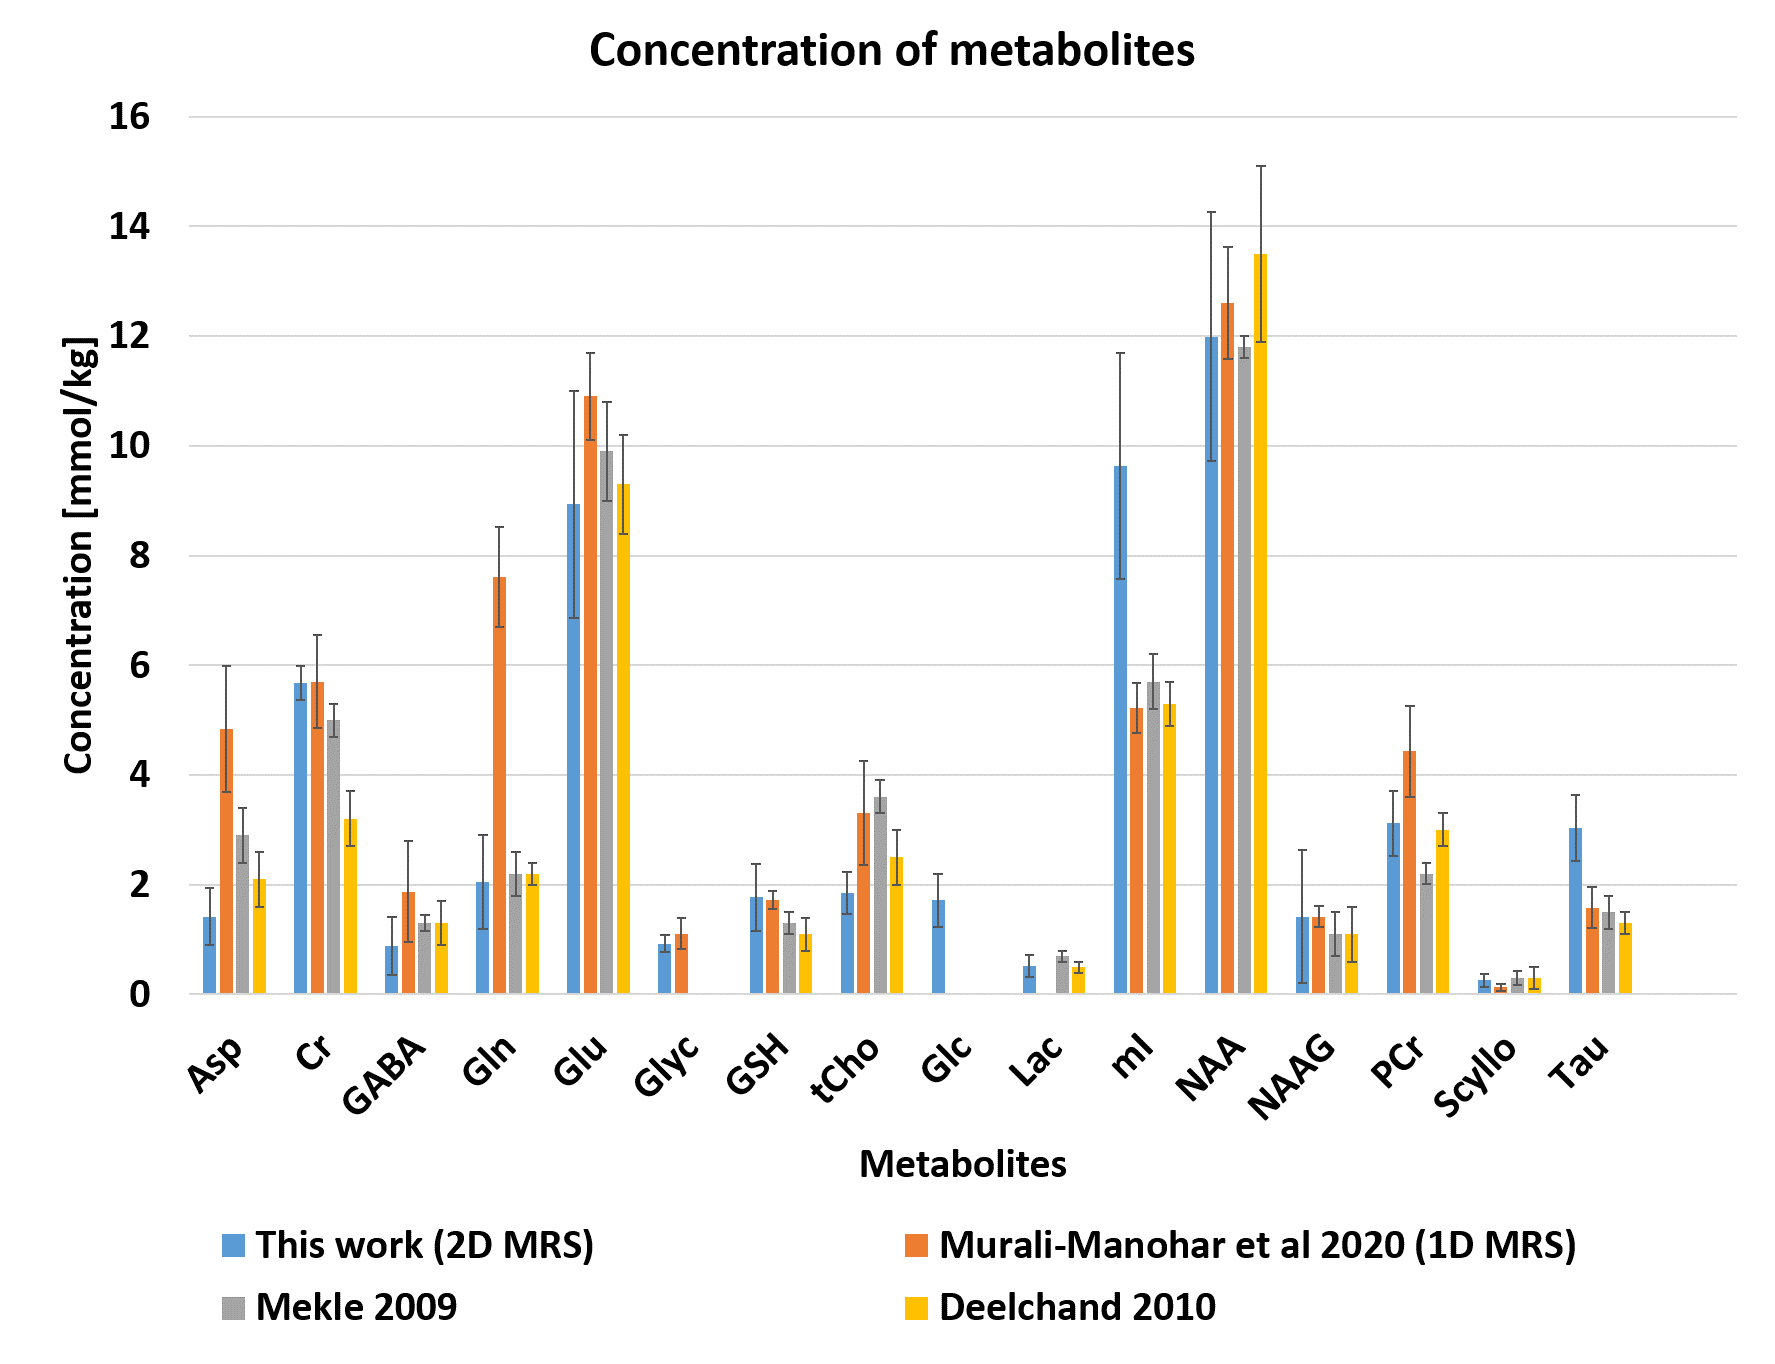
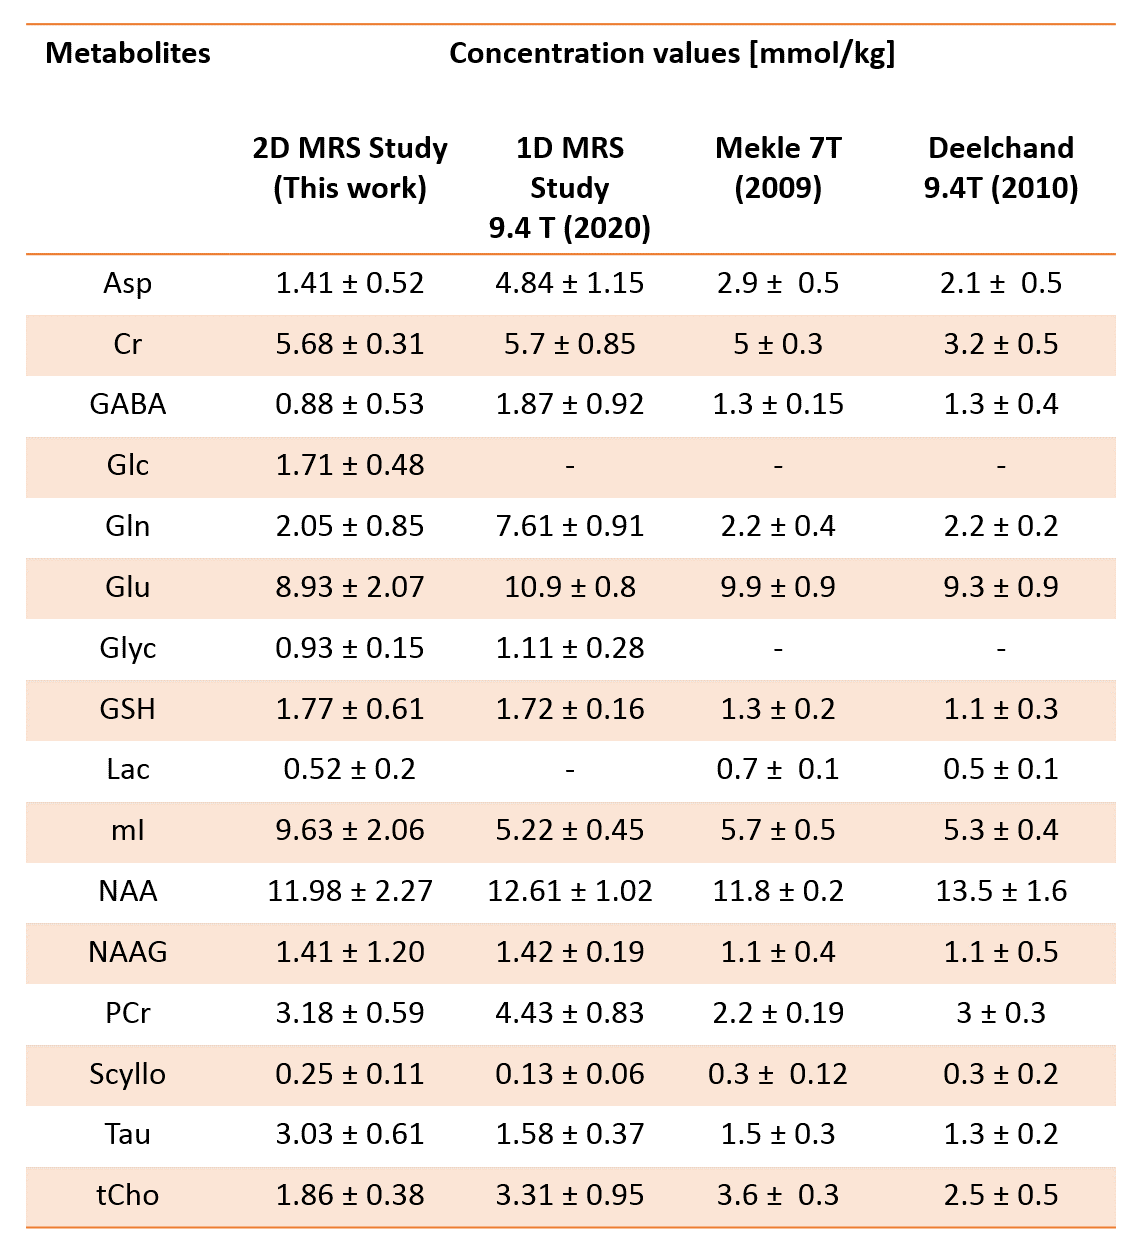
Figure 2a shows the 2D J-resolved spectrum acquired at 9.4T from the Braino phantom. The peaks are well-resolved and due to the small chemical shift displacement (1.5% for NAA peak (2.008 ppm), 5% for Lac (1.31 ppm) and 9% for mI (4.05 ppm) with respect to Transmitter reference frequency:2.4 ppm) resulting from semi-LASER there are barely any J-refocused peaks16,17 present. A 2D J-resolved MC semiLASER spectrum from a representative subject is shown in Figure 2b. Spectra from all the healthy volunteers had a similar quality without any artifacts. The SNR of the NAA peak at 2.008 ppm is 906 ± 147 with respect to the noise window from -4.0 to -1.0 ppm. A representative metabolite spectral fit is shown in Figure 3. The minimum residual shows the good quality of fit. The fit quality was similar for all the datasets. Finally, Figure 4 shows a bar plot of concentrations of metabolites calculated in mmol/kg and Table 1 compares the quantification results in mmol/kg with previous literatures9,18,19.Discussion
As seen from Figure 2a, the use of an adiabatic (bandwidth: 8000 Hz) localization technique resulted in minimization of J-refocused peaks16,17 due to minimized chemical shift displacement. Consequently, the J-resolved peaks have maximum possible intensity, which leads to more accurate detection of J-coupled metabolites. This study quantifies and reports concentration values of 16 metabolites in mmol/kg using a 2D J-resolved localization technique at 9.4T in the human brain for the first time. The calculated millimolal concentration values lie within the range of values that are reported in previous literature18,20–22 for all metabolites except for Tau and mI due to a possible oppositely phased residual mI peak in the experimental MM spectra23. Therefore, removal of the residual mI peaks in the 2D MM spectra is necessary in the future for accurate estimation of mI and Tau concentrations. For metabolites such as Asp, GABA, and Gln, the values from this study are closer to previous literature values18–22 when compared to results of the previous 1D MRS study9. Moreover, the 2D MRS technique could decently quantify Glc and Lac that are otherwise challenging to quantify in 1D MRS studies even at 9.4 T.Acknowledgements
This project was co-sponsored by Horizon 2020/ CDS-QUAMRI (634541), SYNAPLAST (679927) and CPRIT (RR180056) grants.References
1. Öz G, Alger
JR, Barker PB, et al. Clinical proton MR spectroscopy in central nervous system
disorders. Radiology. 2014;270(3):658-679.
2. Gasparovic C, Song T, Devier D, et al. Use of tissue water as a concentration reference for proton spectroscopic imaging. Magn Reson Med. 2006;55(6):1219-1226.
3. Avdievich NI, Giapitzakis I-A, Pfrommer A, Henning A. Decoupling of a tight-fit transceiver phased array for human brain imaging at 9.4T: Loop overlapping rediscovered. Magn Reson Med. 2018;79(2):1200-1211.
4. Giapitzakis I, Shao T, Avdievich N, Mekle R, Kreis R, Henning A. Metabolite‐cycled STEAM and semi‐LASER localization for MR spectroscopy of the human brain at 9.4T. Magn Reson Med. 2018;79(4):1841-1850.
5. Gruetter R, Tkáč I. Field mapping without reference scan using asymmetric echo-planar techniques. Magn Reson Med. 2000;43(2):319-323.
6. Mekle R, Mlynárik V, Gambarota G, Hergt M, Krueger G, Gruetter R. MR spectroscopy of the human brain with enhanced signal intensity at ultrashort echo times on a clinical platform at 3T and 7T. Magn Reson Med. 2009;61(6):1279-1285.
7. Versluis MJ, Kan HE, van Buchem MA, Webb AG. Improved signal to noise in proton spectroscopy of the human calf muscle at 7 T using localized B 1 calibration. Magn Reson Med. 2010;63(1):207-211.
8. Giapitzakis IA, Avdievich N, Henning A. Characterization of macromolecular baseline of human brain using metabolite cycled semi-LASER at 9.4T. Magn Reson Med. 2018;80(2):462-473.
9. Murali‐Manohar S, Borbath T, Wright AM, Soher B, Mekle R, Henning A. T 2 relaxation times of macromolecules and metabolites in the human brain at 9.4 T. Magn Reson Med. 2020;84(2):542-558.
10. Schulte RF, Lange T, Beck J, Meier D, Boesiger P. Improved two-dimensionalJ-resolved spectroscopy. NMR Biomed. 2006;19(2):264-270.
11. Schulte RF, Boesiger P. ProFit: Two-dimentional prior-knowledge fitting of J-resolved spectra. NMR Biomed. 2006;19(2):255-263.
12. Hagberg GE, Bause J, Ethofer T, et al. Whole brain MP2RAGE-based mapping of the longitudinal relaxation time at 9.4T. Neuroimage. 2017;144:203-216.
13. Ashburner J, Barnes G, Chen C, et al. SPM12 Manual. Wellcome Trust Centre for Neuroimaging, London, UK; 2014.
14. Soher B, Semanchuk P, Todd D, Steinberg J, Young K. VeSPA: integrated applications for RF pulse design, spectral simulation and MRS data analysis. 19th Meet ISMRM, Montreal. 2011.
15. Fuchs A, Boesiger P, Schulte RF, Henning A. ProFit revisited. Magn Reson Med. 2014;71(2):458-468.
16. Edden RAE, Barker PB. If J doesn’t evolve, it won’t J-resolve: J-PRESS with bandwidth-limited refocusing pulses. Magn Reson Med. 2011;65(6):1509-1514.
17. Lin M, Kumar A, Yang S. Two-dimensional J-resolved LASER and semi-LASER spectroscopy of human brain. Magn Reson Med. 2014;71(3):911-920.
18. Mekle R, Mlynárik V, Gambarota G, Hergt M, Krueger G, Gruetter R. MR spectroscopy of the human brain with enhanced signal intensity at ultrashort echo times on a clinical platform at 3T and 7T. Magn Reson Med. 2009;61(6):1279-1285.
19. Deelchand DK, Moortele P-F Van de, Adriany G, et al. In vivo 1H NMR spectroscopy of the human brain at 9.4 T: Initial results. J Magn Reson. 2010;206(1):74-80.
20. Marjańska M, Auerbach EJ, Valabrègue R, Van de Moortele PF, Adriany G, Garwood M. Localized 1H NMR spectroscopy in different regions of human brain in vivo at 7T: T 2 relaxation times and concentrations of cerebral metabolites. NMR Biomed. 2012;25(2):332-339.
21. Mangia S, Tkáč I, Gruetter R, et al. Sensitivity of single-voxel 1H-MRS in investigating the metabolism of the activated human visual cortex at 7 T. Magn Reson Imaging. 2006;24(4):343-348.
22. Terpstra M, Ugurbil K, Tkac I. Noninvasive quantification of human brain ascorbate concentration using 1 H NMR spectroscopy at 7 T. NMR Biomed. 2010;23(3):227-232.
23. Murali‐Manohar S, Wright AM, Borbath T, Avdievich NI, Henning A. A novel method to measure T 1 ‐relaxation times of macromolecules and quantification of the macromolecular resonances. Magn Reson Med. 2021;85(2):601-614.
24. Wright A, Murali-Manohar S, Borbath T, Henning A. Longitudinal Relaxation Times of Metabolites in vivo at 9.4T. In: 27th Annu Meet Exhib Int Soc Magn Reson Med (ISMRM 2019). Montreal, QC, Canada; 2019.
Figures