0283
Diffusion-weighted Echo Planar Spectroscopic Imaging Using semi‐LASER Localization at 3T: A Pilot Study1Advanced Imaging Research Center, UT Southwestern Medical Center, Dallas, TX, United States, 2Radiology, UT Southwestern Medical Center, Dallas, TX, United States, 3Radiology, UCLA School of Medicine, Los Angeles, CA, United States
Synopsis
Diffusion-weighted spectroscopy (DW-MRS) is an excellent tool to explore the compartment specific assessment of tissue microstructure. Although there has been growing interest in DW-MRS for clinical applications, most of the studies involving human brain metabolites so far have used single-voxel methods, which limit its application to specific white matter tracts or arbitrarily selected regions of interest. There has been only a few attempts to evaluate the diffusion properties of brain metabolites with DW-MRSI. Here, we propose an echo planar-based diffusion-weighted spectroscopic imaging using semi-LASER localization and bipolar diffusion gradients. Initial results show good spectral quality and spatial localization.
Introduction:
Diffusion-weighted spectroscopy (DW-MRS) is an excellent tool to explore the diffusion properties of intracellular metabolites1,2 allowing compartment specific assessment of tissue microstructure. Combined with other imaging modalities such as DW-MRI, DW‐MRS has been shown to differentiate between axonal degeneration, glial activation, and demyelination3-5. Although there has been growing interest in DW‐MRS for clinical applications6-9, most of the studies involving human brain metabolite so far used single voxel methods, which limit its application to specific white matter tracts or arbitrarily selected regions of interest. There have been only few attempts to obtain maps of the diffusion properties of brain metabolites with DW-MRSI10-12. One of the reasons for this is the intrinsic low signal-to-noise ratio (SNR) of metabolites, especially at high diffusion-weightings; coupled with signal losses related to B1 field inhomogeneities and chemical shift displacement error. DW-MRS with semi-LASER localization and adiabatic selective refocusing pulses has been shown to minimize these signal losses and a recent study evaluated the feasibility of this method in a clinical setting13. In this study, we develop and evaluate the feasibility of an echo planar-based diffusion-weighted spectroscopic imaging using semi‐LASER localization (DW-sL-EPSI) at 3T, which uses pairs of bipolar diffusion gradients to measure the apparent diffusion coefficient (ADC) of metabolites.Materials and Methods:
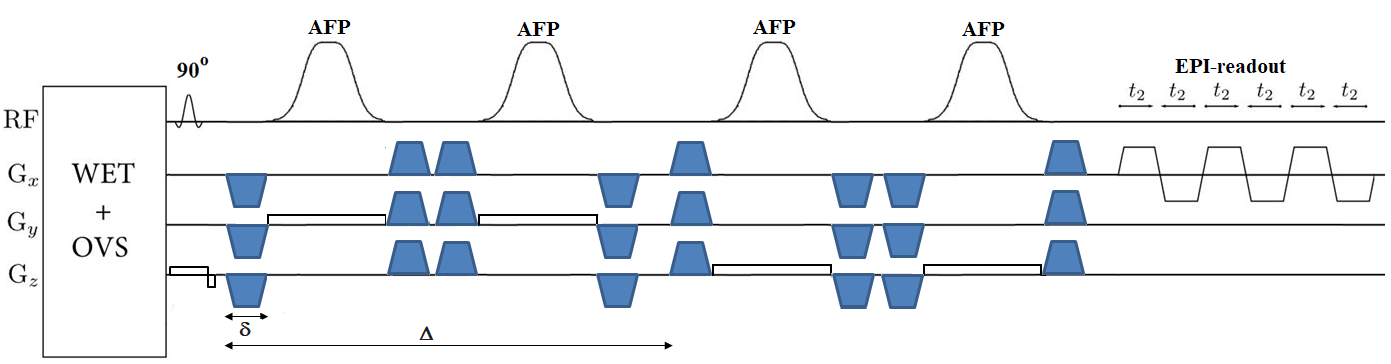
Figure 1 shows the schematic diagram of the DW-sL-EPSI sequence with diffusion sensitizing gradients (DSG) added in a bipolar configuration. A slice‐selective 90° pulse was used for excitation followed by two pairs of slice-selective adiabatic refocusing hyperbolic secant (HS) pulses. Eight bipolar diffusion-weighted gradients where applied around the four HS refocusing pulses in the three orthogonal directions simultaneously with 26.8 ms duration (δ), and 71 ms diffusion time (Δ). The bipolar gradient scheme helps to minimize eddy currents as well as cross terms between the diffusion gradients and gradients rising from inhomogeneities of the B0 field. Spatial-spectral encoding was performed using a series of EPI readout modules. Outer volume suppression and water suppression via WET were implemented using the standard pulse sequence components available.To examine the efficiency and reliability, brain phantom data were collected using the DW-sL-EPSI on a 3T Prisma MRI scanner equipped with a 16-channel head ‘receive’ coil. Following parameters were used: TE=120 ms, TR=2.5 ms, 1.5x1.5x2 cm3 voxel for VOI localization, 512 bipolar echo pairs, FOV = 16x16 cm2, 12 averages, spectral width 1190 Hz respectively. A non-water-suppressed scan with one average was also recorded for eddy current correction and estimation of coil sensitivities. For both water-suppressed and non-suppressed data, each gradient lobe was applied in 3 orthogonal gradient directions at 2 and 21 mT/m resulting in b = 36 and 3996 s/mm2. A non-zero b-value for the low b acquisition was used to assist suppressing unwanted echo pathways. The signal processing of DW-sL-EPSI data and spectral quantification based on peak integral was performed using a custom MATLAB (the Mathworks, Inc., Natick, MA) program. Metabolite and water ADCs were estimated from mono-exponential fits.
Results and Discussion:
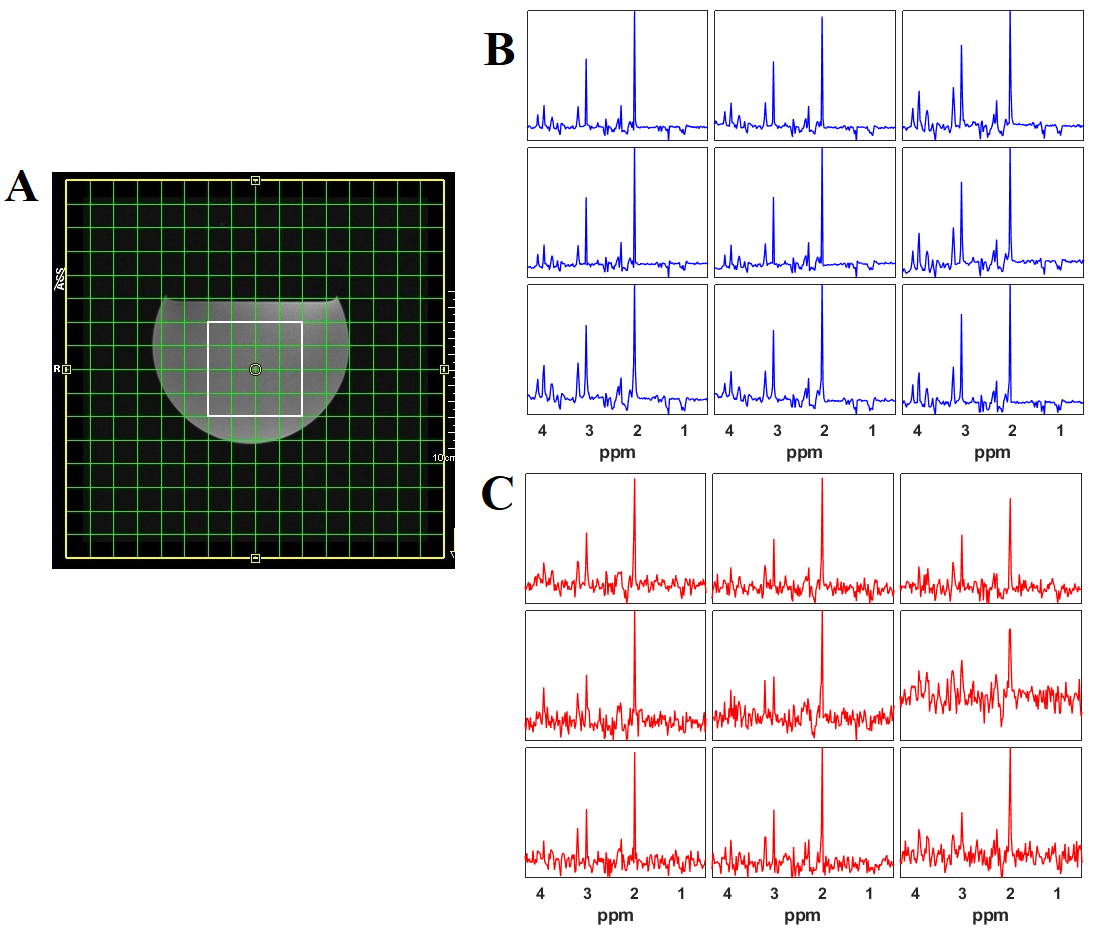
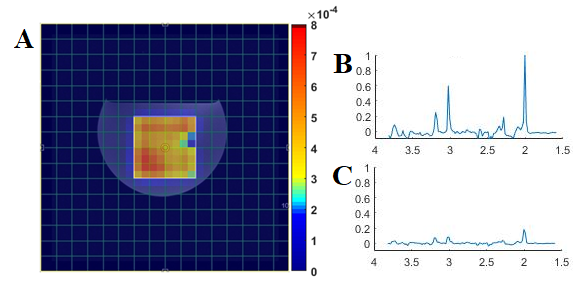
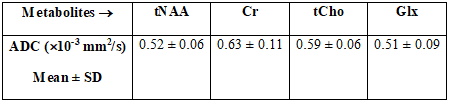
Figure 2(A) shows the T1-weighted localization image with VOI represented by a solid rectangle. Figure 2(B) and (C) shows the spectra obtained from the 3x3 voxel within the VOI. Even at high b-value of 3996 s/mm2, the quality of the MR spectra was sufficient to quantify the metabolites. There was no noticeable difference in the metabolite line shape, and the quality of the spectrum was sufficiently restored. Typical ADC maps for Glx (Glutamate + Glutamine) from a phantom measurement is shown in Figure 3(a). Metabolite ADC map was roughly homogeneous showing less variation in ADC estimation inside the VOI. Table 1 shows ADC values for – four metabolites, total N-Acetylaspartate (tNAA), total choline (tCho), creatine (Cr) and Glx – calculated from the DW-EPSI phantom experiments which ensured the accuracy of the DW-sL-EPSI results. The ADC values were consistent with previous studies6,10,14. This demonstrates feasibility of implementing DW-sL-EPSI with bipolar DSG and semi-LASER localization at 3T. As DSGs are applied only in a single direction, the present work does not provide rotationally invariant estimates of ADCs. Still, the DW-sL-EPSI results are in agreement with previous studies. One of the limitations of the current implementation is the long scan time that could limit clinical investigations. This can be overcome using accelerated imaging technique such as non-uniform sampling combined with compressed sensing and machine learning15,16.Conclusion:
Combining semi-LASER localization, echo planar readout and bipolar DSG, we have demonstrated the pilot feasibility of DW-sL-EPSI. While these initial results are promising, further optimization and validation with a large pool of human subjects is needed. Future work will address robust sampling and acceleration techniques.Acknowledgements
This research was supported by grants from 1) NIH/NHLBBI (5R01HL135562-03), and 2) a Breakthrough Step I grant from the US Congressionally Directed Medical Research Program (CDMRP)/ Breast Cancer Research Program (BCRP) (W81XWH-16-1-0524).References
1. Ronen I, Valette J. Diffusion-weighted magnetic resonance spectroscopy. eMagRes 2015;4:733–750.
2. van der Toorn A, Dijkhuizen RM, Tulleken CA, Nicolay K. Diffusion of metabolites in normal and ischemic rat brain measured by localized 1H MRS. Magn Reson Med 1996;36(6):914–922.
3. Branzoli F, Ercan E, Valabrègue R, Wood ET, Buijs M, Webb A, Ronen I. Differentiating between axonal damage and demyelination in healthy aging by combining diffusion‐tensor imaging and diffusion‐weighted spectroscopy in the human corpus callosum at 7 T. Neurobiol Aging 2016;47:210‐217.
4. Ercan E, Magro‐Checa C, Valabregue R, Branzoli F, Wood ET, Steup-Beekman GM, Webb AG, Huizinga TWJ, van Buchem MA, Ronen I. Glial and axonal changes in systemic lupus erythematosus measured with diffusion of intracellular metabolites. Brain 2016;139(5):1447‐1457.
5. Ligneul C, Palombo M, Hernández‐Garzón E, Sauvage MC, Flament J, Hantraye P, Brouillet E, Bonvento G, Escartin C, Valette J. Diffusion‐weighted magnetic resonance spectroscopy enables cell‐specific monitoring of astrocyte reactivity in vivo. Neuroimage 2019;191:457‐469.
6. Wood ET, Ronen I, Techawiboonwong A, Jones CK, Barker PB, Calabresi P, Harrison D, Reich DS. Investigating axonal damage in multiple sclerosis by diffusion tensor spectroscopy. J Neurosci 2012;32(19):6665–6669.
7. Harada M, Uno M, Hong F, Hisaoka S, Nishitani H, Matsuda T. Diffusion-weighted in vivo localized proton MR spectroscopy of human cerebral ischemia and tumor. NMR Biomed 2002;15(1):69–74.
8. Dager SR, Friedman SD, Petropoulos H, Shaw DWW. Imaging evidence for pathological brain development in autism spectrum disorders. In: Autism, Current Clinical Neurology. New York: Humana Press 2008; p 361–379.
9. Du F, Cooper AJ, Thida T, Shinn AK, Cohen BM, Ongür D. Myelin and axon abnormalities in schizophrenia measured with magnetic resonance imaging techniques. Biol Psychiatry 2013;74(6):451–457.
10. Ercan AE, Techawiboonwong A, Versluis MJ, Webb AG, Ronen I. Diffusion-weighted chemical shift imaging of human brain metabolites at 7T. Magn. Reson. Med 2015;73:2053–2061.
11. Fotso K, Dager SR, Landow A, Ackley E, Myers O, Dixon M, Shaw D, Corrigan NM, Posse S. Diffusion tensor spectroscopic imaging of the human brain in children and adults. Magn Reson Med 2017;78(4):1246-1256.
12. Boer VO, Ronen I, Pedersen JO, Petersen ET, Lundell H. Metabolite diffusion weighted imaging with golden angle radial echo planar spectroscopic imaging. In Proceedings of the 27th Annual Meeting of ISMRM, Montreal, Canada, 2019, 3616.
13. Genovese G, Marjańska M, Auerbach EJ, Cherif LY, Ronen I, Lehéricy S, Branzoli F.In vivo diffusion-weighted MRS using semi-LASER in the human brain at 3 T: Methodological aspects and clinical feasibility. NMR Biomed 2020;e4206.
14. Kan HE, Techawiboonwong A, van Osch MJ, Versluis MJ, Deelchand DK, Henry PG, Marjańska M, van Buchem MA, Webb AG, Ronen I. Differences in apparent diffusion coefficients of brain metabolites between grey and white matter in the human brain measured at 7 T. Magn Reson Med 2012;67:1203–1209.
15. Furuyama JK, Wilson NW, Burns BL, et al. Application of compressed sensing to multidimensional spectroscopic imaging in human prostate. Magn Reson Med. 2012;67(6):1499–1505.
16. Qu X, Huang Y, Lu H, Qiu T, Guo D, Agback T, Orekhov V, Chen Z. Accelerated Nuclear Magnetic Resonance Spectroscopy with Deep Learning. Angewandte Chemie 2020;59(26):10297-10300.
Figures