0282
Fast Adiabatic Spin-Echo MRSI Sequence for Whole-Brain 5mm-isotropic metabolic imaging1Radiology and Medical Informatics, University of Geneva, Geneva, Switzerland, 2CIBM Center for Biomedical Imaging, Geneva, Switzerland
Synopsis
A fast 1H 3D Adiabatic Spin-Echo (ADISE) MRSI sequence was implemented to measure metabolite distributions over the whole brain with 5mm isotropic resolution. MRSI data were measured on volunteers and compared with FID-MRSI sequence. ADISE-MRSI and FID-MRSI acquisitions were accelerated with compressed-sensing and reconstructed with a Low-Rank TGV-constrained model.
Introduction:
Free induction decay -MRSI (FID-MRSI) is a fast sequence that enables measurement of metabolic profiles across the whole brain at ultra-short echo-time (TE) and in high spatial resolution in 2D1,2,3 or 3D9,10,11. The simple excite-acquire scheme of the sequence allows to reduce the repetition time (TR), and hence the acquisition time significantly by using a low flip angle, enabling whole-brain high-resolution acquisition in a reasonable time by combining with the other acceleration methods.4,5,9 However, the FID-MRSI is a sequence scheme that might suffer from B0 field in-homogeneity due to its gradient-echo architecture. We implemented the Fast ADISE MRSI sequence including a signal refocusing pulse that would circumvent the T2* susceptibility of FID-MRSI but with the same low flip-angle, same TR, with the shortest possible TE, to match FID-MRSI acquisition time. Also, considering the large excitation slab of a 3D-MRSI sequence, adiabatic full passage (AFP) pulses were chosen to minimize the chemical shift artefact in the slab-through direction. Additionaly, the 3D Cartesian encoding was randomly undersampled to enable compressed-sensing acceleration9 with a low-rank total generalized variation (TGV)-constrained reconstruction. High-resolution 3D metabolite maps obtained by both acquisition sequences are compared using their respective Cramer-Rao-Lower-Bound (CRLB) values and spectral quality parameters (SNR,FWHM).Methods
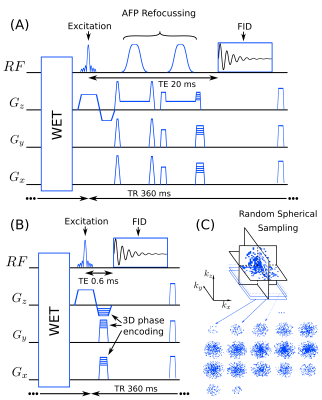
A volume selective 3D ADISE-MRSI sequence including WET water suppression was developed and implemented on a 3T Prisma-Fit system (Siemens Healthineers). The excitation pulse of 0.9 ms was designed with a Shinnar-Le Roux algorithm and adjusted to excite 150% of the slab thickness. The excitation was followed by two adiabatic full-passage hyperbolic-secant pulses of 5ms with slab selective gradients and crushers set to refocus 100% of the slab thickness. This spin-echo sequence was made Fast with the shortest possible TE (20ms) and TR (360 ms) (Fig.1 A) and a low excitation flip-angle (35deg). The signal was recorded with 1024 points over a 4 kHz bandwidth. The 3D FID-MRSI sequence used for the comparison (Fig.1 B) contains the same excitation pulse and has the same spectral resolution bandwidth and TR of 360 ms. The TE (or acquisition-delay in this case) was 0.6ms. The excited slab size was (A/P-R/L-H/F) 210x160x100mm. The 3D encoding volume was set slightly larger to 210x60x110mm to prevent aliasing and the encoding matrix was 42x32x22 resulting in a 125 μl voxel nominal volume (5mm isotropic). For both ADISE and FID-MRSI, 3D Cartesian encoding was performed following a random undersampling pattern with a variable density8,9 given by an acceleration factor of 3.5 which allowed an acquisition time of 20min (Fig.1 C). Three healthy volunteers were scanned with 64-channel receiver head coil. A 3D-T1-weighted MPRAGE sequence was acquired for anatomical reference. The 3D ADISE-MRSI and FID-MRSI were acquired in a row with the same FOV and excitations slab followed by a fast water reference scan. The water reference measurement was acquired to determine the coil sensitivity and the B0 fieldmap with the same FID-MRSI sequence but with a TR of 31 ms, 48 FID points, 5-degree flip angle and a full elliptical k-space coverage. The acquired undersampled 3D MRSI data were cleaned from skull lipids by lipid-metabolite spectral orthogonality 8,9 and reconstructed with low-rank TGV regularized model7,8,9. The reconstructed MRSI dataset was then quantified using LCModel12 to results in maps of NAA+NAAG (N-acetylaspartate and N-acetyl aspartylglutamate), Cre+PCr (total creatine), Cho (choline-containing compounds), Ins (myo-inositol) and Glu+Gln (glutamate and glutamine).Results
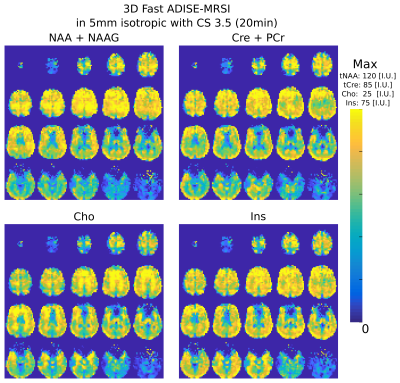
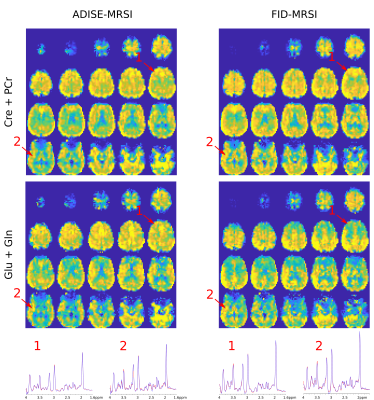
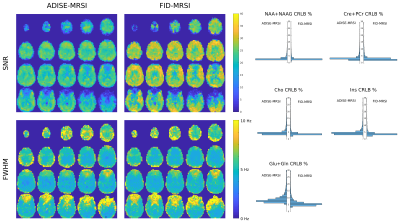
In Fig.2, metabolite volumes resulting from the 3D Fast ADISE-MRSI sequence are exhibited with a quality reflected by the anatomical contrast highlighted in all metabolite distributions. Typical contrast for Cre+PCre and Cho metabolite are present but the metabolite signal loss is still visible in region of strong B0 inhomogeneity e.g. in the lowest frontal lobes. In Fig.3, the comparison between 3D Fast ADISE-MRSI versus 3D FID-MRSI illustrates the close similarity of the results. Due to longer TE timing, signal of ADISE-MRSI is slightly lower as shown by the sample spectra in Fig.3 and SNR maps presented in Fig.4. The fitting error estimated by CRLB values tend to be slightly higher for ADISE-MRSI than FID-MRSI as depicted by the histograms in Fig.4. Use of ADISE-MRSI doesn’t improve much for signal loss due to B0 inhomogeneities. Although metabolite signal is refocussed by the spin echo sequence, the strong T2* relaxation consecutive to the B0 inhomogeneity results in a significant increase of the linewidth, and reduction of detectable metabolite signal. This phenomenon occurs identically in both sequences as illustrated by FWHM maps in Fig.4.Discussion
Original results of whole brain 3D Fast ADISE-MRSI were presented with a demonstration of the good quality of the results. Although metabolite signal is refocussed by the two AFP pulses, there is still a strong signal loss in B0 inhomogeneity regions probably consecutive to T2* relaxation during FID. The overall spectral quality and quantification error are better using a FID-MRSI sequence, the results presented here demonstrate the feasibility of performing a spin-echo MRSI sequence in a reduced scan time over the whole brain. This paves the way to implementation of the Fast ADISE-MRSI sequence with any TE to highlight specific metabolite or the techniques of spectral editing techniques requiring spin-echo.Acknowledgements
No acknowledgement found.References
[1] Henning, A., Fuchs, A., Murdoch, J.B. and Boesiger, P. (2009). NMR Biomed 22, 683-696.
[2] Nassirpour, S., Chang, P., Henning, A. (2017). NeuroImage, 168, 211–221.
[3] Hangel, G., Strasser, B., Považan, M., Heckova, E., Hingerl, L., Boubela, R., … Bogner, W. (2018). NeuroImage, 168(October), 199–210.
[4] Strasser, B., Považan, M., Hangel, G., Hingerl, L., Chmelik, M., Gruber, S., … Bogner, W. (2017). Magnetic Resonance in Medicine, 78(2), 429–440.
[5] Nassirpour, S., Chang, P., Avdievitch, N., & Henning, A. (2018). Magnetic Resonance in Medicine, 80(6), 2311–2325.
[7] Kasten, J., Lazeyras, F., & Van De Ville, D. (2013), IEEE TMI, 32(10), 1853–1863.
[8] Klauser, A., Courvoisier, S., Kasten, J., Kocher, M., Guerquin-Kern, M., Van De Ville, D., & Lazeyras, F. (2019). Magnetic Resonance in Medicine, 81(5), 2841–2857.
[9] Klauser, A., Klauser, P., Grouiller, F., Courvoisier, S., & Lazeyras, F. (2020). BioRxiv, 2020.05.18.101618.
[10] Hingerl, L., Strasser, B., Moser, P., Hangel, G., Motyka, S., Heckova, E., … Bogner, W. (2019). Investigative Radiology, 55(4), 239–248.
[11] Moser, P., Eckstein, K., Hingerl, L., Weber, M., Motyka, S., Strasser, B., … Bogner, W. (2019). Magnetic Resonance in Medicine, 83(6), 1920–1929.
[12] Provencher, S.W. (1993). Magn Reson Med 30, 672-679.
Figures


