0276
Estimating Uncertainty in Deep Learning MRI Reconstruction using a Pixel Classification Image Reconstruction Framework
Kamlesh Pawar1,2, Gary F Egan1,2,3, and Zhaolin Chen1,4
1Monash Biomedical Imaging, Monash University, Melbourne, Australia, 2School of Psychological Sciences, Monash University, Melbourne, Australia, 3ARC Centre of Excellence for Integrative Brain Function, Monash University, Melbourne, Australia, 4Department of Electrical and Computer Systems Engineering, Monash University, Melbourne, Australia
1Monash Biomedical Imaging, Monash University, Melbourne, Australia, 2School of Psychological Sciences, Monash University, Melbourne, Australia, 3ARC Centre of Excellence for Integrative Brain Function, Monash University, Melbourne, Australia, 4Department of Electrical and Computer Systems Engineering, Monash University, Melbourne, Australia
Synopsis
Data-driven deep learning (DL) image reconstruction from undersampled data has become a mainstream research area in MR image reconstruction. The generalization of the model on unseen data and out of sample data distribution is still a concern for the adoption of the DL reconstruction. In this work, we present a method of risk assessment in DL MR image reconstruction by generating an uncertainty map along with the reconstructed image. The proposed method re-casts image reconstruction as a classification problem and the probability of each voxel intensity in the reconstructed image can be used to efficiently estimate its uncertainty.
Introduction
The accuracy of the deep learning (DL) image reconstruction1-3 model relies on the training data and the generalization of the model on unseen data and out of sample data distribution is still a concern for the adoption of the DL reconstruction. Therefore, the risk assessment4,5 of the DL reconstruction is critical in minimizing quantitative errors and potential misdiagnosis. The risk can be assessed by generating uncertainty maps along with the reconstructed image. The uncertainty maps can be retrospectively generated using a Monte Carlo sampling, which involves performing multiple image reconstruction of the same undersampled data using slightly varied model parameters. Using the multiple reconstructions of the same undersampled data, method like Stien’s Unbiased Estimator (SURE) has been used to estimate uncertainty maps by Vineet et. al5. In this work, we describe a novel method of estimating uncertainty maps using a pixel classification reconstruction framework6,7. The proposed method re-casts image reconstruction as a classification problem and the probability of each voxel intensity in the reconstructed image can be used to efficiently estimate its uncertainty. The proposed method provides an estimation of reconstruction uncertainty for individual input datasets.Methods
Pixel classification DL network: The target image was converted to an $$$N$$$-bit unsigned representation. In the $$$N$$$-bit representation, each pixel in the target image can assume only one of the $$$2^n$$$ distinct grey levels. Since there are only $$$2^n$$$ distinct grey levels, we can design a classification DL Unet8 network as shown in Fig. 1, which classifies each pixel into one of the $$$2^n$$$ distinct grey levels. Therefore, the output of the DL network is $$$N\times N\times 2^n$$$ where $$$2^n$$$ is the number of classes (pixel intensity). We used a categorical cross-entropy loss to train the network.Image reconstruction from predicted probabilities: An image can be reconstructed from the probability distribution using a weighted linear combination of predicted probabilities as:
$$I(r) = \frac{1}{N}\sum_{c=0}^{N-1}c.p(r, c)$$
where, $$$p(r, c)$$$ is the probability distribution (Fig.1, red curves) of the pixel belonging to the class $$$c$$$ (pixel intensity) at spatial location $$$r$$$ and $$$N$$$ is the number of distinct grey levels.
Uncertainty map estimation from predicted probabilities: Since categorical cross-entropy was used to train the network, the predicted probability at each spatial location $$$r$$$ follows a Gaussian-like curve as shown in Fig.1 (red curves). The predicted probability distribution is fitted with a Gaussian probability density function (PDF) with mean $$$\mu$$$ using:
$$\min_{\sigma}\sum_{c=0}^{N-1}\mid\frac{1}{\sigma\sqrt{2\pi}}\exp^{-0.5((c-\mu)/\sigma)^2}-p(r, c)\mid$$
The standard deviation ( ) of the fitted Gaussian PDF constitutes the uncertainty at the spatial location $$$r$$$. Different Gaussian PDF is fitted at each spatial location to the generated an uncertainty map.
Experiment dataset: The fastmri brain dataset9 using variable density undersampling with a factor of 4 was used to evaluate the proposed method. An 8-bit (256 distinct grey levels) was used to quantize the reconstructed images in the pixel classification network.
Results
Fig. 2 shows there is substantial error near the tumor region and the uncertainty map predicts high uncertainty in the tumor region. The predicted probability distribution of the tumor region pixel (red) is broader while the distribution is sharper in the other two pixels (blue and green). Visual inspection shows the uncertainty map can capture the spatial regions of error in the image. Fig. 3 shows the error image and uncertainty map respectively for a T2 weighted image. The error image was thresholded at 3.5% of the maximum intensity of the reference image to generate a binary error image, similarly, the uncertainty map was thresholded at a value of 0.035 to generate a predicted binary error image. The dice coefficient between the binary error image and predicted error image was 0.56 demonstrating a good agreement between the actual error and the predicted error. Fig. 4 shows that a linear relationship exists for the SSIM/NMSE with respect to the mean uncertainty while an exponential relation was observed for the PSNR with respect to the mean uncertainty. The relationship is a useful tool to predict an approximate error in terms of SSIM/NMSE/PSNR.Discussion
The T1/T2 weighted images demonstrate that the predicted uncertainty maps correlate with the actual error and thus can be used as guidance for minimizing risk and potential misdiagnosis due to reconstruction error. The relationship between the uncertainty and SSIM/NMSE/PSNR can be used to estimate the quantitative error range. One differentiating contribution of this work compared to the existing literature is that by designing the image reconstruction as a classification problem we can estimate the uncertainty maps for any individual prospective dataset without the use of any retrospective Monte Carlo sampling. The computational complexity for estimating uncertainty maps is substantially reduced since only one prediction is required as opposed to multiple predictions required in the Monte Carlo sampling.Conclusion
The deep learning pixel classification image reconstruction framework is a natural candidate for the estimation of the uncertainty in the reconstructed images. Transforming the image reconstruction into a classification problem leads to the estimation of uncertainty maps with minimal increase in computational complexity. The predicted uncertainties demonstrate a correlation with the actual errors, providing a useful tool for risk assessment and future improvements of DL based image reconstruction.Acknowledgements
No acknowledgement found.References
- Schlemper J, Caballero J, Hajnal JV, Price A, Rueckert D. A deep cascade of convolutional neural networks for MR image reconstruction. International Conference on Information Processing in Medical Imaging 2017 Jun 25 (pp. 647-658). Springer, Cham.
- Yang G, Yu S, Dong H, Slabaugh G, Dragotti PL, Ye X, Liu F, Arridge S, Keegan J, Guo Y, Firmin D. DAGAN: Deep de-aliasing generative adversarial networks for fast compressed sensing MRI reconstruction. IEEE transactions on medical imaging. 2017 Dec 21;37(6):1310-21.
- Zhu B, Liu JZ, Cauley SF, Rosen BR, Rosen MS. Image reconstruction by domain-transform manifold learning. Nature. 2018 Mar;555(7697):487-92.
- Tanno R, Worrall DE, Kaden E, Ghosh A, Grussu F, Bizzi A, Sotiropoulos SN, Criminisi A, Alexander DC. Uncertainty modelling in deep learning for safer neuroimage enhancement: Demonstration in diffusion MRI. NeuroImage. 2020 Oct 8;225:117366.
- Edupuganti V, Mardani M, Vasanawala S, Pauly J. Uncertainty quantification in deep mri reconstruction. IEEE Transactions on Medical Imaging. 2020 Sep 21.
- Pawar K, Chen Z, Shah NJ, Egan GF. A deep learning framework for transforming image reconstruction into pixel classification. IEEE access. 2019 Dec 12;7:177690-702.
- Pawar K, Chen Z, Shah N, Egan GF. ReconNet: a deep learning framework for transforming image reconstruction into pixel classification. InProceedings of the 26th Annual Meeting of ISMRM, Paris, France 2018 (p. 0574).
- Ronneberger O, Fischer P, Brox T. U-net: Convolutional networks for biomedical image segmentation. InInternational Conference on Medical image computing and computer-assisted intervention 2015 Oct 5 (pp. 234-241). Springer, Cham.
- Zbontar J, Knoll F, Sriram A, Murrell T, Huang Z, Muckley MJ, Defazio A, Stern R, Johnson P, Bruno M, Parente M. fastMRI: An open dataset and benchmarks for accelerated MRI. arXiv preprint arXiv:1811.08839. 2018 Nov 21.
Figures
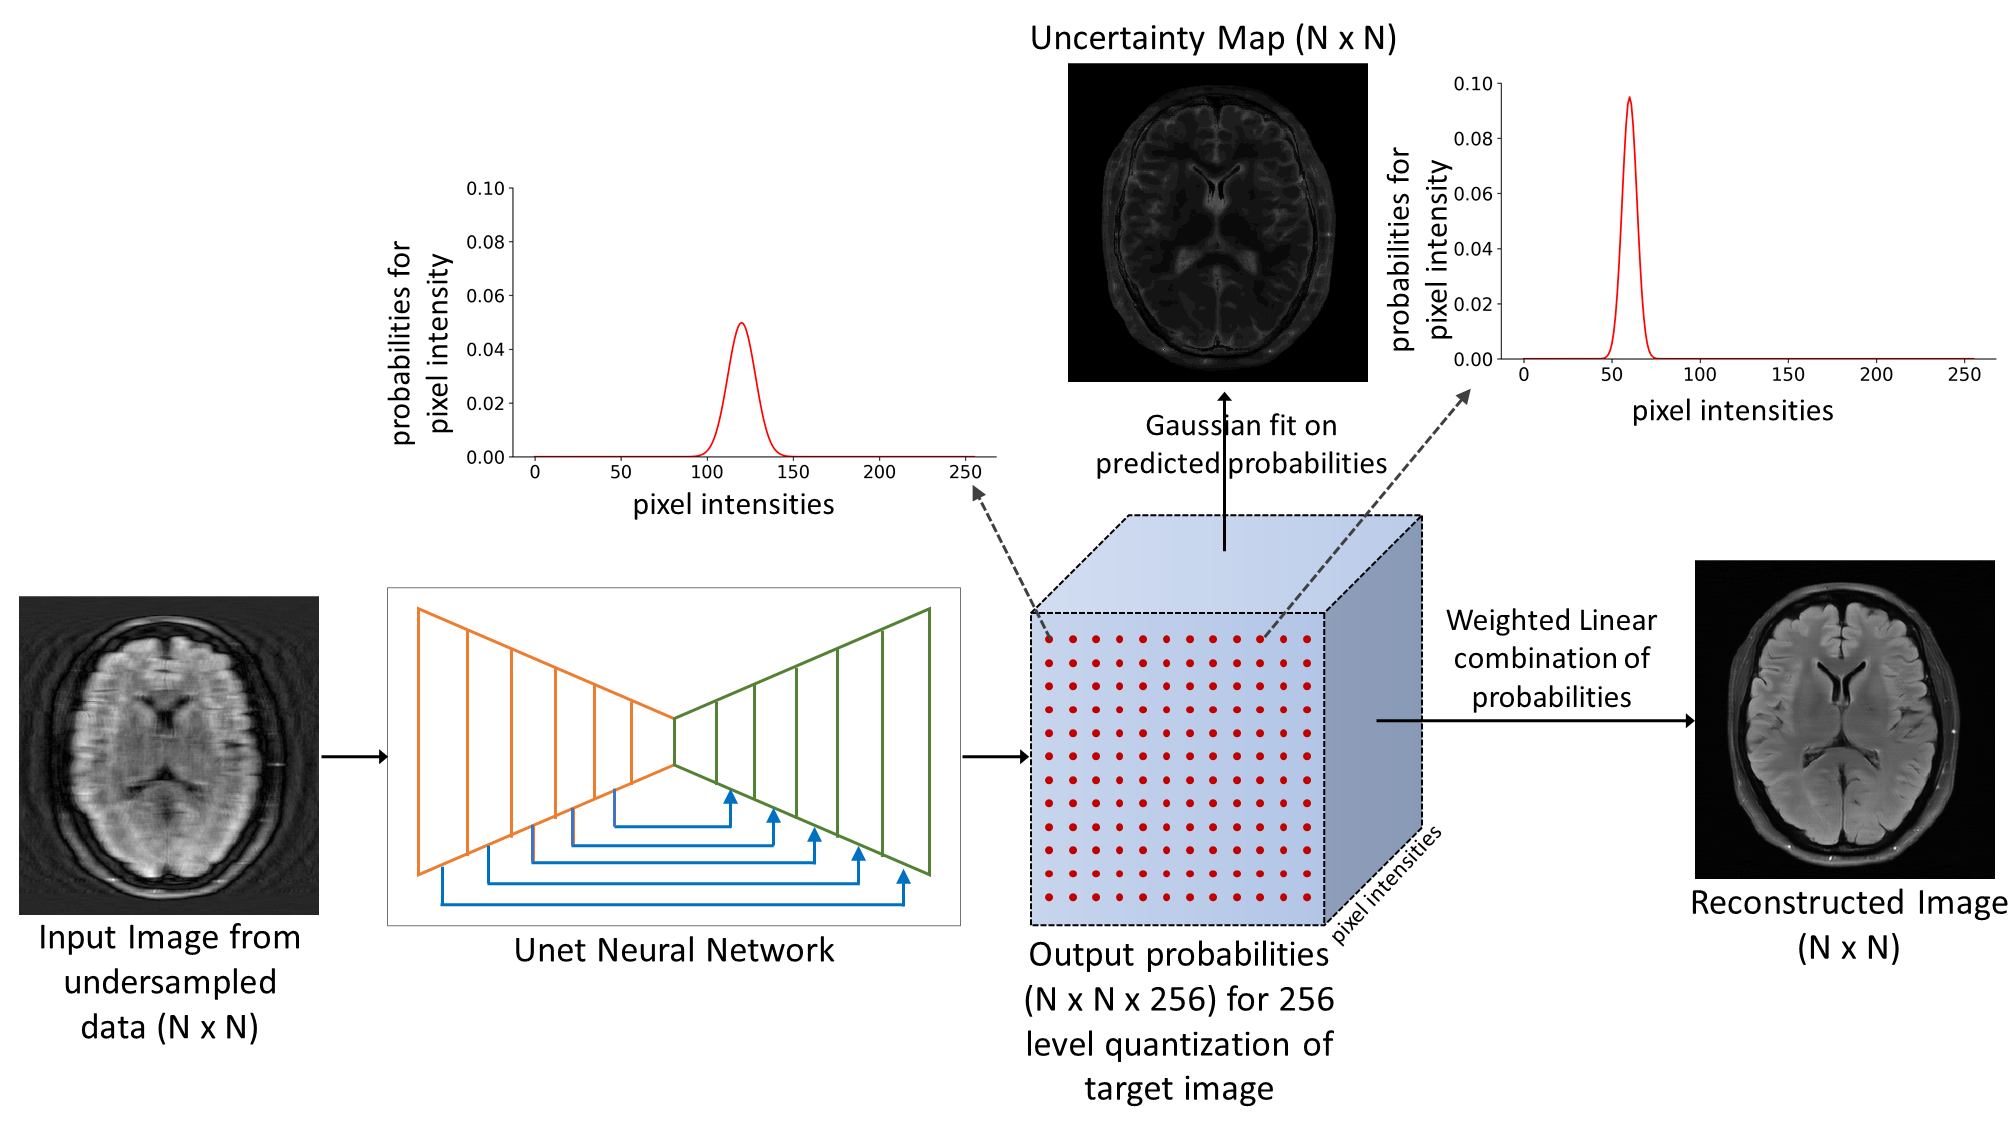
Figure 1: A image obtained from the undersampled k-space data was used as input and a fully
sampled image quantized to 8-bit (256 grey levels) was used as target image to
the network for training. The DL Unet network classifies each pixel in the reconstructed image and the output of the network was probability for each pixel belonging to one
of the 256 distinct quantized grey levels. A weighted linear combination of the
predicted probability forms the reconstructed image and standard deviation of a
Gaussian fitted curve to the predicted probability distribution from the uncertainty
maps.
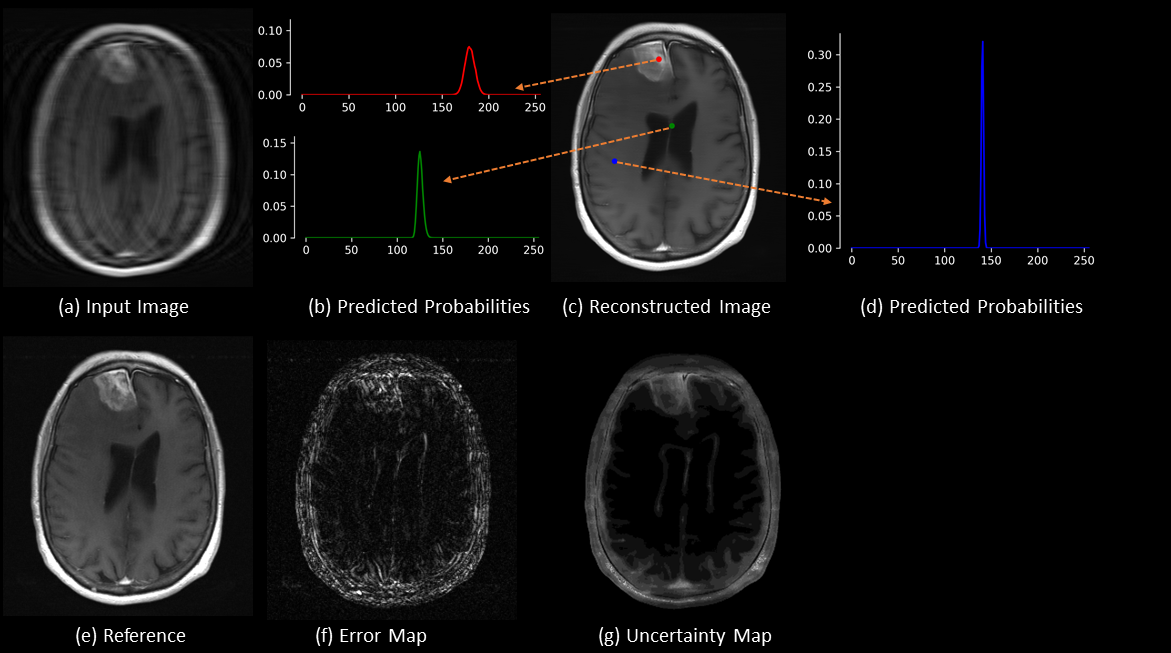
Figure 2: (a)
Input image from undersampled (factor of 4) k-space data; (b, d) are the
predicted probabilities at spatial location as pointed out by the red, blue and
green dots in the reconstructed image respectively; (c) Reconstructed image
obtained using weighted linear combination of the predicted probabilities; (e)
fully sampled reference image; ; (f) error image obtained by subtracting
reference and output image; (c) Uncertainty maps obtained from standard
deviation of the fitted Gaussian curve to the predicted probabilities.
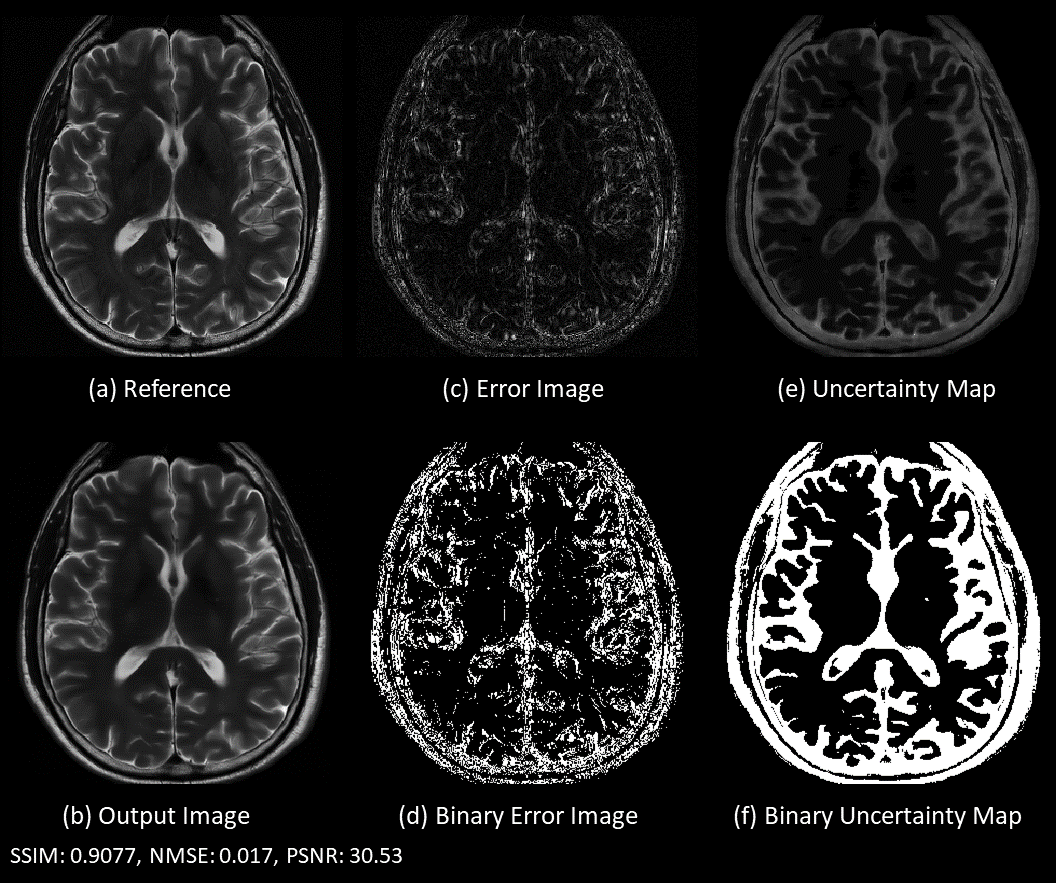
Figure 3: (a)
fully sampled reference image; (b) Reconstructed image obtained using weighted
linear combination of the predicted probabilities; (c) error image obtained by subtracting
reference and output image; (d) binary image obtained by thresholding error
image with 3.5 % of maximum value in the reference image; (e) Uncertainty maps
obtained from standard deviation of the fitted Gaussian curve to the predicted
probabilities; (f) binary image obtained by thresholding the uncertainty maps
using a predefined uncertainty threshold of 0.035.
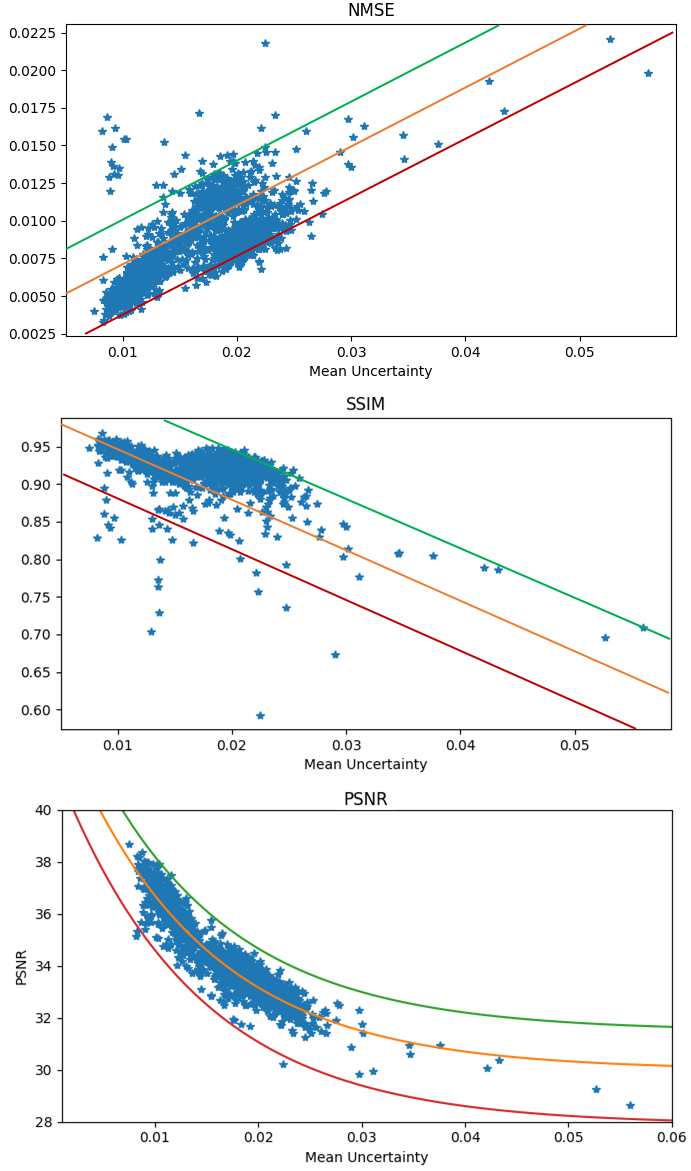
Figure 4: The mean of the uncertainty
maps was calculated for 1300 3D volumes from the validation dataset and plotted
against SSIM, NMSE and PSNR. A linear relation was observed between SSIM/NMSE
vs mean uncertainty and an exponential relationship was observed between PSNR
vs mean uncertainty.