0268
Visual interpretation of brain MRE exams using non-parametric statistical mapping to diagnose normal pressure hydrocephalus1Radiology, Mayo Clinic, Rochester, MN, United States, 2Physiology and Biomedical Engineering, Mayo Clinic, Rochester, MN, United States, 3Neurosurgery, Mayo Clinic, Rochester, MN, United States
Synopsis
A non-parametric statistical framework is outlined to display the result of brain MRE exams in terms of an effect size. This approach is built upon a neural network-based MRE inversion that estimates the posterior cumulative distribution function at each voxel, and accounts for age, sex, spatial variation in stiffness, and uncertainty in property estimation. Using these effect size maps but no summary statistics, neuoradiologists were able to diagnose normal pressure hydrocephalus with 70% sensitivity and 100% positive predictive value.
Introduction
Brain mechanical properties have demonstrated reproducible sensitivity to normal aging and neurodegenerative processes, with reported areas under the ROC curve >0.8 for Alzheimer’s disease,1,2 and >0.95 for normal pressure hydrocephalus.3 However, though these effects are large in a statistical sense, they are small in absolute terms (~10-40%) and on the same order of magnitude as effects of no clinical interest (e.g., normal aging, uncertainty in mechanical property estimates). An MRE-derived image that can be quickly and reliably interpreted by visual examination, even if this interpretation is made in conjunction with a statistical summary, will provide increased confidence in the reliability of the measurements. Here we propose an initial approach to produce an MRE effect size map. These maps were then interpreted in consensus by two neuroradiologists to evaluate the diagnostic potential of the approach.Methods
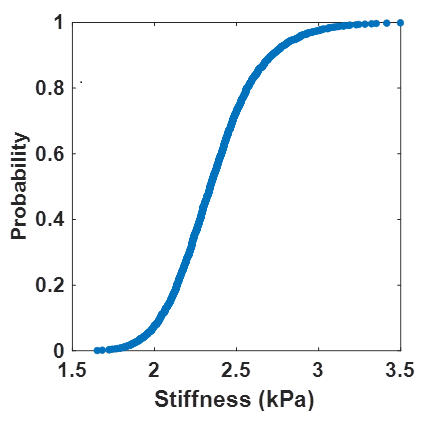
Data used in this work were taken from a previous study.3 Eighty-five participants underwent brain MRE exams after Institutional Review Board approval and obtaining written informed consent. This cohort included 44 amyloid-negative cognitively unimpaired (CU) participants, 8 amyloid-positive participants with Alzheimer’s clinical syndrome (A+ACS), and 33 with normal pressure hydrocephalus (NPH). Imaging was performed at 3T (GE, Waukesha, WI). MRE data were collected at 60 Hz with 3-mm isotropic resolution as previously described.4 A T1-weighted image was also acquired to perform tissue segmentation and guide warping of an atlas to MRE-space.5To enable the statistical mapping, we trained a neural network inversion to estimate the cumulative distribution function (CDF) of stiffness estimates at each voxel. Whereas inversions typically output a single estimate at each voxel, the output of this inversion is a 4D CDF map (3 spatial dimensions plus a quantile dimension). This CDF can be thought of as the estimated posterior distribution in a Bayesian framework. As in previous work,3 this net was trained using an analytical wave equation to generate training data and an inception-like network architecture.3 However, the final output layer was replaced with many output layers, each trained with its own quantile regression loss function. This loss function for a given residual, x, and quantile, q, is given by L(x, q) = x(q – I(x<0)), where I is the indicator function. In this work, the net provides 999 outputs corresponding to uniformly distributed quantiles at a step 0.001. An example single-voxel CDF is shown in Figure 1.
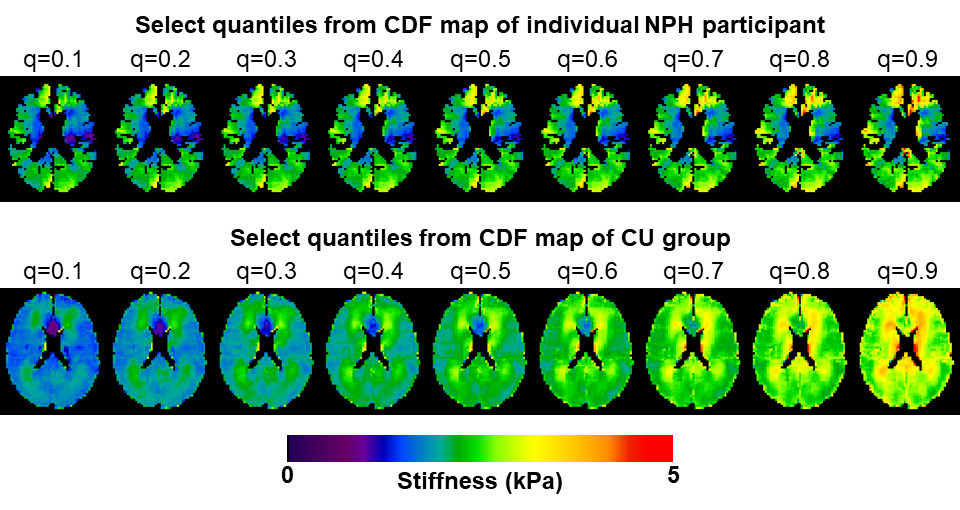
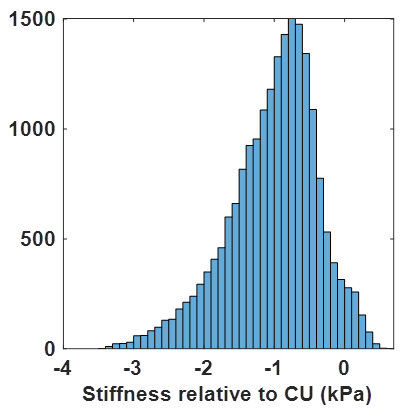
Next, to control for effects of no clinical interest, each participant’s CDF map was compared against the CU group while controlling age and sex. First every case was spatially normalized to an in-house template.5 Then a linear model was fit at each voxel and quantile using CU data, and corrected maps were computed by fixing age to 75 and sex to female. A CU CDF map was then computed by concatenating the CDFs across the CU participants, and re-computing the CDF map at the prescribed quantiles. The CDF maps from NPH and A+ACS participants were age- and sex-corrected with the CU-derived model parameters. A leave-one-out approach was used for correction in CU participants. With corrected CU and individual CDF maps available (examples in Fig. 2), we drew a bootstrap sample from each CDF map and computed the difference. An example distribution of differences is shown in Figure 3 from a periventricular voxel in an NPH participant indicating the expected decreased stiffness. Effect size was then computed at each voxel as the ratio of the median of differences to the median absolute deviation.
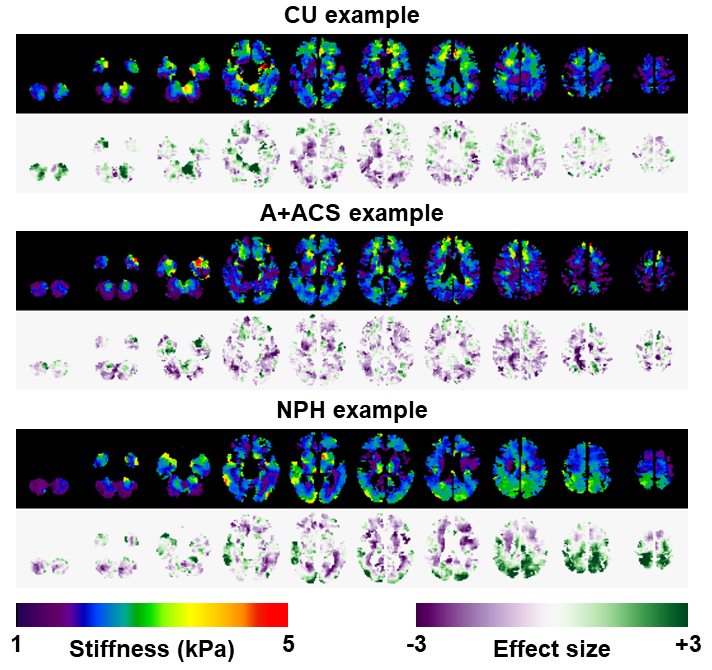
The results of each exam were summarized in select slices, showing both the corrected median stiffness estimate and the effect size. An example from each group is shown in Figure 4. Two neuroradiologists interpreted these images in consensus, assigning each participant to one of the three clinical groups. Images were shown in random order. The results of visual interpretation were compared against a previously described pattern analysis.3
Results and Discussion
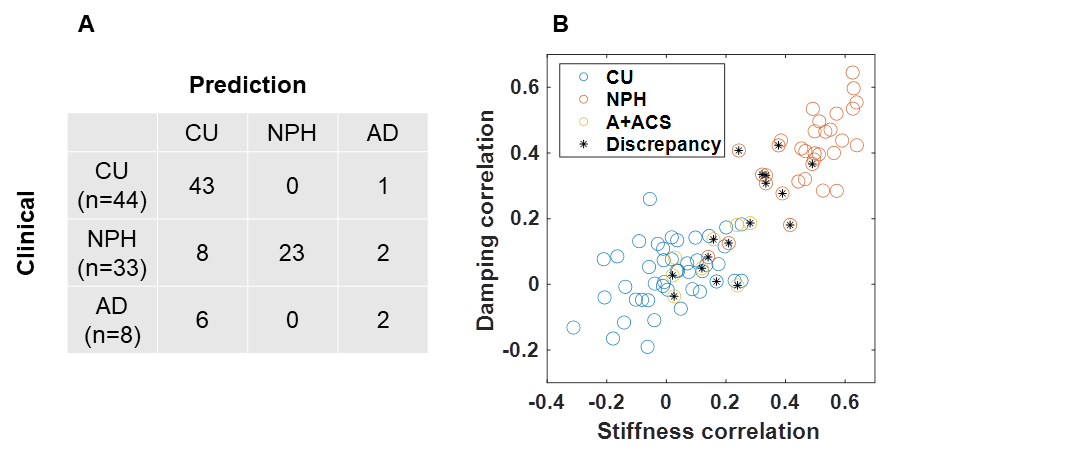
The confusion matrix for the visual interpretations is shown in Figure 5A. Sensitivity for NPH diagnosis was 70% in this sample with positive predictive value of 100%. Two of the NPH participants, though, did not exhibit the expected patterns and so would not be possible to classify by visual inspection (Fig. 5B). This method was less accurate for classification of A+ACS (25% sensitivity, 40% positive predictive value). The difference in accuracy for these two disorders is expected. Whereas NPH exhibits a strong spatial pattern (periventricular softening with peripheral stiffening particularly at the vertex), the effect of A+ACS is more diffuse (widespread softening except in occipital lobe and cerebellum). Figure 5B compares the visual interpretations to a previously described pattern analysis.3 Intuitively, discrepancies mostly involve A+ACS cases and NPH cases near the decision boundary.Conclusion
The proposed statistical mapping approach demonstrates merit to allow visual interpretation of brain MRE exams. Performance is expected to improve as radiologists gain experience with effect size maps; the present study was performed blindly with only knowledge of the average effect of each disorder. The strengths of this framework include its accounting for several effects of no clinical interest and wide applicability. Nonetheless, the framework requires refinement. In particular, incorporation of more realistic noise models is required to achieve more accurate CDF estimation.Acknowledgements
This work was supported by the Theodore W. Batterman Family Foundation as well as the NIH grants EB001981 and EB027064.References
1. Gerischer, L. M. et al. Combining viscoelasticity, diffusivity and volume of the hippocampus for the diagnosis of Alzheimer's disease based on magnetic resonance imaging. Neuroimage Clin 18, 485-493, doi:10.1016/j.nicl.2017.12.023 (2018).
2. Murphy, M. C. et al. Regional brain stiffness changes across the Alzheimer's disease spectrum. Neuroimage Clin 10, 283-290, doi:10.1016/j.nicl.2015.12.007 (2016).
3. Murphy, M. C. et al. Identification of Normal Pressure Hydrocephalus by Disease-Specific Patterns of Brain Stiffness and Damping Ratio. Invest Radiol 55, 200-208, doi:10.1097/RLI.0000000000000630 (2020).
4. Murphy, M. C. et al. Measuring the characteristic topography of brain stiffness with magnetic resonance elastography. PLoS One 8, e81668, doi:10.1371/journal.pone.0081668 (2013).
5. Ashburner, J. & Friston, K. J. Unified segmentation. Neuroimage 26, 839-851 (2005).
Figures