0267
Assessment of Cerebrovascular Disease and White Matter Neurite Density in Alzheimer’s Disease1Medical Physics, University of Wisconsin - Madison, Madison, WI, United States, 2Medicine, University of Wisconsin - Madison, Madison, WI, United States, 3Radiology, University of Wisconsin - Madison, Madison, WI, United States, 4Pediatrics, University of Wisconsin - Madison, Madison, WI, United States, 5Psychiatry, University of Wisconsin - Madison, Madison, WI, United States
Synopsis
White matter (WM) microstructural alterations have been shown to occur in Alzheimer’s disease (AD) and may be partially mediated by cerebrovascular disease (CVD). The objective of this study is to use neurite orientation dispersion and density imaging (NODDI) to assess differences in neurite density (NDI) and its relationship to measures of CVD from 4D flow MRI in cognitively normal (CN) and AD subjects. Our results showed differences in NDI between groups in various WM tracts and found correlations between NDI and cerebral blood flow in CN subjects in several WM structures.
Introduction
White matter (WM) microstructural alterations have been observed in patients with Alzheimer’s disease (AD)(1-4) and have been hypothesized to be influenced by cerebrovascular disease (CVD) through vascular-mediated neuronal dysfunction and impaired Aβ drainage(5). This hypothesis is supported by recent findings that indicate that blood-brain barrier dysfunction(6), hypoperfusion(7), altered cerebrovascular hemodynamics(8-10), and various cardiovascular risk factors(11) are associated with AD progression and may even precede amyloid deposition. However, it is still unclear the degree to which macroscopic CVD influences WM at the microstructural level. In this study, correlations between CVD on WM neurite density, as measured by neurite density index (NDI), are assessed in a cohort of AD and cognitively normal (CN) control subjects using 4D flow MRI and neurite orientation dispersion and density imaging (NODDI)(12).Methods
A total of 41 age-matched CN control (females=23, mean age=74±6.8y) and 20 AD (females=13, mean age=73±9.2y) subjects were recruited for this study. AD individuals were clinically characterized as “dementia due to probable AD” by a multidisciplinary consensus using applicable clinical, laboratory, and imaging criteria(13,14).MR imaging data were acquired on a 3T Discovery MR750 scanner (GE Healthcare, Waukesha, WI) using a 32-channel head coil (Nova Medical, Wilmington, MA). 4D flow data were acquired using a 3D radial sequence(15,16) using 5-point encoding (Venc=80cm/s; TR/TE=7.4/2.7ms; flip angle=8°; resolution=0.7mm3 isotropic; projections≈11,000). Two separate reconstructions were performed with retrospective cardiac gating: (1) a standard reconstruction with temporal resolutions≈50ms and (2) an ultrahigh temporal resolution (≈8ms) reconstruction using locally low rank constraints and flow encode splitting(17). The standard reconstruction was used to compute carotid pulsatility index, averaged between left and right internal carotid arteries (ICAs), and total cerebral blood flow (tCBF), sum of flow in the ICAs and basilar artery, using custom-built MATLAB (The Mathworks, Natick, MA) tools(18). Using the ultrahigh temporal resolution reconstruction, carotid pulse wave velocity measurements were obtained using previously described methods(17) and were averaged between the left and right ICAs. A multi-shell spin-echo echo-planar imaging sequence was used to acquire 69 total diffusion-weighted images across 4 shells (6×b=0 s/mm2, 9×b=500s/mm2, 18×b=800s/mm2, and 36×b=2000s/mm2; TR/TE=8575/76.8ms; resolution=2mm3 isotropic). Standard diffusion image preprocessing was performed using FSL(19) and MRtrix3(20), including denoising(21), Gibb’s ringing correction(22), brain extraction(23), and eddy current correction(24). Diffusion tensors were estimated using dtifit in FSL. NDI parameter maps were generated using the NODDI Matlab Toolbox v1.0.4 in MATLAB 2020b.
Two-sample t-tests and Fisher’s exact tests were used to assess demographic differences. Whole-brain voxel-wise group differences in NDI measures, as well as correlations between NDI and carotid pulse wave velocity, pulsatility index, and tCBF for both groups, were explored using tract-based spatial statistics (TBSS)(25) and randomise (permutations=5,000, threshold-free cluster enhancement)(26) in FSL. The TBSS pipeline included nonlinear registration of images to 1mm FMRIB58_FA standard space(27). Significant WM tracts were identified using the pre-labeled ICBM-DTI-81 WM atlas. These significant tracts were then analyzed post hoc using a region of interest (ROI)-based analysis from the WM atlas. Analysis of covariance (ANCOVA) tested differences in NDI between AD and control groups in ROIs identified from TBSS. Subsequently, correlations between NDI and CVD metrics were tested using fixed-effect robust linear regression models including age and sex as covariates.
Results
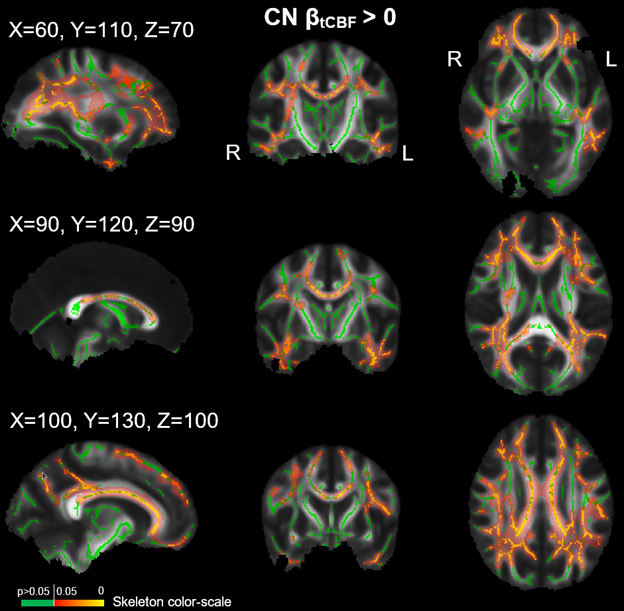
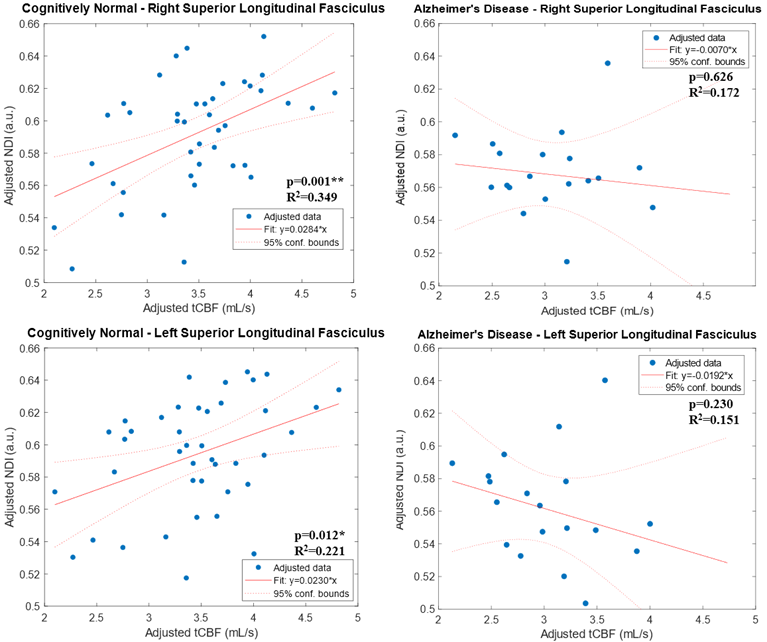
No demographic differences existed between cohorts (age: p=0.96, sex: p=0.58). TBSS showed significant group differences in NDI in multiple tracts (Figure 1). Individualized post hoc ROI analysis further substantiated these differences in the corpus callosum, corona radiata, posterior thalamic radiation, external capsule, cingulum, cingulate cortex, superior longitudinal fasciculus, and uncinate fasciculus (Table 1). TBSS revealed some areas of negative correlations between pulsatility index and NDI in the control group; however, upon performing ROI analysis in these areas, there were no significant correlations after Bonferroni correction. There were a number of regions with positive correlations between tCBF and NDI in the control group (Figure 2). ROI analysis demonstrated regions of positive correlation between tCBF and NDI (Table 2); however, only the superior longitudinal fasciculus (SLF) and body of corpus callosum were significant after multiple comparison correction. Correlation plots of NDI versus tCBF in the SLF are shown in Figure 3. There were no significant correlations between any CVD measure and NDI in the AD group.Discussion
Differences in WM neurite density between the control and AD groups in various subcortical structures support findings from other studies of similar scope(1,2). Additionally, correlations between tCBF and NDI were observed in control subjects. The lack of an observed association between CVD and NDI in the AD group may partly be due to the relatively low number of subjects in this cohort. Increasing sample sizes, and incorporating subjects along the AD continuum, may strengthen statistical inferences made about these relationships. Furthermore, longitudinal studies assessing NDI changes in individuals could elucidate the relationships between trajectories of cerebral blood flow and WM degeneration in preclinical AD.Conclusion
NODDI and 4D flow MRI allowed for the assessment of white matter neurite density (NDI) and cerebrovascular hemodynamics in cognitively normal and AD subjects. Differences in NDI between groups were observed, and there was a relationship between cerebral blood flow and NDI in several white matter structures. Increased sample sizes and longitudinal assessments are warranted for future studies.Acknowledgements
We gratefully acknowledge research support from GE Healthcare and funding support from the Alzheimer’s Association and NIH grants: AARFD-20-678095, P50-AG033514, RO1EB027087, and ROIAG021155.References
1. Fu X, Shrestha S, Sun M, et al. Microstructural White Matter Alterations in Mild Cognitive Impairment and Alzheimer's Disease: Study Based on Neurite Orientation Dispersion and Density Imaging (NODDI). Clin Neuroradiol 2020;30(3):569-579.
2. Slattery CF, Zhang J, Paterson RW, et al. ApoE influences regional white-matter axonal density loss in Alzheimer's disease. Neurobiol Aging 2017;57:8-17.
3. Wen Q, Mustafi SM, Li J, et al. White matter alterations in early-stage Alzheimer's disease: A tract-specific study. Alzheimers Dement (Amst) 2019;11:576-587.
4. Bartzokis G, Cummings JL, Sultzer D, Henderson VW, Nuechterlein KH, Mintz J. White matter structural integrity in healthy aging adults and patients with Alzheimer disease: a magnetic resonance imaging study. Arch Neurol 2003;60(3):393-398.
5. Zlokovic BV. Neurovascular pathways to neurodegeneration in Alzheimer's disease and other disorders. Nature Reviews Neuroscience 2011;12(12):723-738.
6. Ujiie M, Dickstein DL, Carlow DA, Jefferies WA. Blood-brain barrier permeability precedes senile plaque formation in an Alzheimer disease model. Microcirculation 2003;10(6):463-470.
7. Clark LR, Berman SE, Rivera-Rivera LA, et al. Macrovascular and microvascular cerebral blood flow in adults at risk for Alzheimer's disease. Alzheimers Dement (Amst) 2017;7:48-55.
8. Berman SE, Rivera-Rivera LA, Clark LR, et al. Intracranial Arterial 4D-Flow is Associated with Metrics of Brain Health and Alzheimer's Disease. Alzheimers Dement (Amst) 2015;1(4):420-428.
9. Rivera-Rivera LA, Schubert T, Turski P, et al. Changes in intracranial venous blood flow and pulsatility in Alzheimer's disease: A 4D flow MRI study. J Cereb Blood Flow Metab 2017;37(6):2149-2158.
10. Rivera-Rivera LA, Cody KA, Rutkowski D, et al. Intracranial vascular flow oscillations in Alzheimer’s disease from 4D flow MRI. NeuroImage: Clinical 2020;28:102379.
11. Santos CY, Snyder PJ, Wu W-C, Zhang M, Echeverria A, Alber J. Pathophysiologic relationship between Alzheimer's disease, cerebrovascular disease, and cardiovascular risk: A review and synthesis. Alzheimer's & dementia (Amsterdam, Netherlands) 2017;7:69-87.
12. Zhang H, Schneider T, Wheeler-Kingshott CA, Alexander DC. NODDI: practical in vivo neurite orientation dispersion and density imaging of the human brain. Neuroimage 2012;61(4):1000-1016.
13. McKhann GM, Knopman DS, Chertkow H, et al. The diagnosis of dementia due to Alzheimer's disease: recommendations from the National Institute on Aging-Alzheimer's Association workgroups on diagnostic guidelines for Alzheimer's disease. Alzheimers Dement 2011;7(3):263-269.
14. Jack CR, Jr., Bennett DA, Blennow K, et al. NIA-AA Research Framework: Toward a biological definition of Alzheimer's disease. Alzheimers Dement 2018;14(4):535-562.
15. Gu T, Korosec FR, Block WF, et al. PC VIPR: a high-speed 3D phase-contrast method for flow quantification and high-resolution angiography. AJNR Am J Neuroradiol 2005;26(4):743-749.
16. Johnson KM, Markl M. Improved SNR in phase contrast velocimetry with five-point balanced flow encoding. Magn Reson Med 2010;63(2):349-355.
17. Rivera-Rivera LA, Cody KA, Eisenmenger L, et al. Assessment of vascular stiffness in the internal carotid artery proximal to the carotid canal in Alzheimer’s disease using pulse wave velocity from low rank reconstructed 4D flow MRI. Journal of Cerebral Blood Flow & Metabolism 2020:0271678X20910302.
18. Schrauben E, Wahlin A, Ambarki K, et al. Fast 4D flow MRI intracranial segmentation and quantification in tortuous arteries. J Magn Reson Imaging 2015;42(5):1458-1464.
19. Jenkinson M, Beckmann CF, Behrens TE, Woolrich MW, Smith SM. FSL. Neuroimage 2012;62(2):782-790.
20. Tournier JD, Smith R, Raffelt D, et al. MRtrix3: A fast, flexible and open software framework for medical image processing and visualisation. Neuroimage 2019;202:116137.
21. Veraart J, Novikov DS, Christiaens D, Ades-Aron B, Sijbers J, Fieremans E. Denoising of diffusion MRI using random matrix theory. Neuroimage 2016;142:394-406.
22. Kellner E, Dhital B, Kiselev VG, Reisert M. Gibbs-ringing artifact removal based on local subvoxel-shifts. Magn Reson Med 2016;76(5):1574-1581.
23. Smith SM. Fast robust automated brain extraction. Hum Brain Mapp 2002;17(3):143-155.
24. Andersson JLR, Sotiropoulos SN. An integrated approach to correction for off-resonance effects and subject movement in diffusion MR imaging. Neuroimage 2016;125:1063-1078.
25. Smith SM, Jenkinson M, Johansen-Berg H, et al. Tract-based spatial statistics: voxelwise analysis of multi-subject diffusion data. Neuroimage 2006;31(4):1487-1505.
26. Winkler AM, Ridgway GR, Webster MA, Smith SM, Nichols TE. Permutation inference for the general linear model. Neuroimage 2014;92(100):381-397.
27. Andersson J, Jenkinson M, Smith S. Non-linear registration, aka spatial normalisation. FMRIB technical report TR07JA2; 2010.
Figures
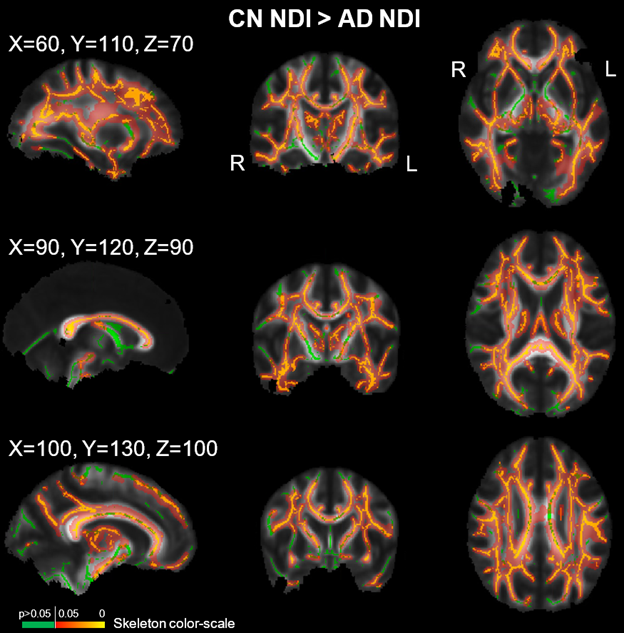
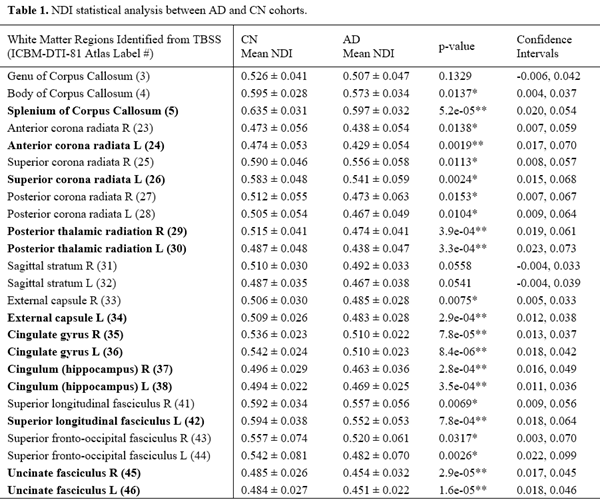
Abbreviations: NDI=neurite density index; AD=Alzheimer's disease; CN=cognitively normal; TBSS=tract-based spatial statistics; R=right; L=left.
Mean NDI values are listed as mean ± 1 standard deviation.
*p-values <0.05; **p-values <0.002 (Bonferroni correction for 25 ROIs).
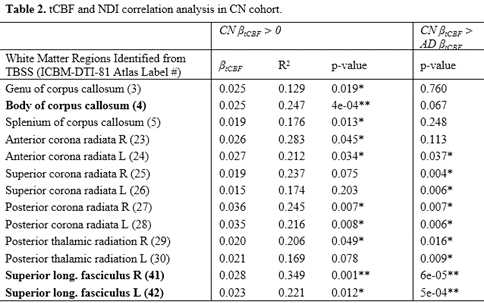
Abbreviations: tCBF=total cerebral blood flow; NDI=neurite density index; AD=Alzheimer's disease; CN=cognitively normal; TBSS=tract-based spatial statistics; R=right; L=left.
β: regression coefficient; R2: adjusted coefficient of determination.
*p-values <0.05; **p-values <0.004 (Bonferroni correction for 13 ROIs).