0265
Brain instability is a biomarker of Alzheimer’s disease progression1Georgia Institute of Technology/Emory University, ATLANTA, GA, United States, 2Georgia State University, Atlanta, GA, United States, 3Stanford University, Stanford,, GA, United States, 4Harvard University, Cambridge, MA, United States, 5Georgia Institute of Technology, Atlanta, GA, United States
Synopsis
Finding a biomarker predicting the Alzheimer’s disease (AD) progression from a healthy stage to mild dementia is an essential step toward early medical intervention. In recent years, dynamic functional network connectivity (dFNC) from resting state-fMRI, which estimates brain states during the scan, uncovered excellent knowledge about AD progression's underlying mechanism. This study explored whether the AD brain produces similar and stable dFNC states across different scanning sessions and introduced dFNC state (or brain) instability as a potential biomarker of AD progression. Our finding suggests a need for multiple sessions scanning in analyzing rs-fMRI data in this group of patients.
Introduction
Alzheimer’s disease (AD) is the most common age-related dementia, typically affecting individuals over 65 years of age1. To date, there is no way to cure AD, but some medications can decelerate its progress2. Therefore, predicting the progression from a healthy stage to mild cognitive impairment and further to AD is an essential step toward early medical intervention. Dynamic functional network connectivity (dFNC) from rs-fMRI estimates brain states as they vary throughout a scan. Previous studies investigated the reproducibility of subject brain states across different scanning sessions3. However, dFNC stability, specifically in connection with AD, has not yet been investigated. This study explores whether the AD brain produces similar and stable dFNC states across different scanning sessions and hypothesizes dFNC state instability as a potential biomarker of AD progression.Methods
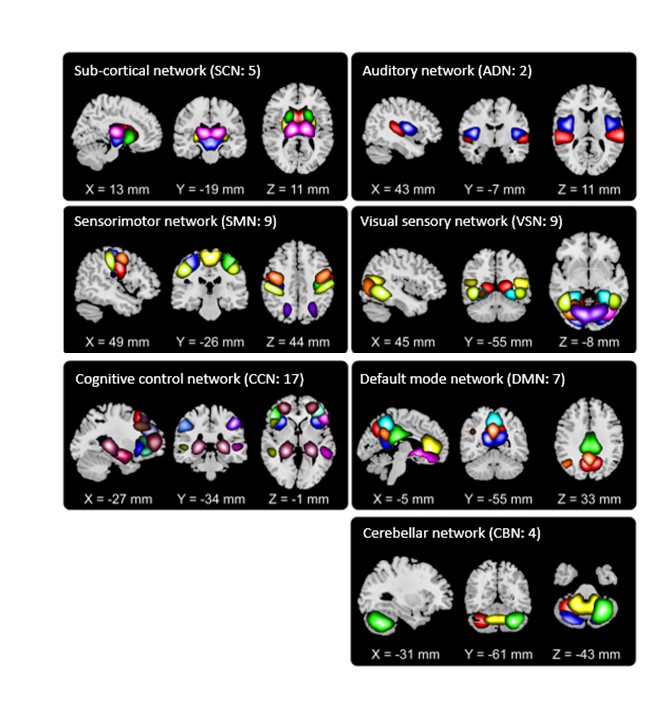
In this study, the data we used are from the longitudinal Open Access Series of Imaging Studies (OASIS)-3 cohort 4. This dataset contains two rs-fMRI sessions of 1048 healthy controls or HC (with clinical dementia rating CDR-SOB=0, age= 70.80± 8.57), 193 mild cognitively impaired or MCI (4.5=<CDR-SOB<=9, age= 71.00±9.48), and 75 mild dementia or MD (with clinical dementia rating 4.5=<CDR-SOB<=9, age=71.90±9.65). It is worth mentioning that no significant age difference was observed between groups (t-test p>0.2). High resolution T2*-weighted functional images were obtained by an echoplanar imaging or EP sequence with TE =27 ms, TR = 2.5 s, flip angle = 90˚, slice thickness = 4mm, slice gap = 4 mm, matrix size = 64, and voxel size of 1 mm × 1 mm × 1.25 mm. To extract reliable independent components (ICs), we used the Neuromark automatic ICA pipeline within the group ICA of fMRI toolbox (GIFT, http://trendscenter.org/software/gift), which uses previously derived component maps as priors for spatially constrained ICA5. The Neuromark automatic ICA pipeline was used to extract ICs by employing previously derived component maps as priors for spatially constrained ICA. In Neuromark, replicable components were identified by matching group-level spatial maps from two large-sample HC datasets (Step1 of Fig.1). 53 pairs of ICs were identified as meaningful and reproducible, arranging into 7 functional domains based on their anatomic and functional prior knowledge. These domains included subcortical network (SCN), auditory network (ADN), sensorimotor network (SMN), visual network (VSN), cognitive control network (CCN), default-mode network (DMN), and cerebellar network (CBN) as shown in Fig.2. Then, dFNCs for each subject and each session were computed using a sliding-window correlation approach (Step 2 of Fig1). Subsequently, k-means clustering of the dFNCs (k=3, L1-norm as distance metrics, and 1000 iterations) was applied separately to each group and each session (Step 3 of Fig.1). The optimal number of centroid states was estimated using the elbow criterion based on the ratio of within to between cluster distance. We then calculated the occupancy rates (OCRs) for each state, i.e., the percentage of time each subject spends in each state. Finally, we assessed the similarity among states of different sessions by applying the Pearson correlation on the state’s connectivity features (Step 4 of Fig.1).Results
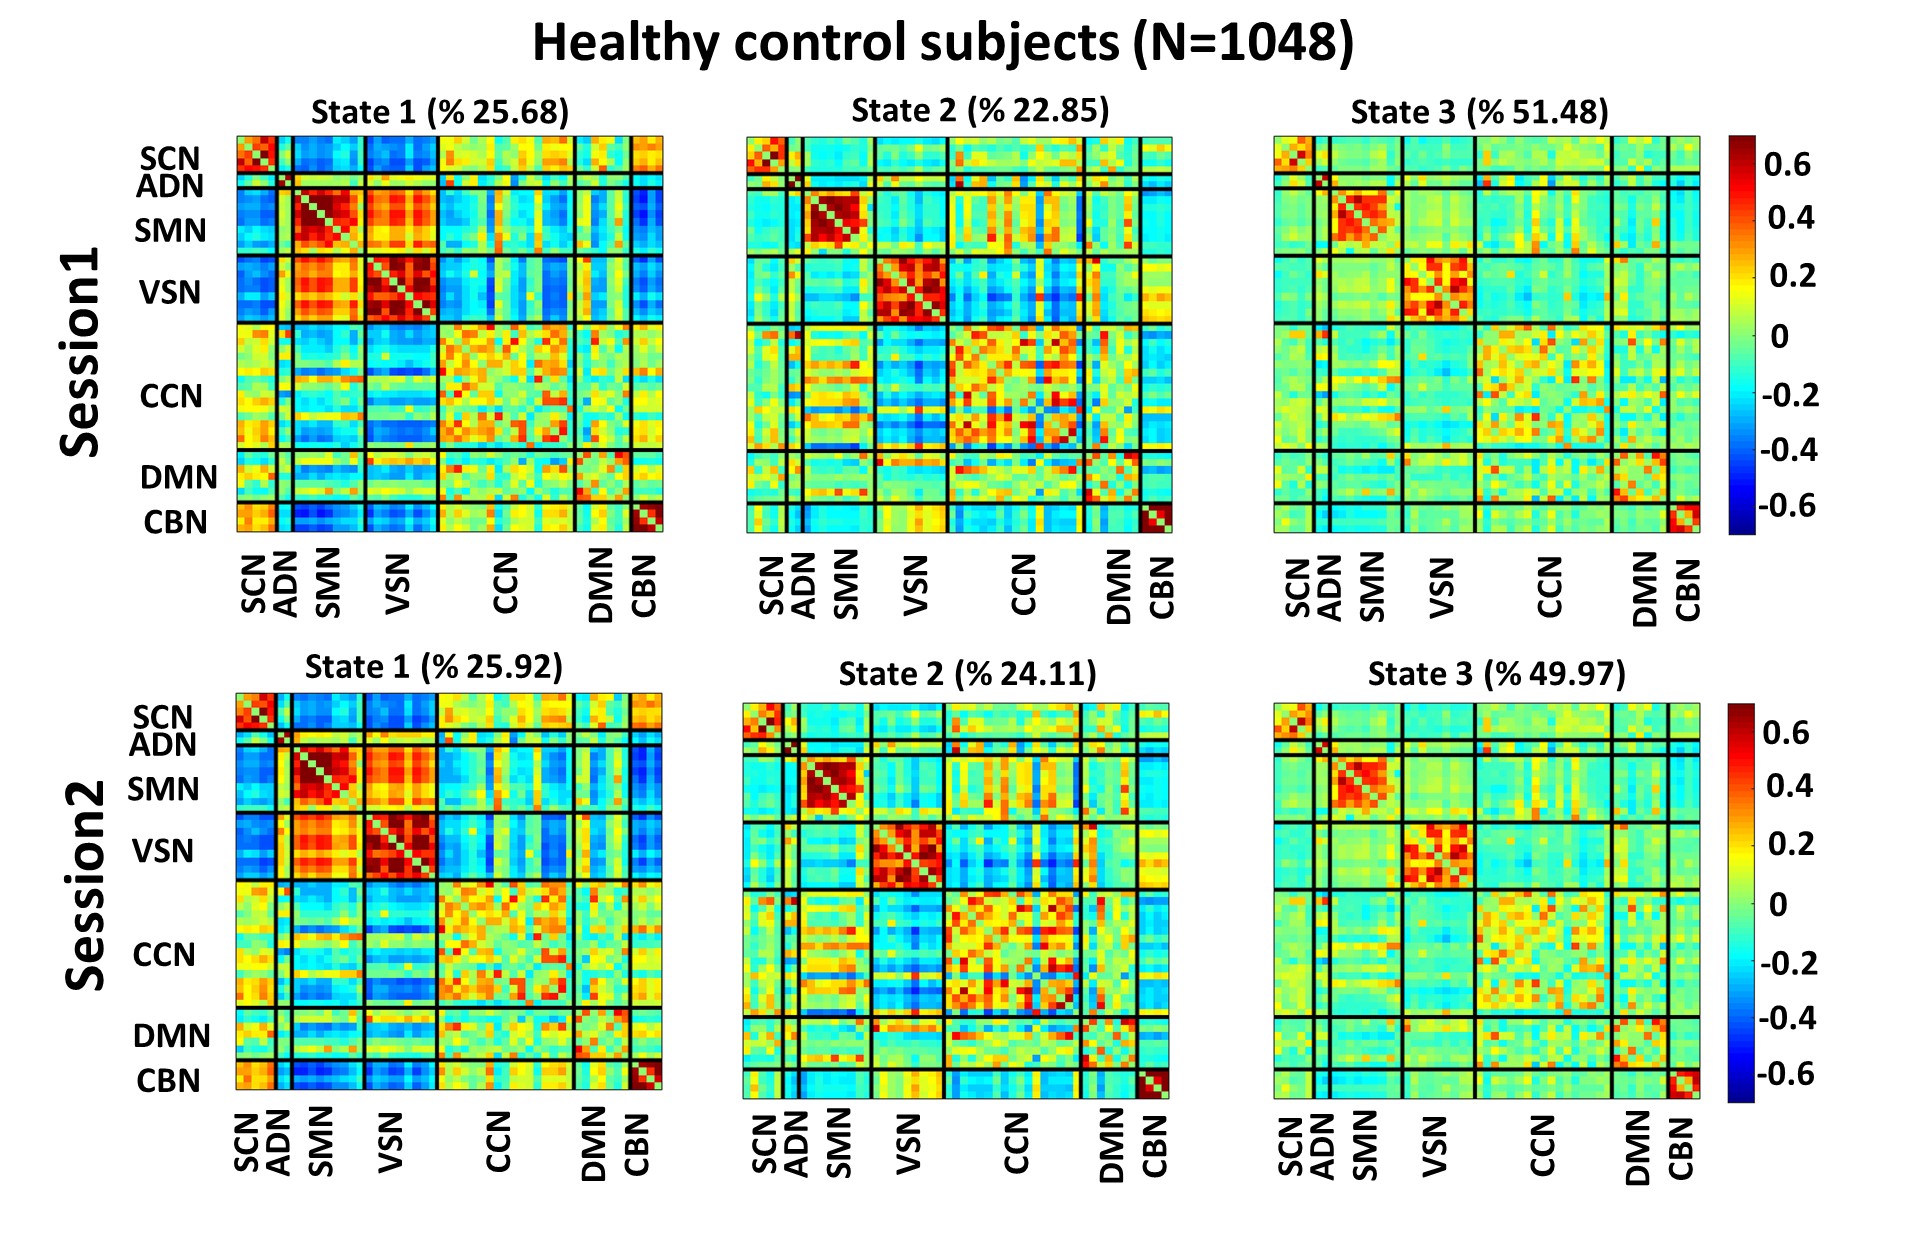
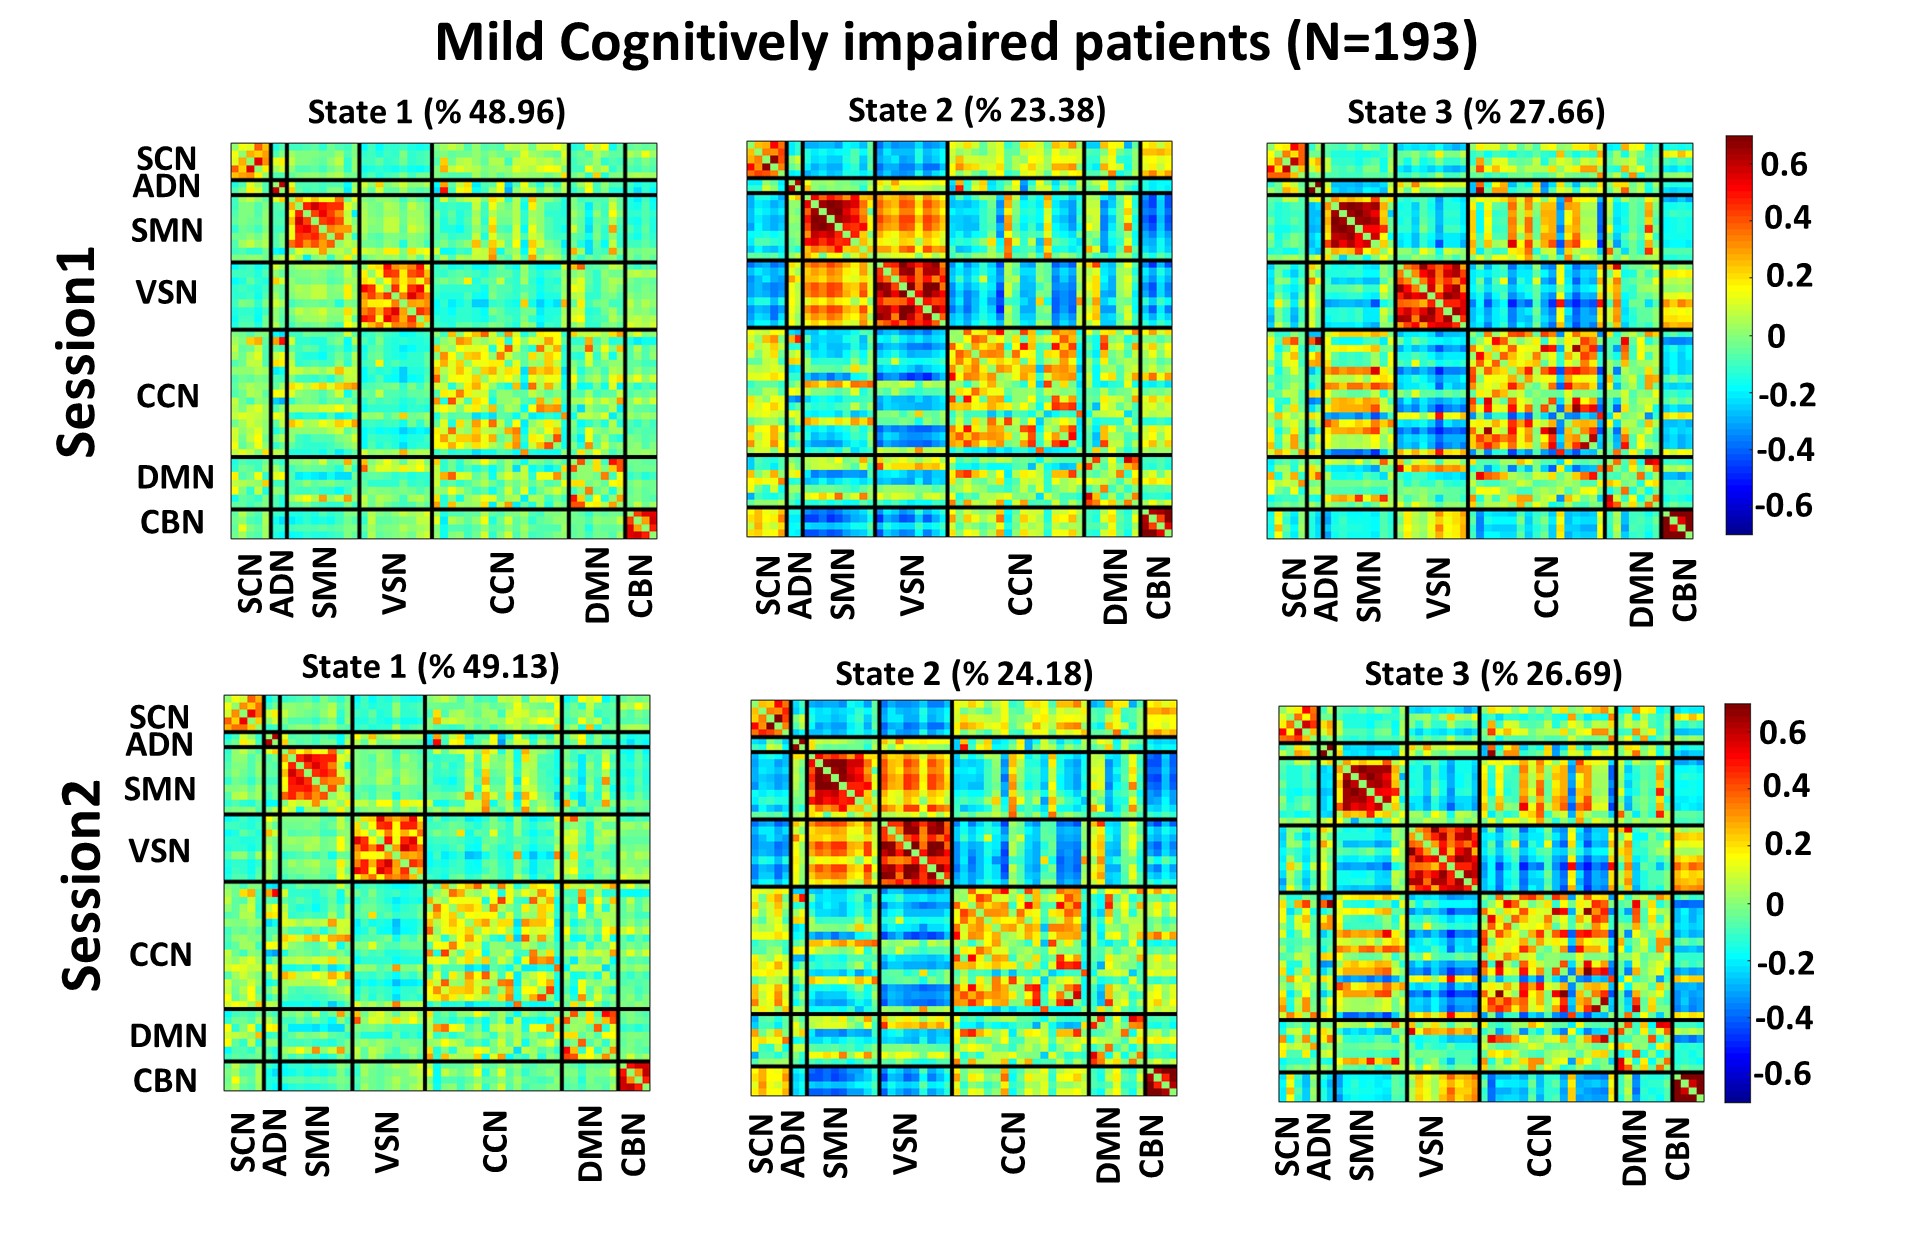
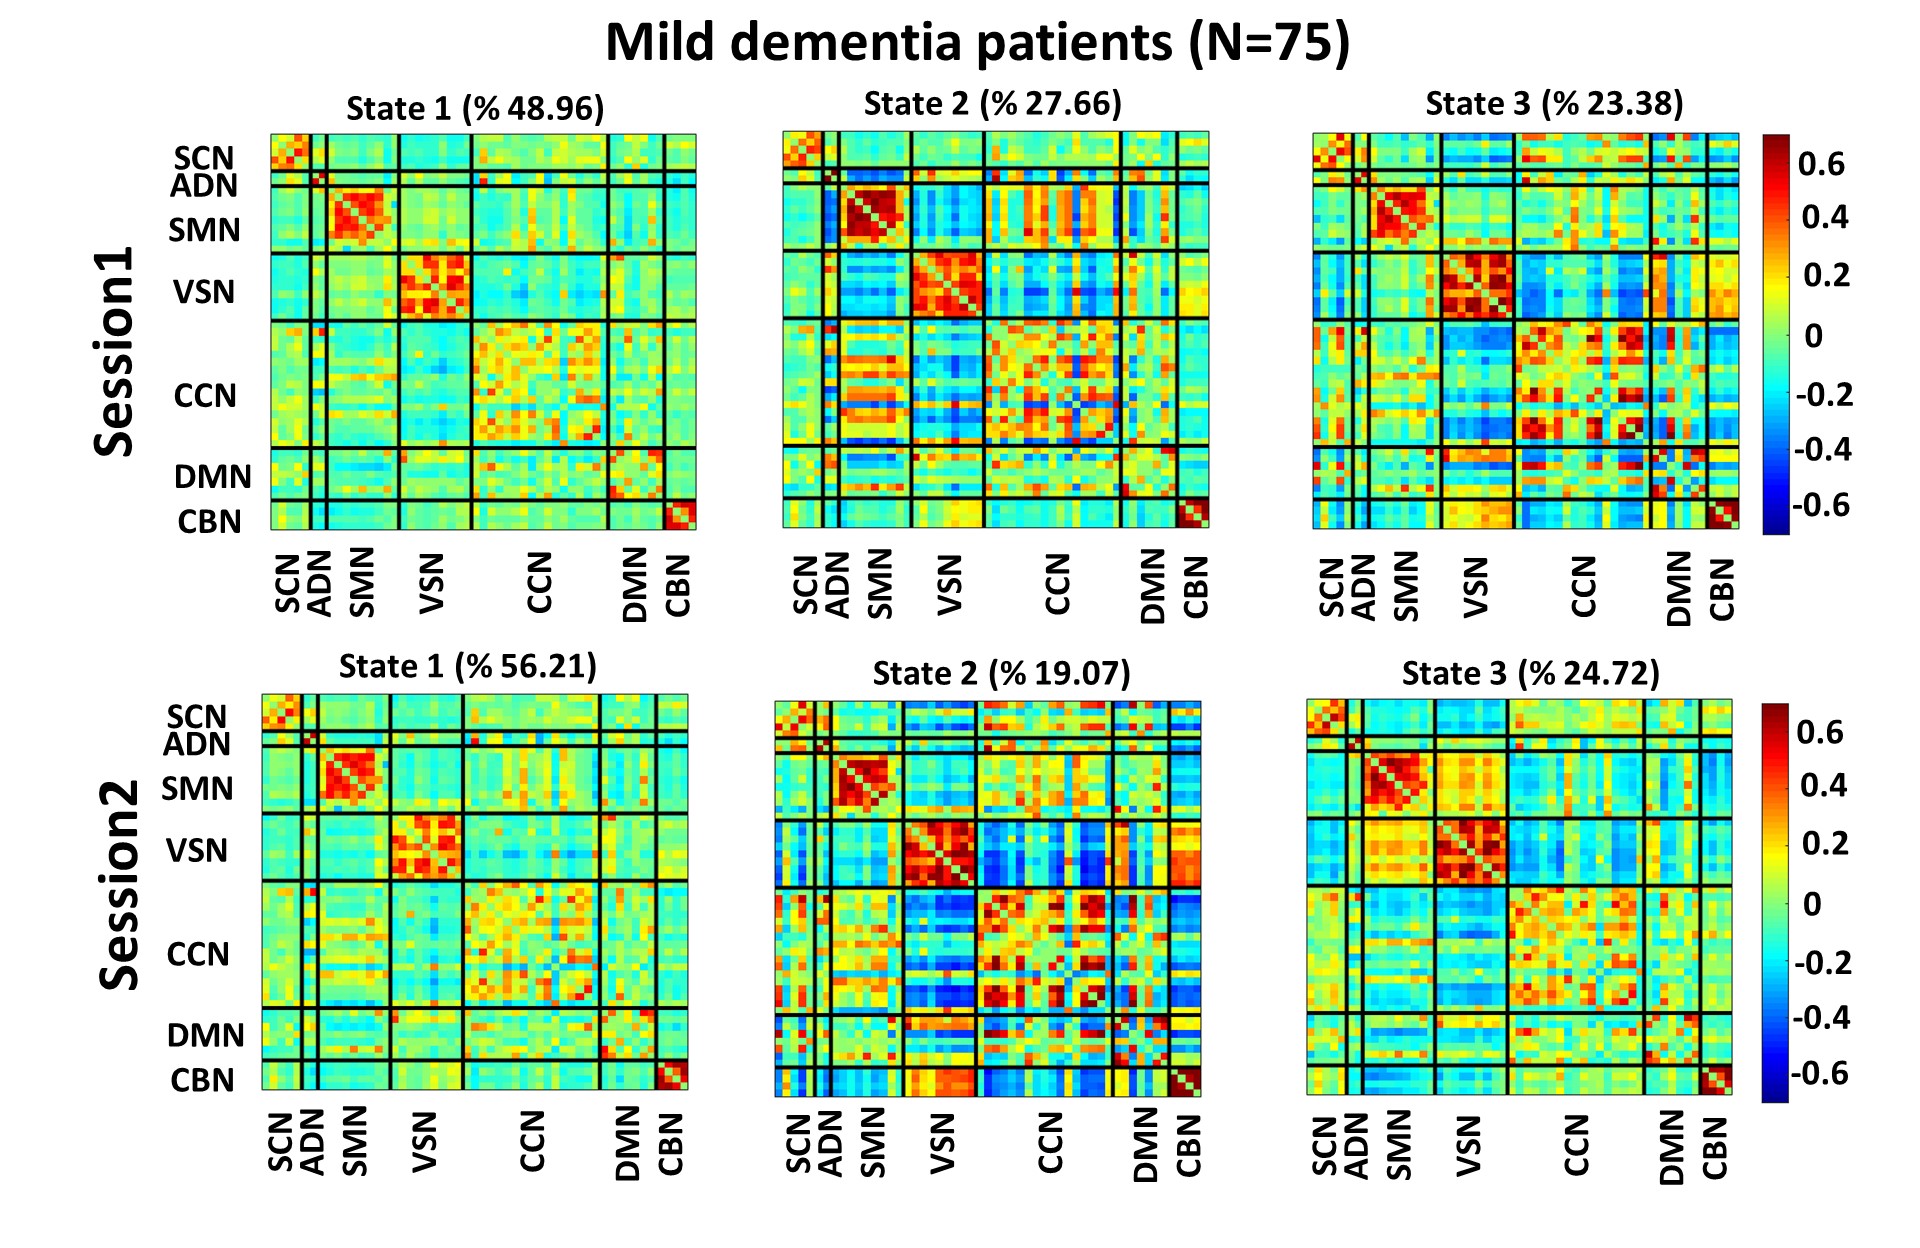
Fig. 3, Fig. 4, and Fig. 5 show the 3 states identified by k-means clustering of the dFNCs of HC subjects, MCI, and MD patients, respectively. As these figures show, HC and MCI groups produced similar FNC states in both sessions. The correlation between inter-session “matched” states for HCs and MCIs were more than 0.99 (p<0.0001). HC subjects spend more time in the state 1of Fig.3 (called HC-related state hereafter) with strong and positive connectivity of sensory networks than in the state 2 with weaker connectivity among these networks (p<0.001, Fig. 3). In comparison, MCI patients spend more time in state 3 of Fig. 4 (called AD-related state hereafter) with weaker connectivity between visual sensory and sensory-motor network than state 2, with stronger sensory connectivity (p<0.001, Fig. 4). This pattern has been observed in both sessions of HCs and MCIs. Also, the OCR of inter-session matched states were not significantly different in HC subjects and MCI patients. As Fig. 5 shows, MD patients did not generate similar brain states across two sessions. This points to a degradation in the stability of functional brain integration among MD patients, and interestingly, this instability was more pronounced in the HC-related state (state 3 in Fig. 5)Discussion
We show that transient brain connectivity patterns are significantly more stable in healthy people and mild cognitively impaired patients than those who have mild dementia, offering the possibility that intersession dFNC instability might provide early evidence of future AD progression. Also, our results suggest dFNC instability specific to sensory regions in mild dementia patients. These exciting findings may suggest that although relatively preserved and potentially due to high signals in these regions, regions involved in cross-modal sensory/motor integration are damaged.Conclusion
Our findings highlight brain instability as a potential biomarker of Alzheimer’s disease progression. Also, the instability of dFNC observed in mild dementia patients suggest multiple sessions of scanning in analyzing rs-fMRI data in this group of patients. Prospective studies are needed to explore the new biomarker proposed here in other neurological disorders and whether brain instability is a common biomarker of neurological disorders.Acknowledgements
The following NIH grants funded this work: R01AG063153, R01EB020407, R01MH094524, R01MH119069, R01MH118695, and R01MH121101.Also, we thank those who helped collect this valuable data.References
1 Masters CL, Bateman R, Blennow K, Rowe CC, Sperling RA, Cummings JL. Alzheimer’s disease. Nature Reviews Disease Primers 2015; 1: 1–18.
2 Yiannopoulou KG, Papageorgiou SG. Current and Future Treatments in Alzheimer Disease: An Update. Journal of Central Nervous System Disease 2020; 12: 117957352090739.
3 Abrol A, Damaraju E, Miller RL, Stephen JM, Claus ED, Mayer AR et al. Replicability of time-varying connectivity patterns in large resting-state fMRI samples. NeuroImage 2017; 163: 160–176.
4 Wang XH, Jiao Y, Li L. Identifying individuals with attention deficit hyperactivity disorder based on temporal variability of dynamic functional connectivity. Scientific Reports 2018; 8: 1–12.
5 Du Y, Fu Z, Sui J, Gao S, Xing Y, Lin D et al. NeuroMark: An automated and adaptive ICA based pipeline to identify reproducible fMRI markers of brain disorders. NeuroImage: Clinical 2020; 28: 102375.
Figures
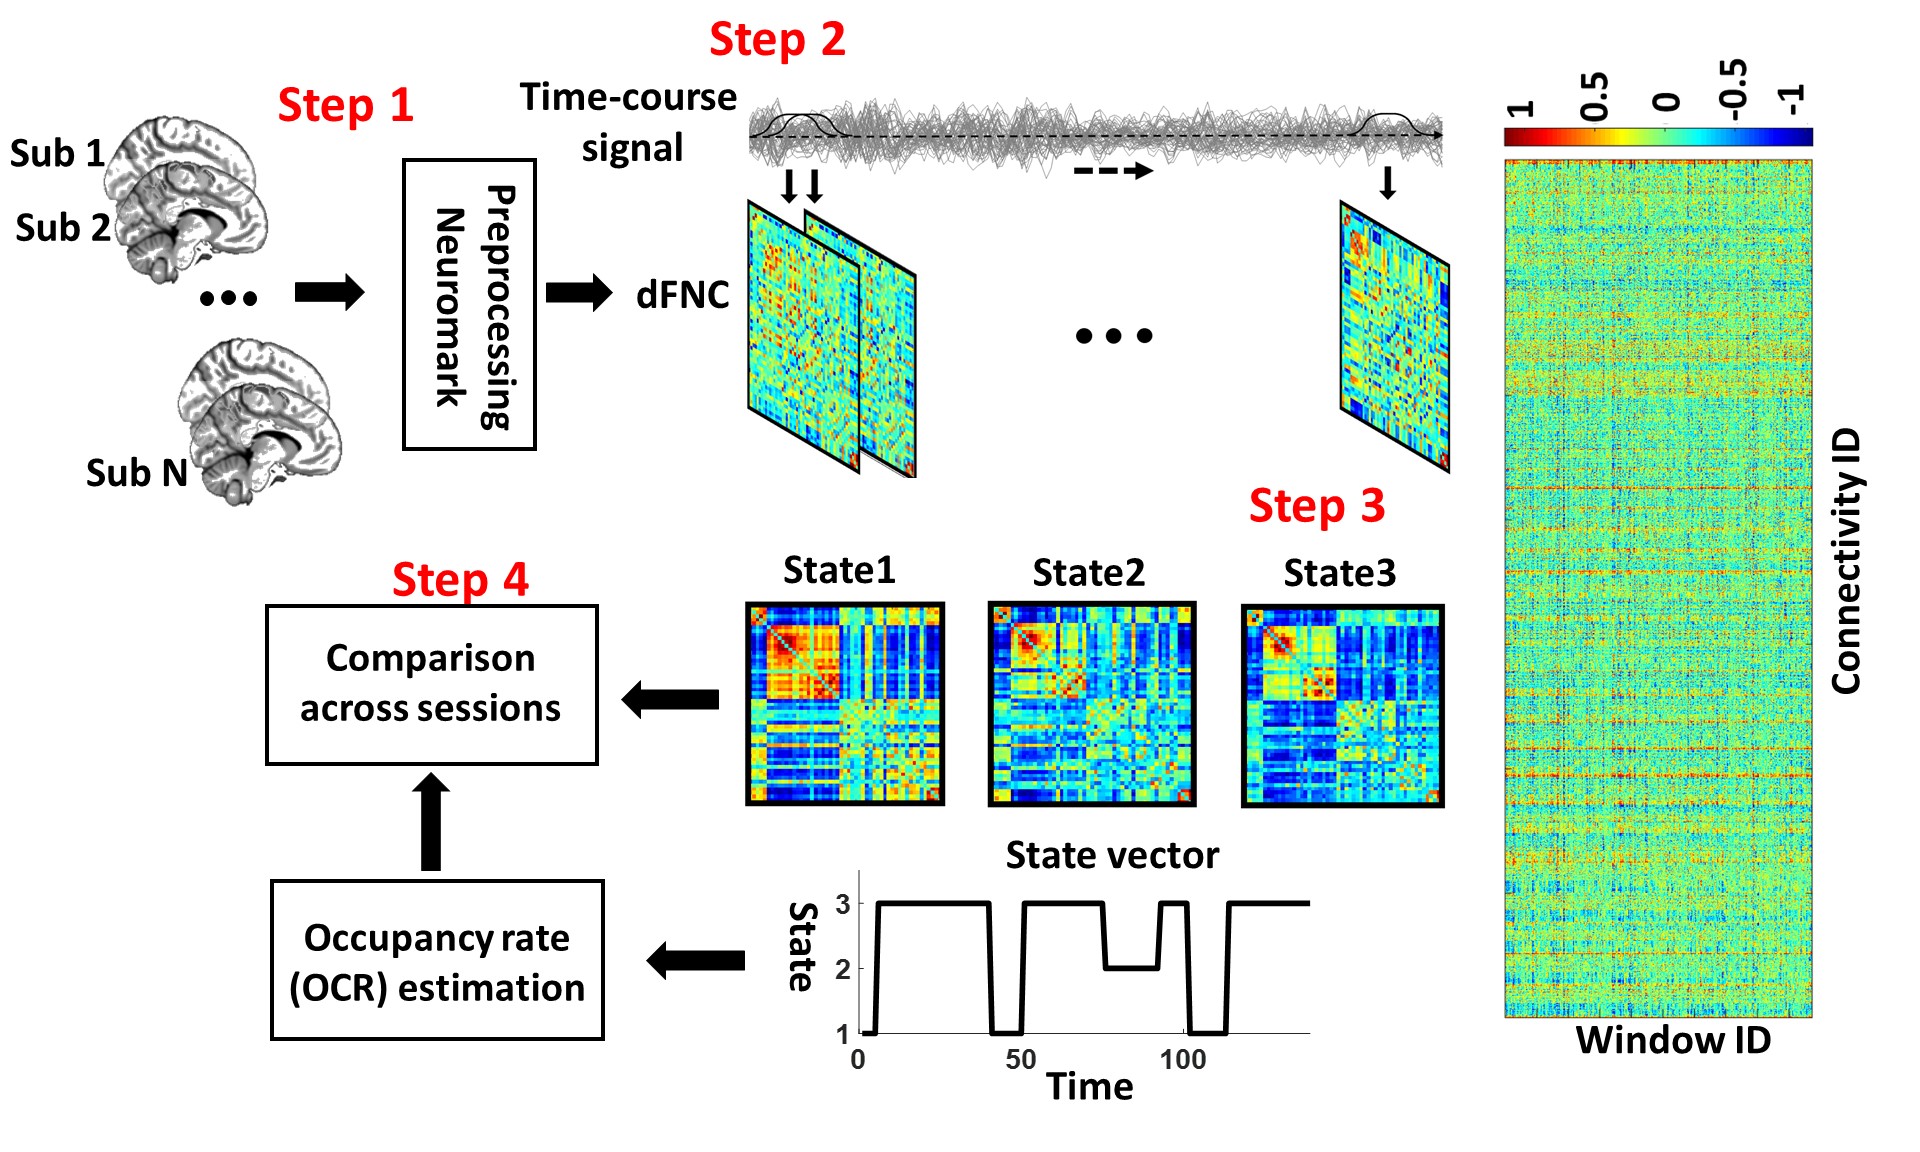
Fig.1: Analytic pipeline. Step1: The time-course signal of 53 ICNs have been identified using group-ICA in the Neuromark template. Step2: A taper sliding window was used to segment the time-course signals and then calculated the functional network connectivity (FNC). Each subject has 139 FNCs with a size of 53×53. Step3: A k-means clustering with correlation as distance metrics was used to group FNCs to three distinct clusters. Then, based on the state vector, we calculated the occupancy rate (OCR) for each subject. Step4: Finally, we compared the dFNC states across two sessions.