0264
Age-related alterations in cortical myelin profile using the Human Connectome Project Aging dataset1Radiology, New York University Grossman School of Medicine, New York, NY, United States
Synopsis
Demyelination is recognized as a major process in both normal aging and neurodegenerative diseases. Using the Human Connectome Project Aging dataset, we investigated intracortical demyelination in normal aging using T1w/T2w maps. To capture the fine changes across cortical layers, we employed a surface-based approach in contrast to the commonly used volumetric approach by constructing a cortical myelin profile for each region, which was then quantified using a nonlinearity index. We showed that the nonlinearity of cortical myelin profile exhibits a steeper decline with aging than cortical thickness and therefore presents the potential of a unique marker of age-related microstructural changes.
Purpose
Demyelination has been proposed to be one of the earliest age-related neurodegeneration processes and is observed in both healthy aging and aging disorders such as Alzheimer’s disease. Although previous imaging and histological studies have supported demyelination’s progression with age [1-3], it remains little studied to date whether it affects cortical layers equally or differentially. Here, we employed The Human Connectome Project in Aging (HCP-A) dataset [4] to investigate fine changes in the cerebral cortex with aging using a novel surface-based data analysis approach. Cortical myelin profiles were generated based on T1w/T2w ratio maps [5] and characterized using a nonlinearity index (NLI) [6, 7]. Using NLI and layer specific myelin data, we examined the age-related changes in cortical myelin profile and cortical thickness (CT).Methods
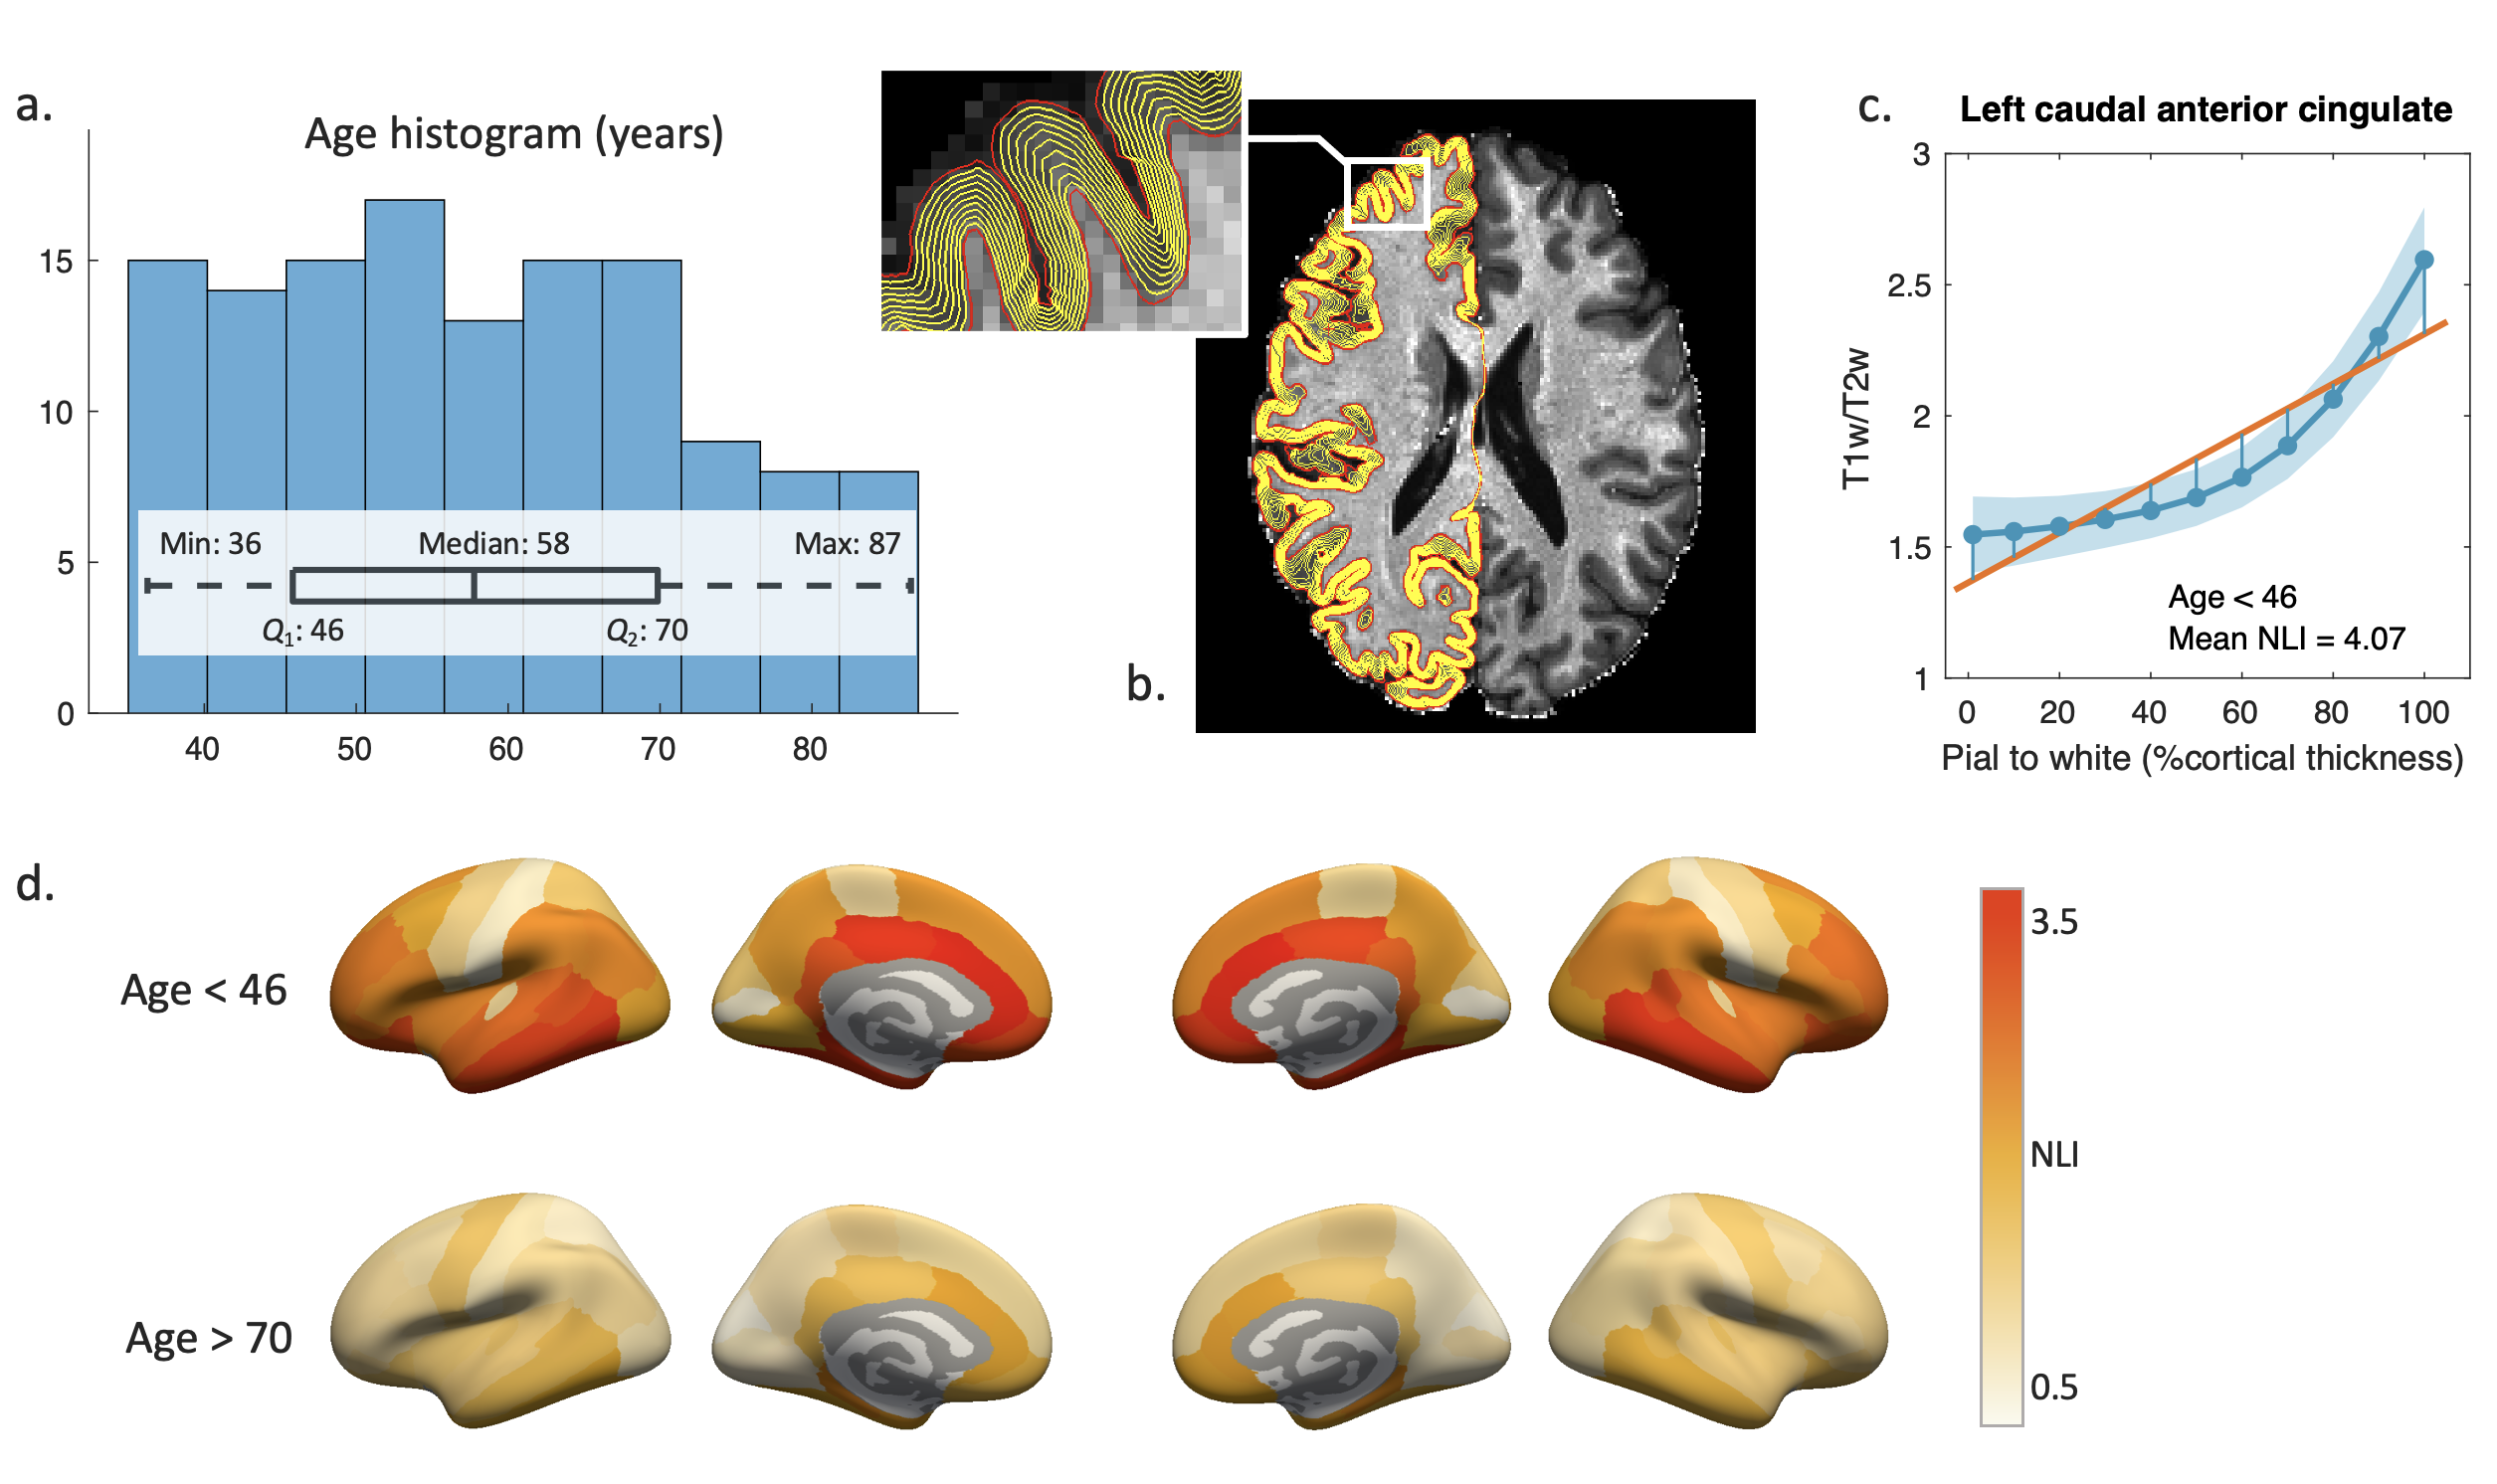
A total of 129 datasets from the HCP-A (corresponding to the first data download) were included in the current study. High resolution T1w/T2w maps provided with the dataset [8] were used to estimate myelin content in the cortex. Regional T1w/T2w values out of three interquartile range below the first or above the third quartile were deemed outliers and removed.To characterize layer-specific myelin changes with age, T1w/T2w values were sampled from the pial to white matter surface on 11 uniformly spaced surfaces using FreeSurfer’s mri_vol2surf. Cortical myelin profiles (Figure 1b) were obtained for 68 cortical regions delineated using the Desikan-Killiany atlas. The NLI was calculated for each region as the root mean squared deviation of the profile curve from a linear fitting line (Figure 1c). All analyses were completed in native subject space. Finally, NLI values across regions from all datasets were normalized to a mean of 2 and a standard deviation of 1.
Mean CT data for each of the examined regions were extracted for each subject from the FreeSurfer recon-all output of the HCP preprocessing pipelines.
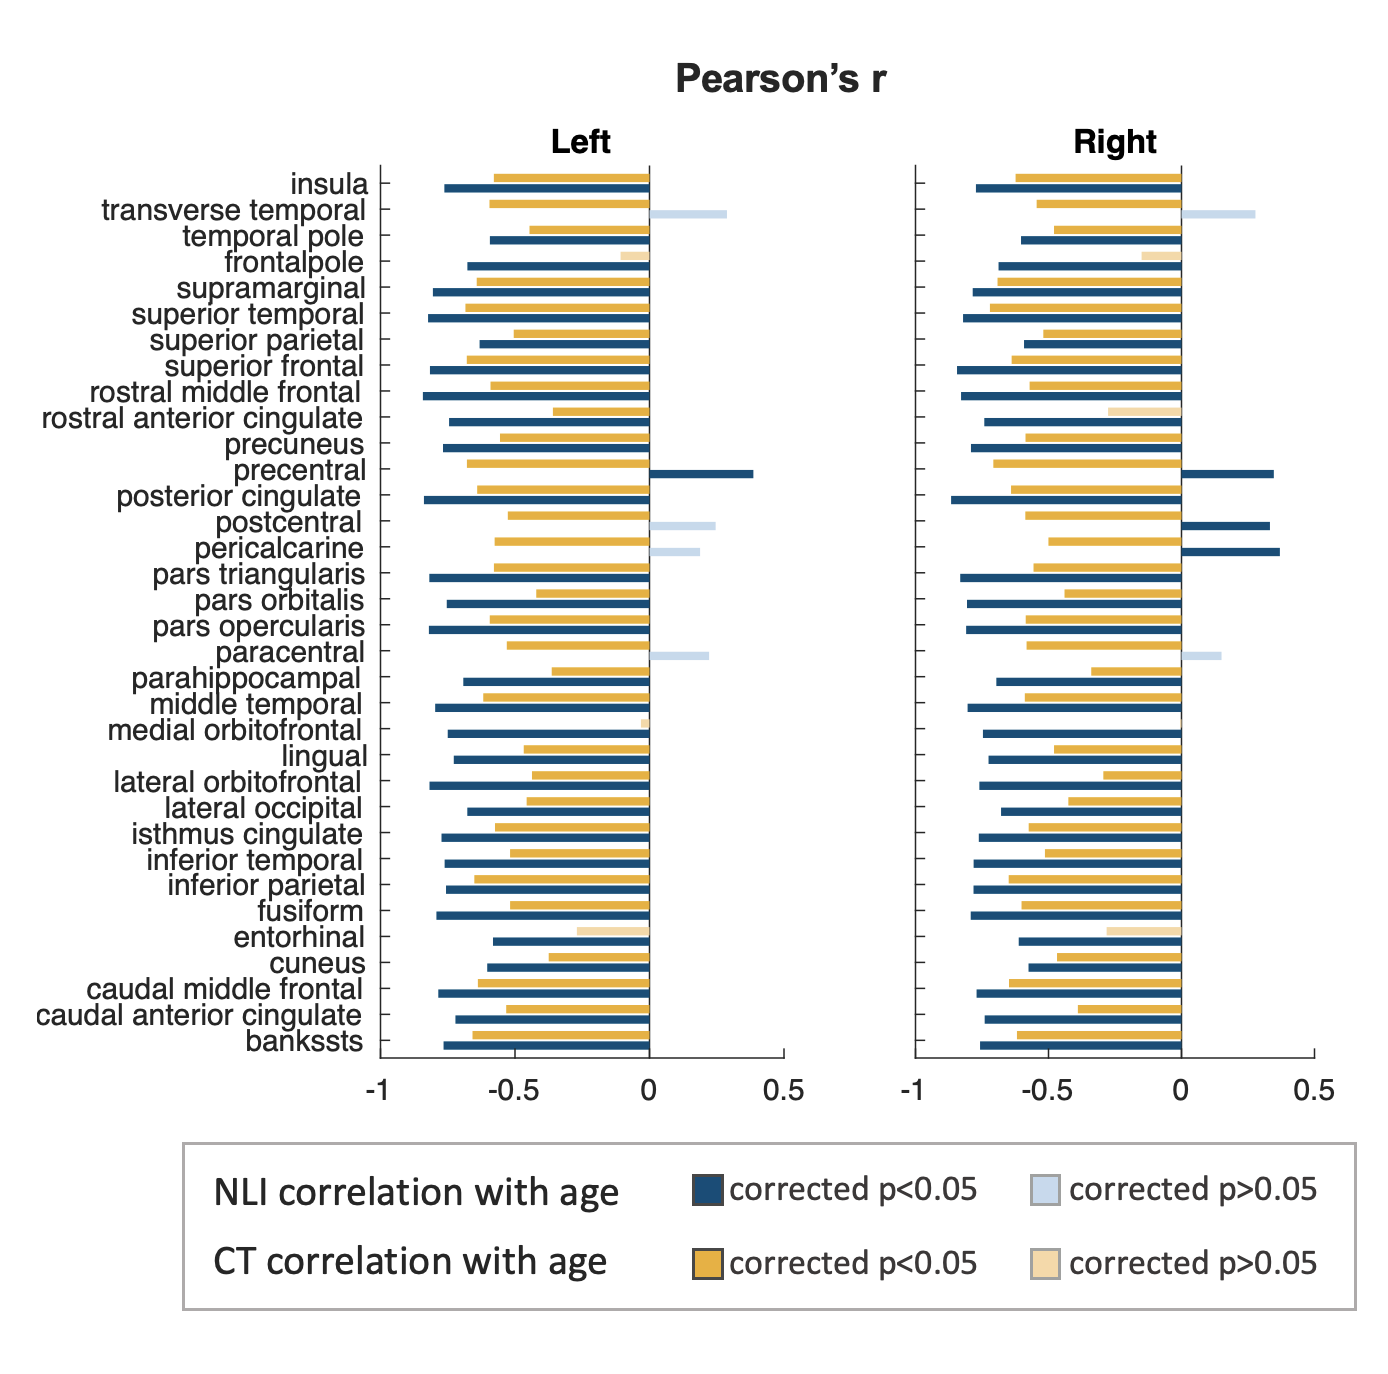
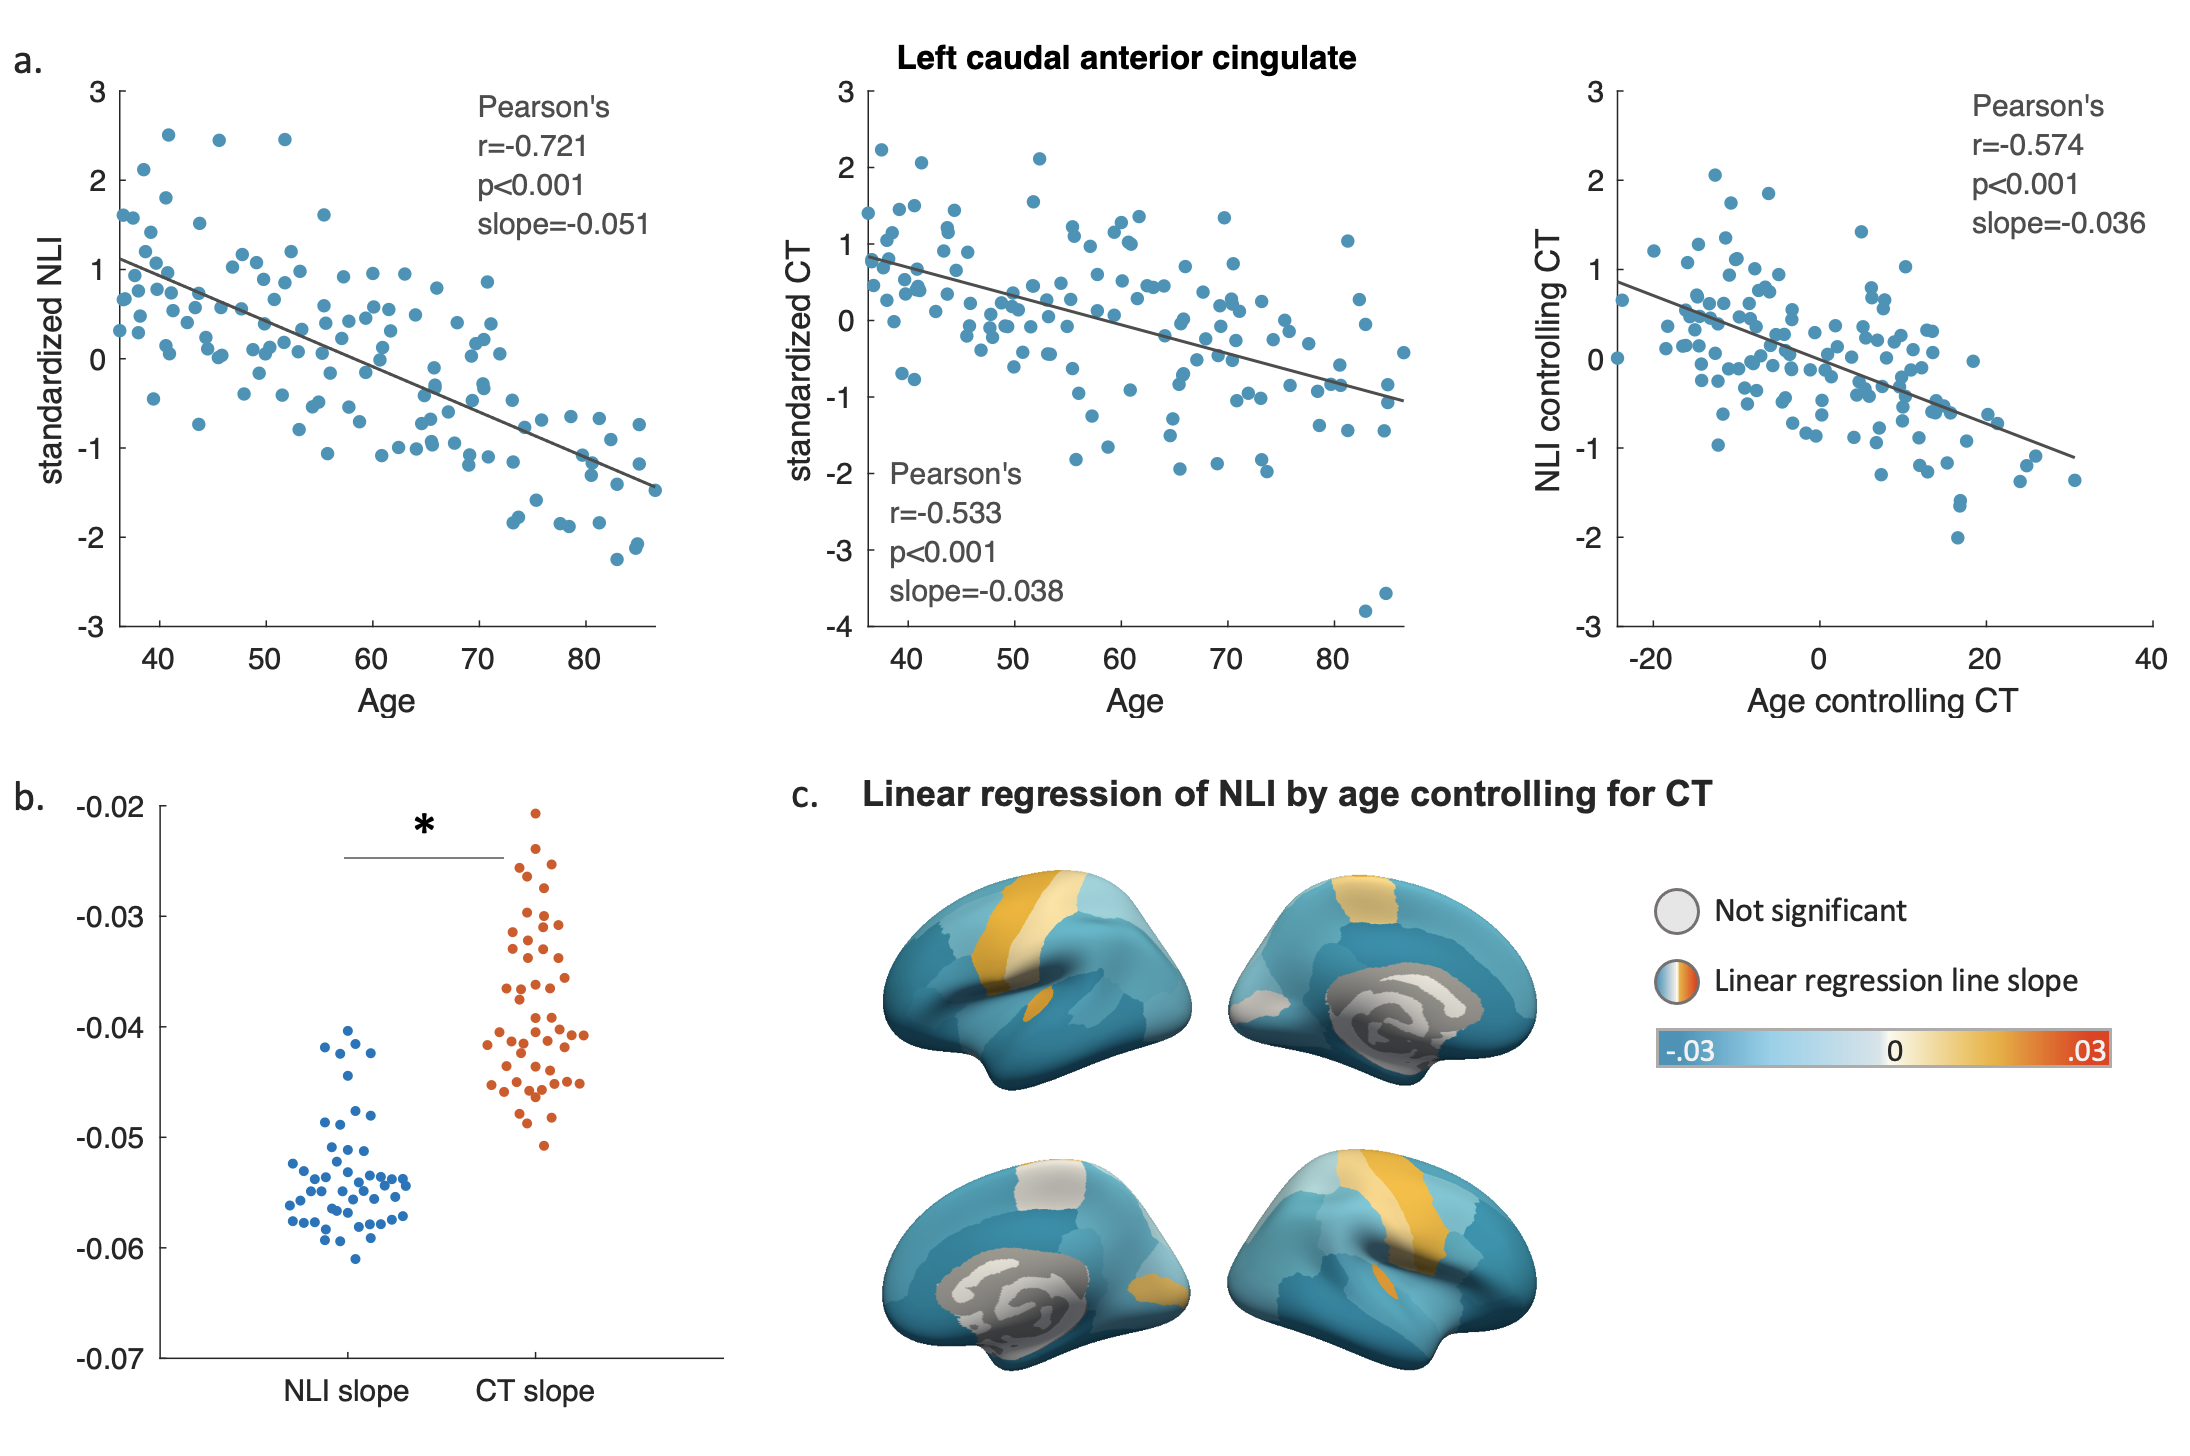
Pearson’s and partial correlation were used to test the association of NLI and CT with subjects’ age. To compare the changing rates of NLI and CT in aging, both metrics were standardized to the same scale before a linear regression line was generated for their correlations with age in each atlas regions. The regression slopes for NLI and CT in cortical regions were then compared using a paired sample t-test. All test results were considered significant at p<0.05, Bonferroni corrected for multiple comparisons.
Results
Regional variations in NLI were observed across cortical regions, with higher NLI values found in prefrontal, cingulate, and temporal lobe regions, and lower values along central sulcus and occipital lobe (Figure 1d).Both NLI and CT were found to significantly decrease with age in most regions across the brain (corrected p<0.05; Figure 2). In limited regions near the central sulcus, significant positive correlations between NLI and age were also noted. In regions with significant age-related decreases for both NLI and CT (51 regions), paired sample t-test revealed that the slopes of standardized NLI changes with age were substantially steeper than that for CT (p<0.01; Figure 3b). Partial correlation analysis further showed that NLI’s association with age remained significant after controlling for regional CT (Figure 3a). Regions showing the steepest NLI decreases with age were found in bilateral orbitofrontal, middle temporal, and cingulate areas (Figure 3c).
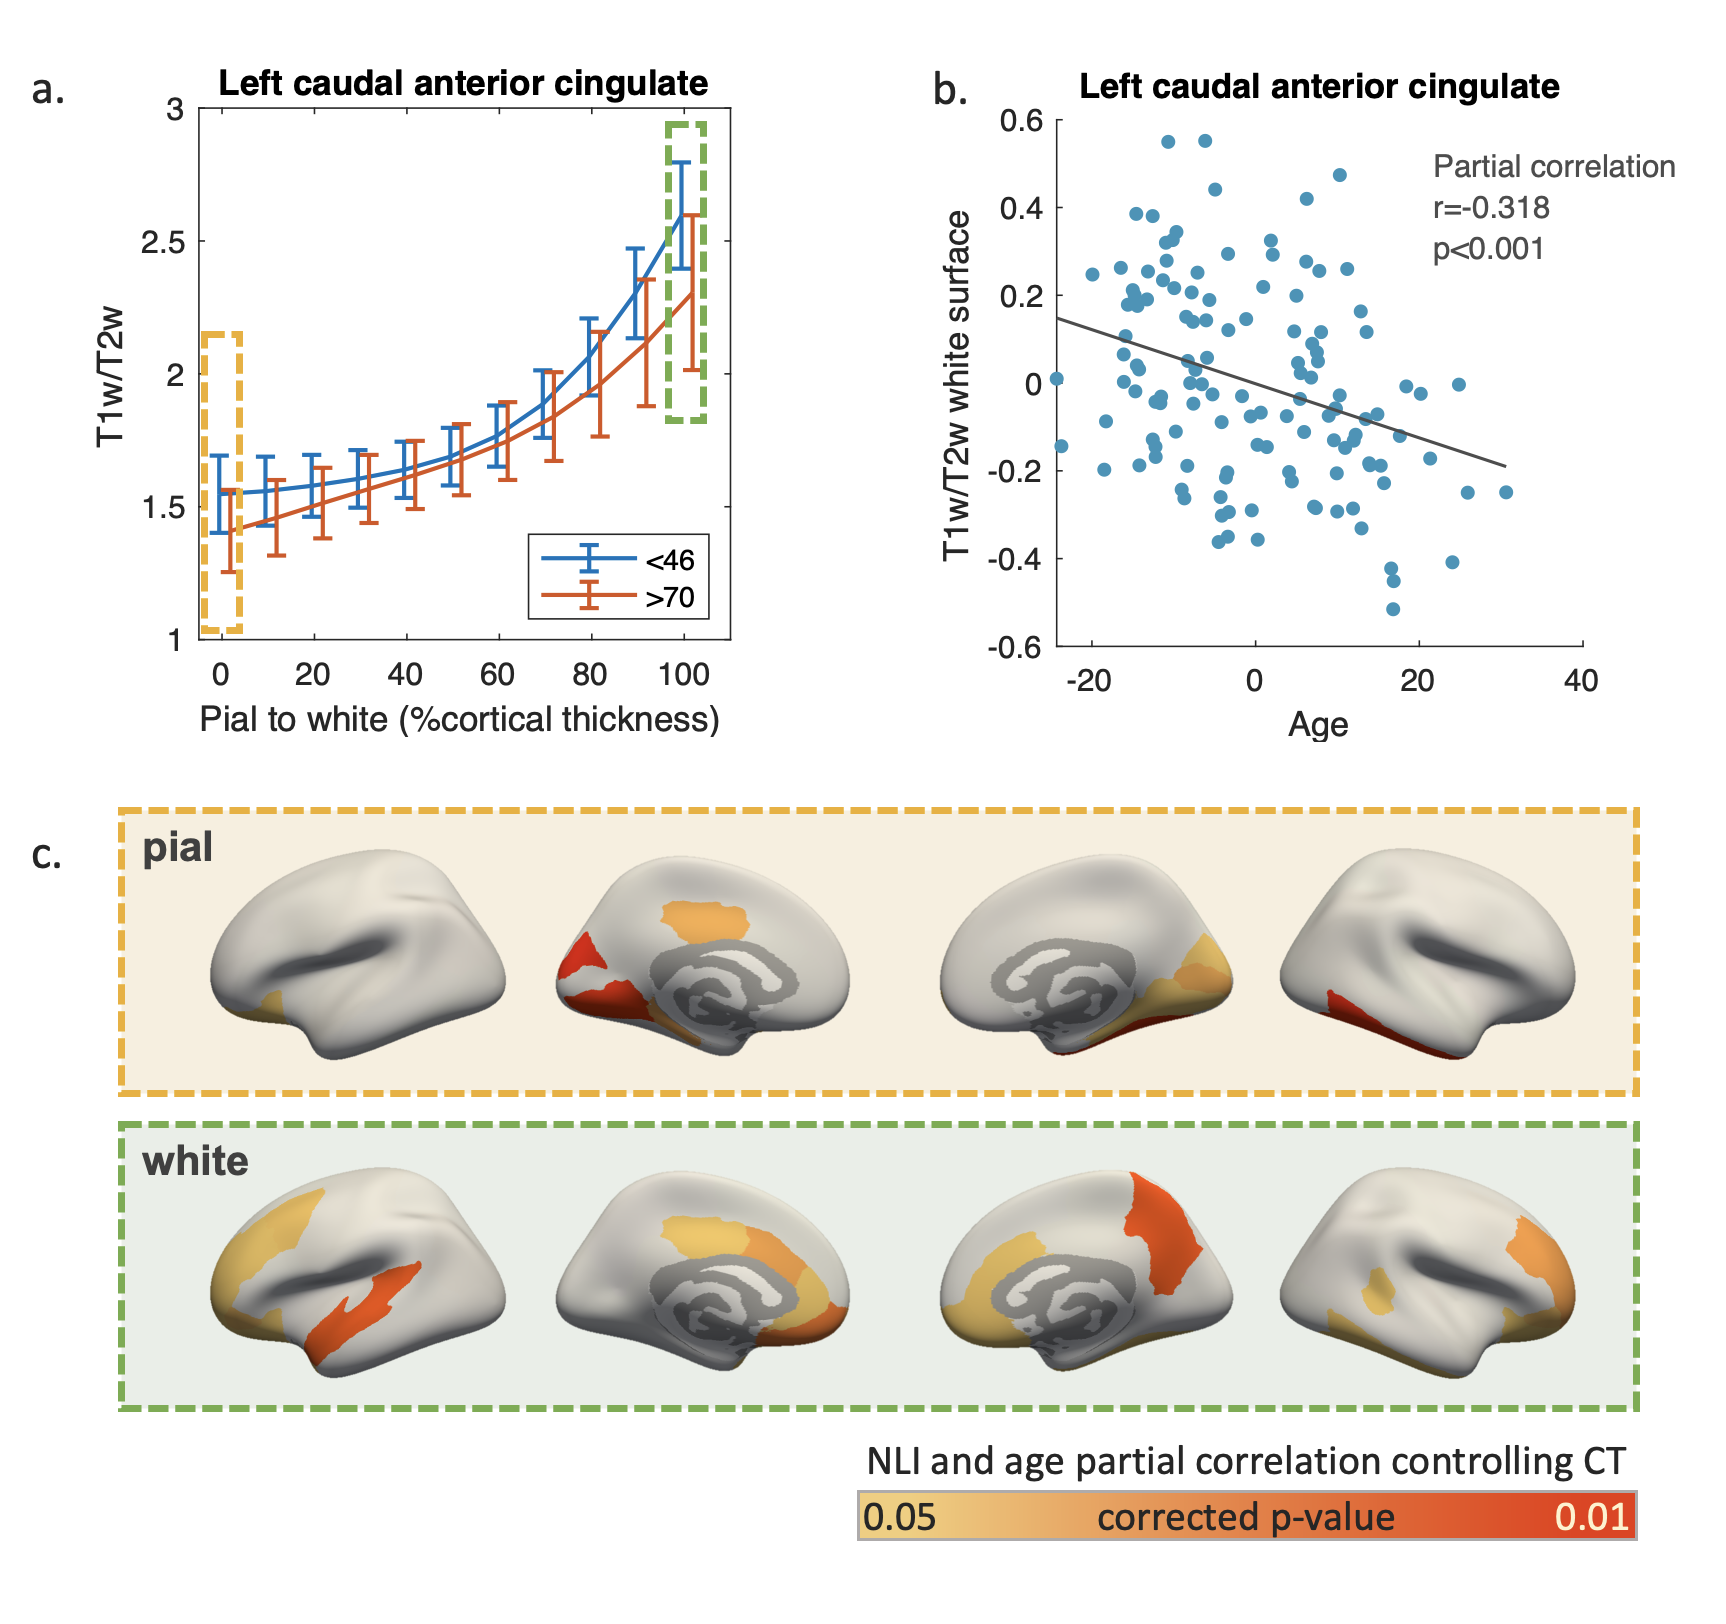
Visual inspection of regional T1w/T2w profiles of the youngest and oldest 25% participants revealed that T1w/T2w differences concentrated near the pial and white surfaces (Figure 4a). Partial correlation controlling for regional CT found a significant inverse correlation between age and T1w/T2w at pial surface primarily in the inferior temporal and occipital regions, and at white matter surface in extended areas including the middle frontal and cingulate areas (Figure 4b).
Discussion
Changes in the cortical myelin profile were observed in normal aging. While cortical myelin profile described by T1w/T2w maps may inherently associate with regional CT values, depth specific T1w/T2w changes with age that are reflected in profile NLI alterations cannot be fully explained by reduced CT. Considering the layered organization of the cerebral cortex, these CT-independent changes suggest myelin abnormalities and neurodegeneration non-uniformly affect the cortex. Moreover, in a majority of cortical regions, NLI appears to have a steeper decline with age than CT. Therefore, the NLI of cortical myelin profile may serve as a biomarker in aging that provides unique information on age-related microstructural changes.Further examination of cortical myelin profile changes revealed that age dependent T1w/T2w decreases are primarily found near the pial and white matter surfaces. Major changes in T1w/T2w were observed at the white matter surface across the frontal, inferior parietal, cingulate, and temporal areas, regions known to associate with cognition and emotion regulation. These alterations in myelin content at the grey/white matter-boundary may reflect compromised connectivity of these regions to the rest of the brain and can therefore underlie age-related declines in corresponding brain functions.
Conclusion
Using the nonlinearity index of cortical myelin profile, we observed substantial age-related microstructural changes in addition to those captured by macroscale cortical thickness measures. These results highlight layer-specific demyelination and neurodegeneration in normal aging.Acknowledgements
We thank the Human Connectome Project in Aging for acquiring, preprocessing, and curating this data repository.References
1. Feldman, M.L. and A. Peters, Ballooning of myelin sheaths in normally aged macaques. J Neurocytol, 1998. 27(8): p. 605-14.
2. Grydeland, H., et al., Intracortical myelin links with performance variability across the human lifespan: results from T1- and T2-weighted MRI myelin mapping and diffusion tensor imaging. J Neurosci, 2013. 33(47): p. 18618-30.
3. Peters, A., The effects of normal aging on myelinated nerve fibers in monkey central nervous system. Frontiers in neuroanatomy, 2009. 3: p. 11.
4. Bookheimer, S.Y., et al., The Lifespan Human Connectome Project in Aging: An overview. Neuroimage, 2019. 185: p. 335-348.
5. Glasser, M.F. and D.C. Van Essen, Mapping human cortical areas in vivo based on myelin content as revealed by T1- and T2-weighted MRI. J Neurosci, 2011. 31(32): p. 11597-616.
6. Sui, Y.V., et al., Characterizing cortical myeloarchitecture in schizophrenia spectrum disorder. In Proceedings Organization of Human Brain Mapping 26th Annual Meeting, 2020.
7. Sprooten, E., et al., Depth-dependent intracortical myelin organization in the living human brain determined by in vivo ultra-high field magnetic resonance imaging. Neuroimage, 2019. 185: p. 27-34.
8. Glasser, M.F., et al., The minimal preprocessing pipelines for the Human Connectome Project. Neuroimage, 2013. 80: p. 105-24.
Figures