0263
Alterations in dynamic functional connectivity in individuals with subjective cognitive decline1Department of Radiology, Drum Tower Hospital, Clinical College of Nanjing Medical University, Nanjing, China, 2Department of Radiology, Drum Tower Hospital, Medical School of Nanjing University, Nanjing, China, 3Philips Healthcare, Shanghai, China
Synopsis
Subjective cognitive decline (SCD) is considered a clinically-based approach for the detection of potential Alzheimer’s disease patients. We observed altered temporal properties of fractional windows, mean dwell time, and the number of transitions by dynamic functional connectivity (DFC) analysis in SCD individuals compared to the control subjects. The altered DFC parameters showed significant associations with cognitive performance. Our findings shed light on the role of DFC in the early detection of subjects with potential Alzheimer’s disease, and the alterations in DFC may suggest the neural basis underlying early cognitive decline in the SCD stage.
Introduction
Individuals with subjective cognitive decline (SCD), a self-perceived worsening of cognitive function without objectively detected deficits, have been considered at higher risk of Alzheimer’s disease1, 2. Dynamic functional connectivity (DFC) analysis has been proven a promising approach for exploring temporal aspects of information processing across brain networks3, 4. We aimed to investigate the DFC and topological characteristics in SCD individuals, and the associations of DFC and topological properties with cognitive performance, which could benefit a better understanding of the neural basis underlying early cognitive decline and also provide promising neuroimaging biomarkers for the detection of incipient AD patients.Methods
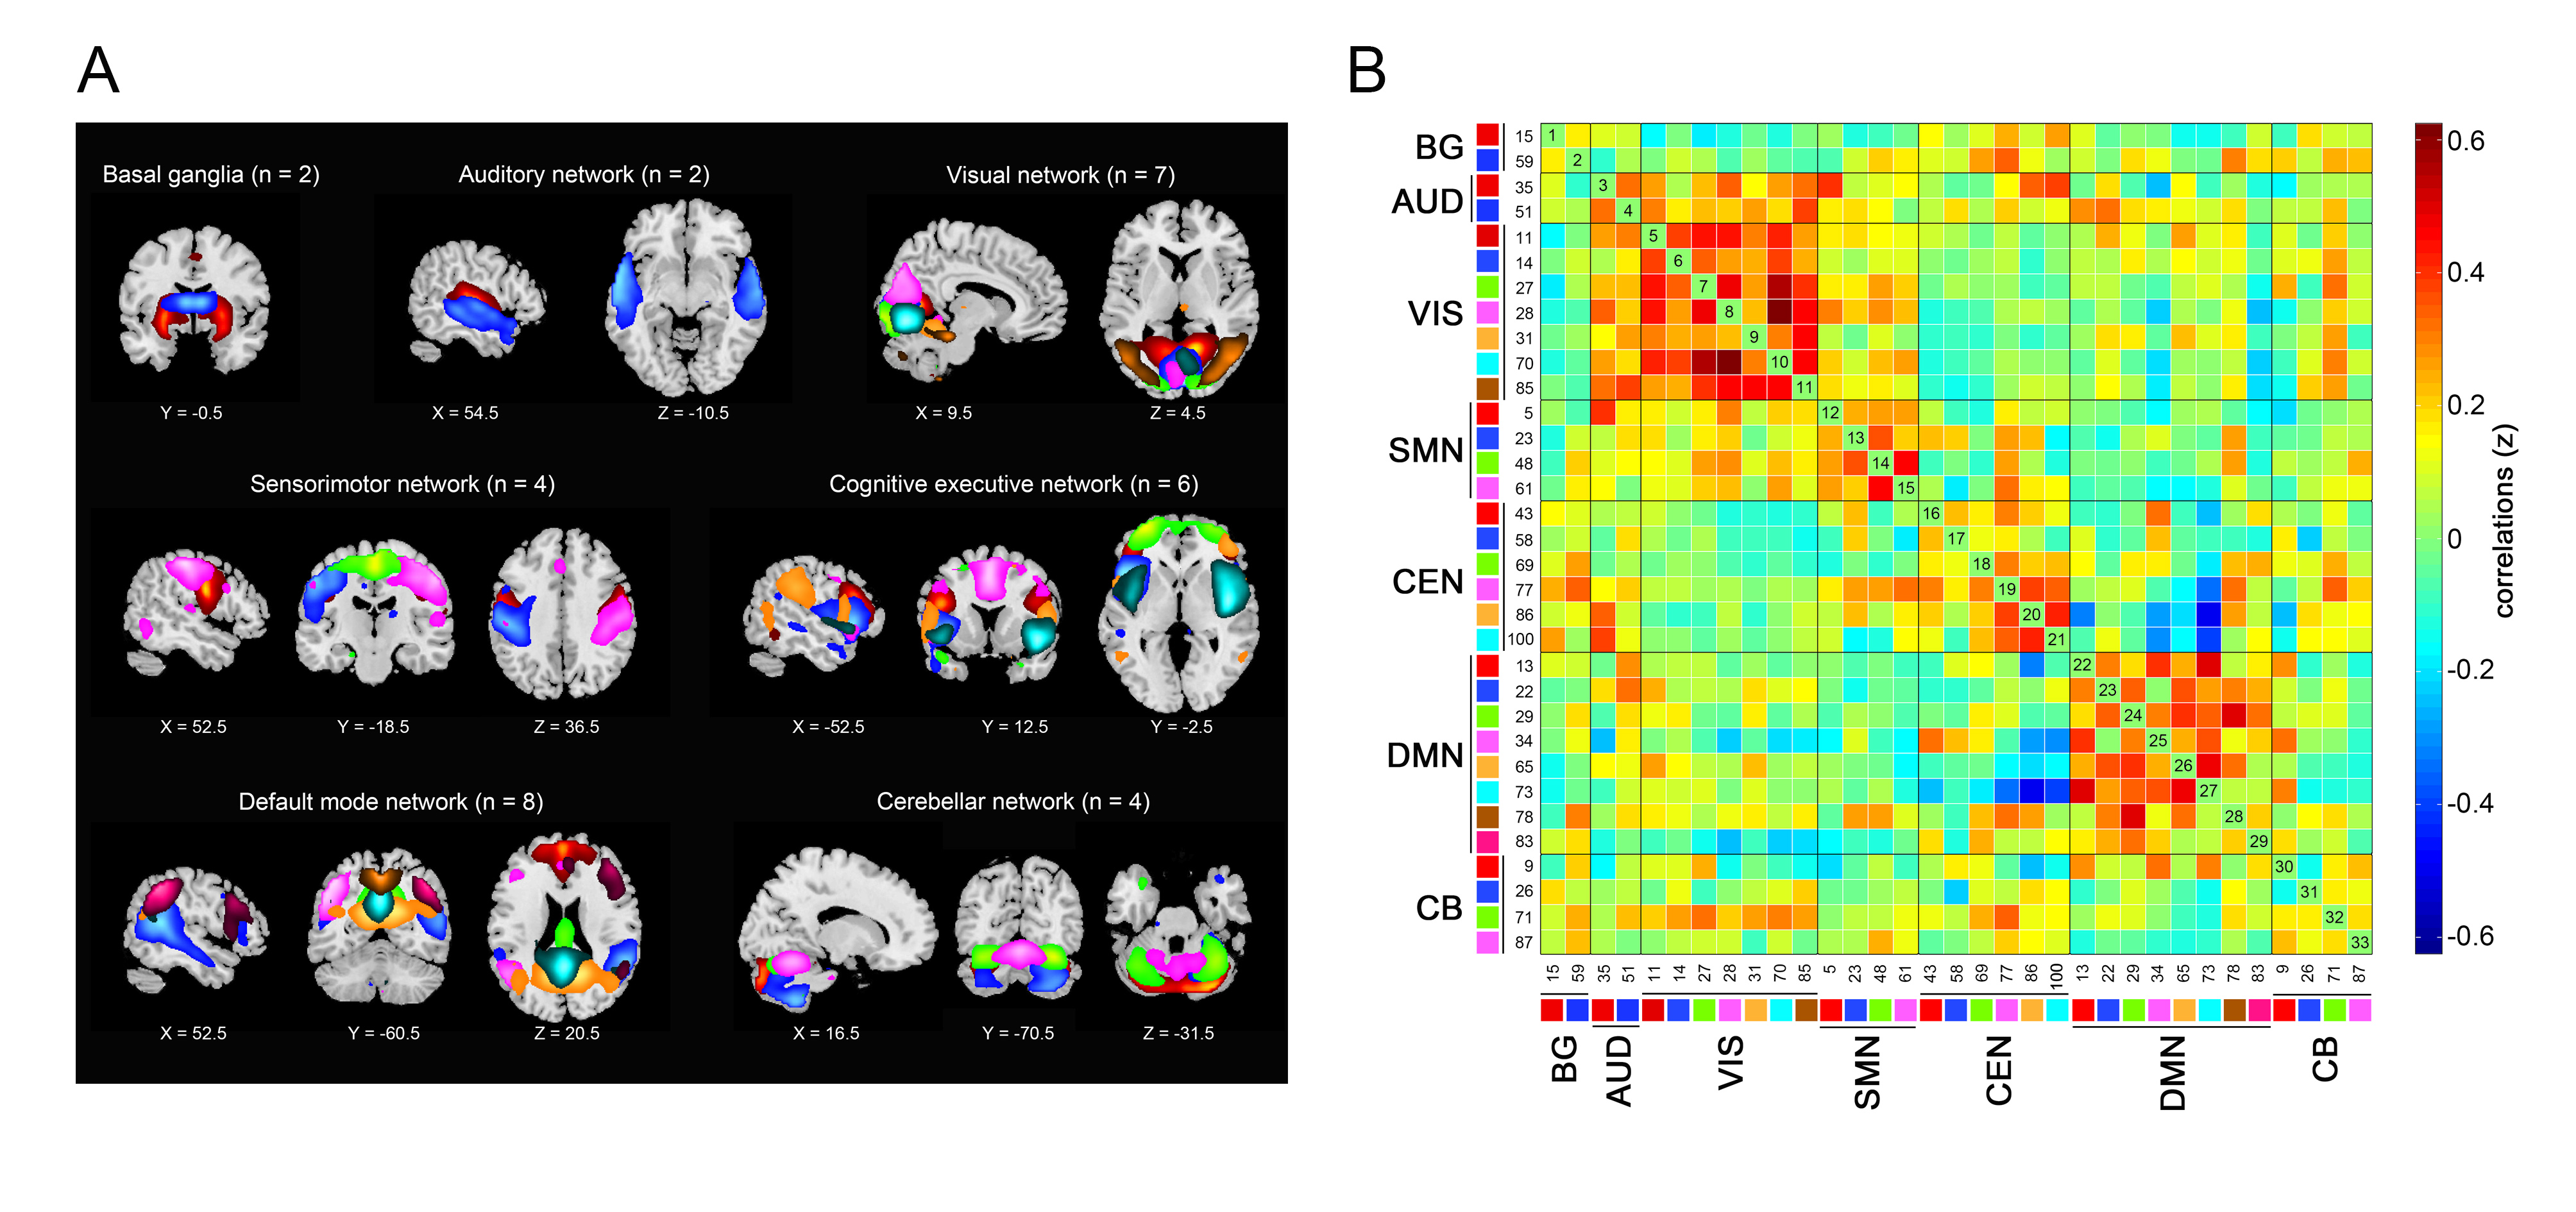
Thirty-three control subjects and thirty-two SCD individuals were enrolled and performed the neuropsychological evaluation and resting-state functional magnetic resonance imaging (rs-fMRI) scanning in the 3.0 T Achieva TX System (Philips Healthcare, Best, The Netherlands). Following a previously described procedure5, thirty-three components were selected by group independent component analysis (ICA) to construct seven functional networks (basal ganglia, auditory, visual, sensorimotor, cognitive executive, default mode, and cerebellar network) using the Group ICA of fMRI Toolbox (GIFT)6. Based on the sliding window approach and k-means clustering, distinct DFC states with specific connectivity patterns were identified. We calculated the temporal properties of fractional windows and mean dwell time of each state and number of transitions between each pair of DFC states7. The global and local topological parameters were assessed by graph theory analysis using the GRETNA software8. The differences in DFC and topological metrics, and the associations of the altered neuroimaging measures with cognitive performance were assessed using SPSS version 21.0.Results
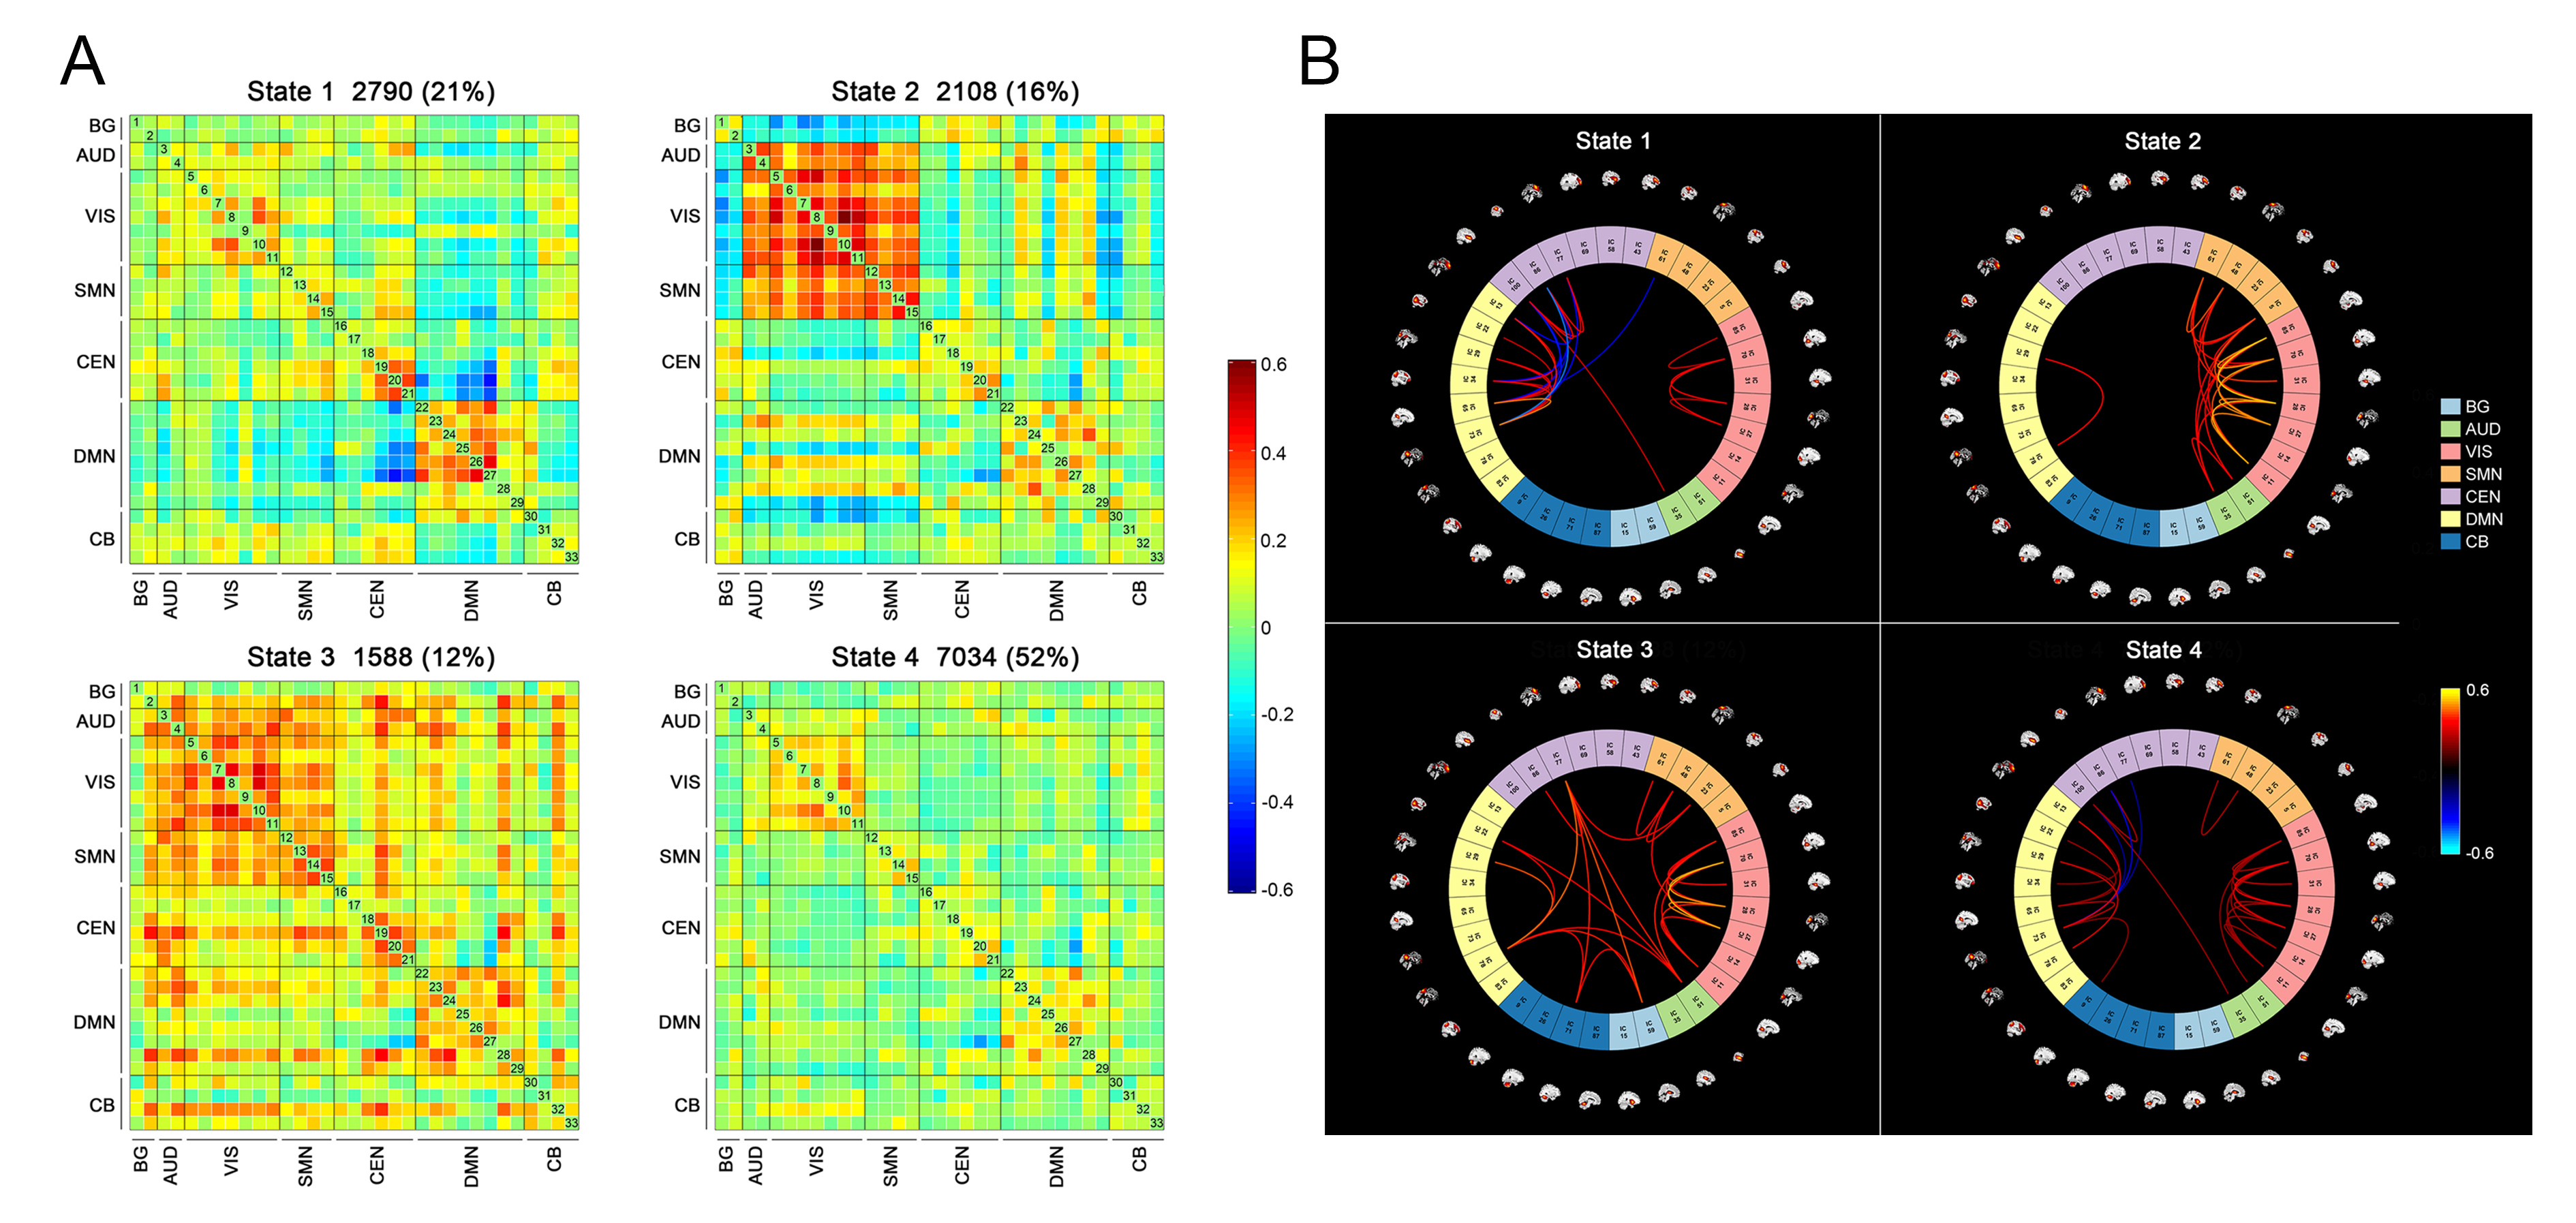
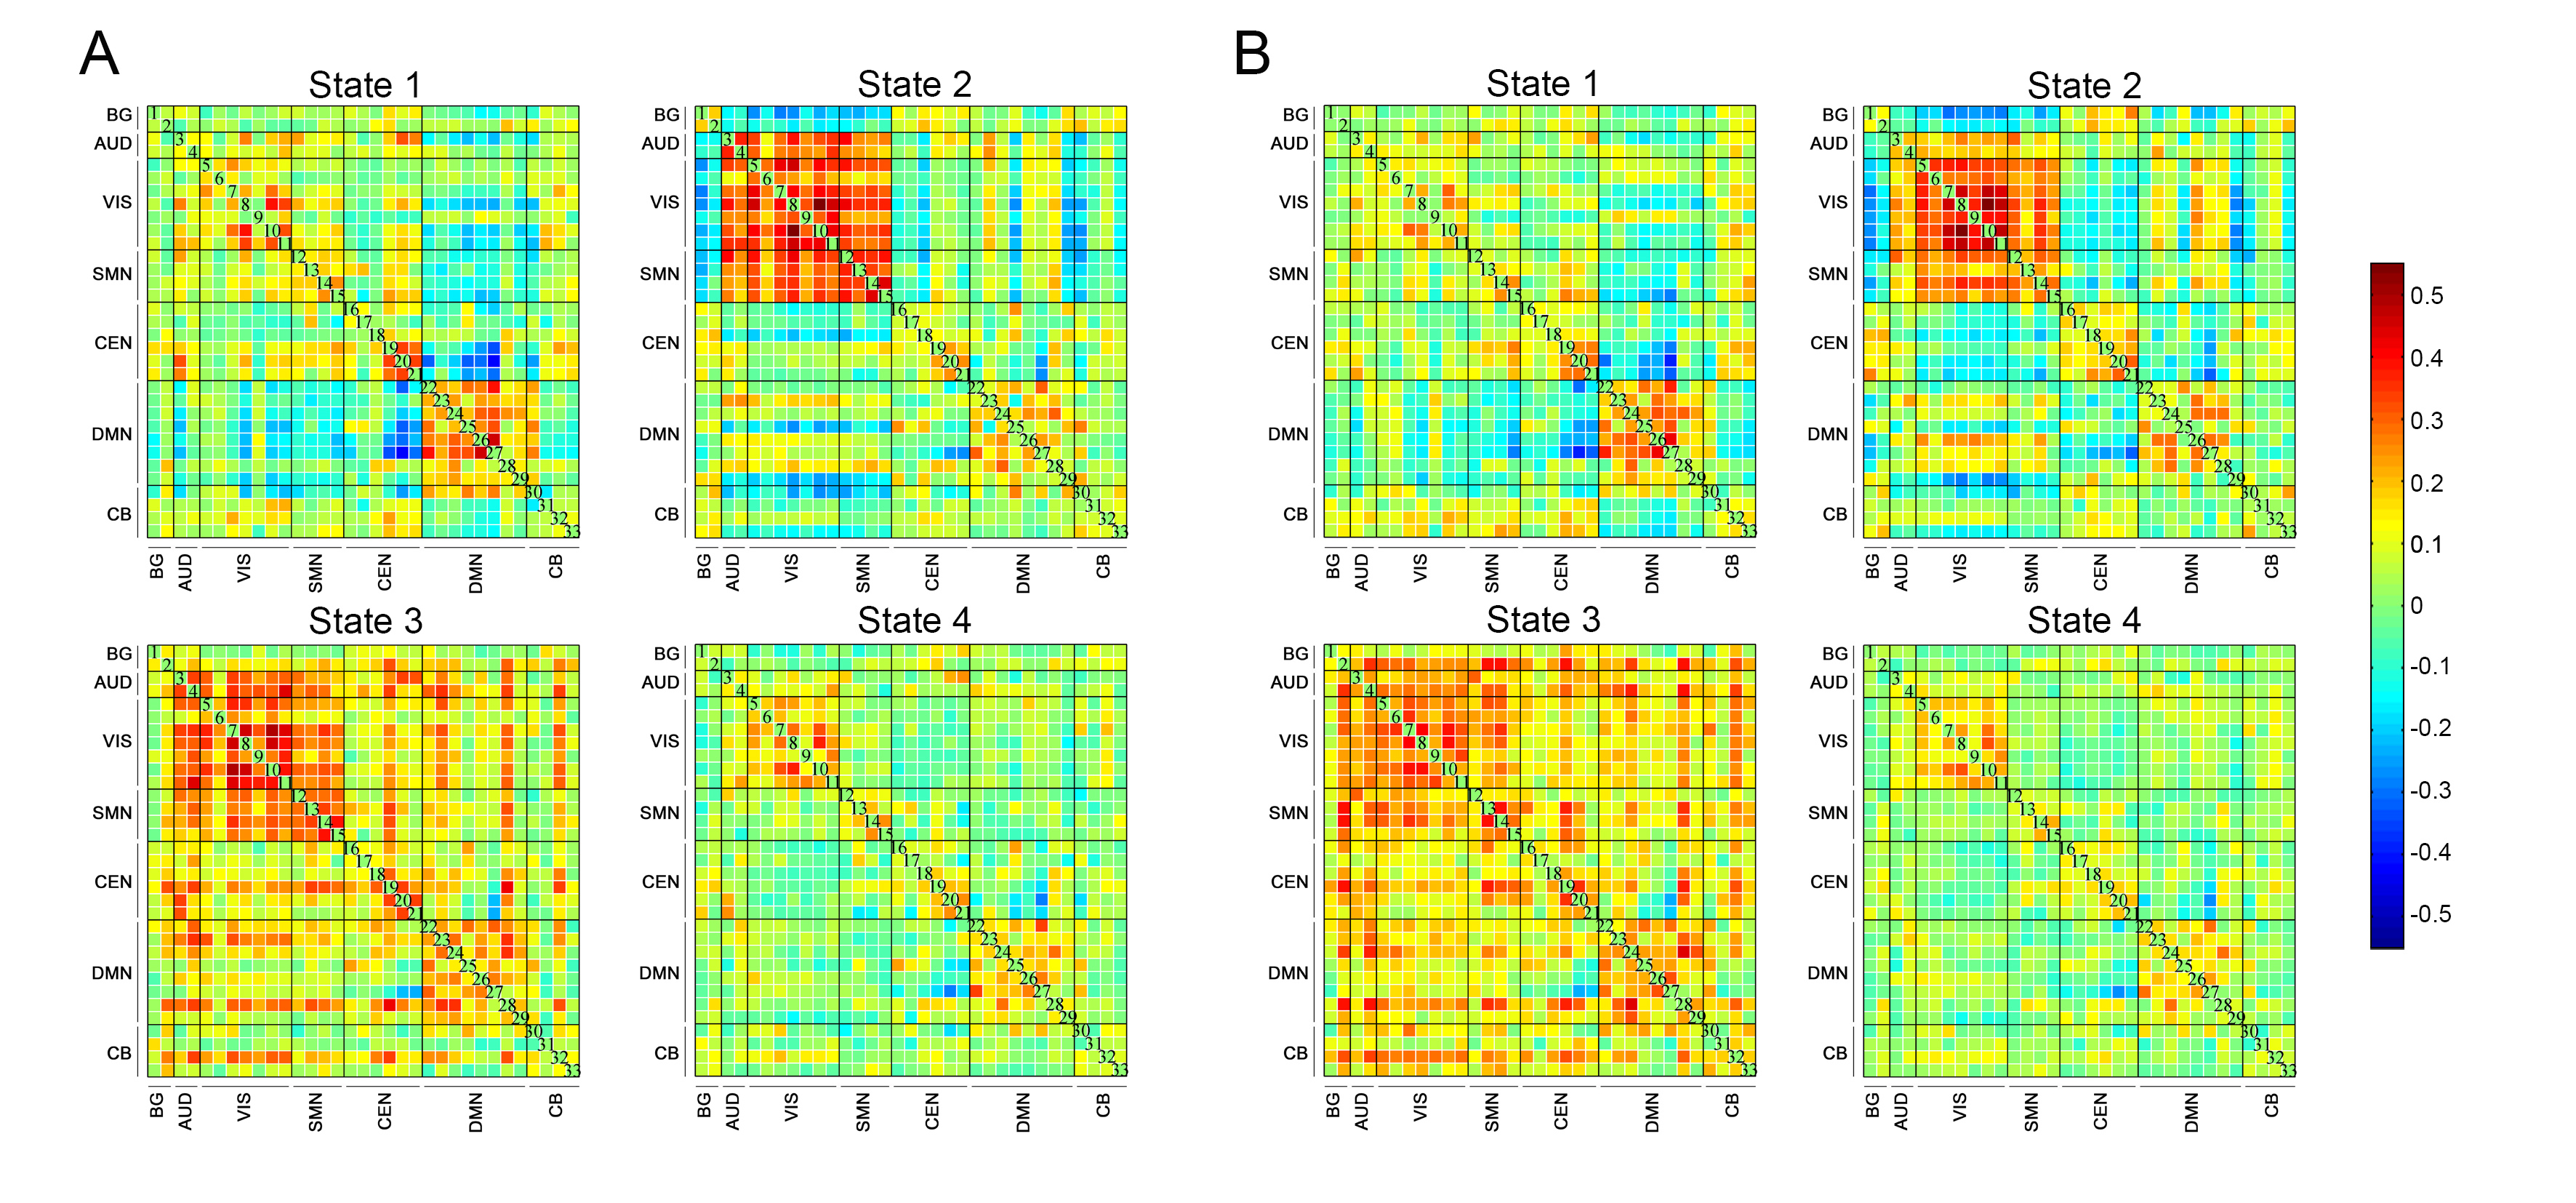
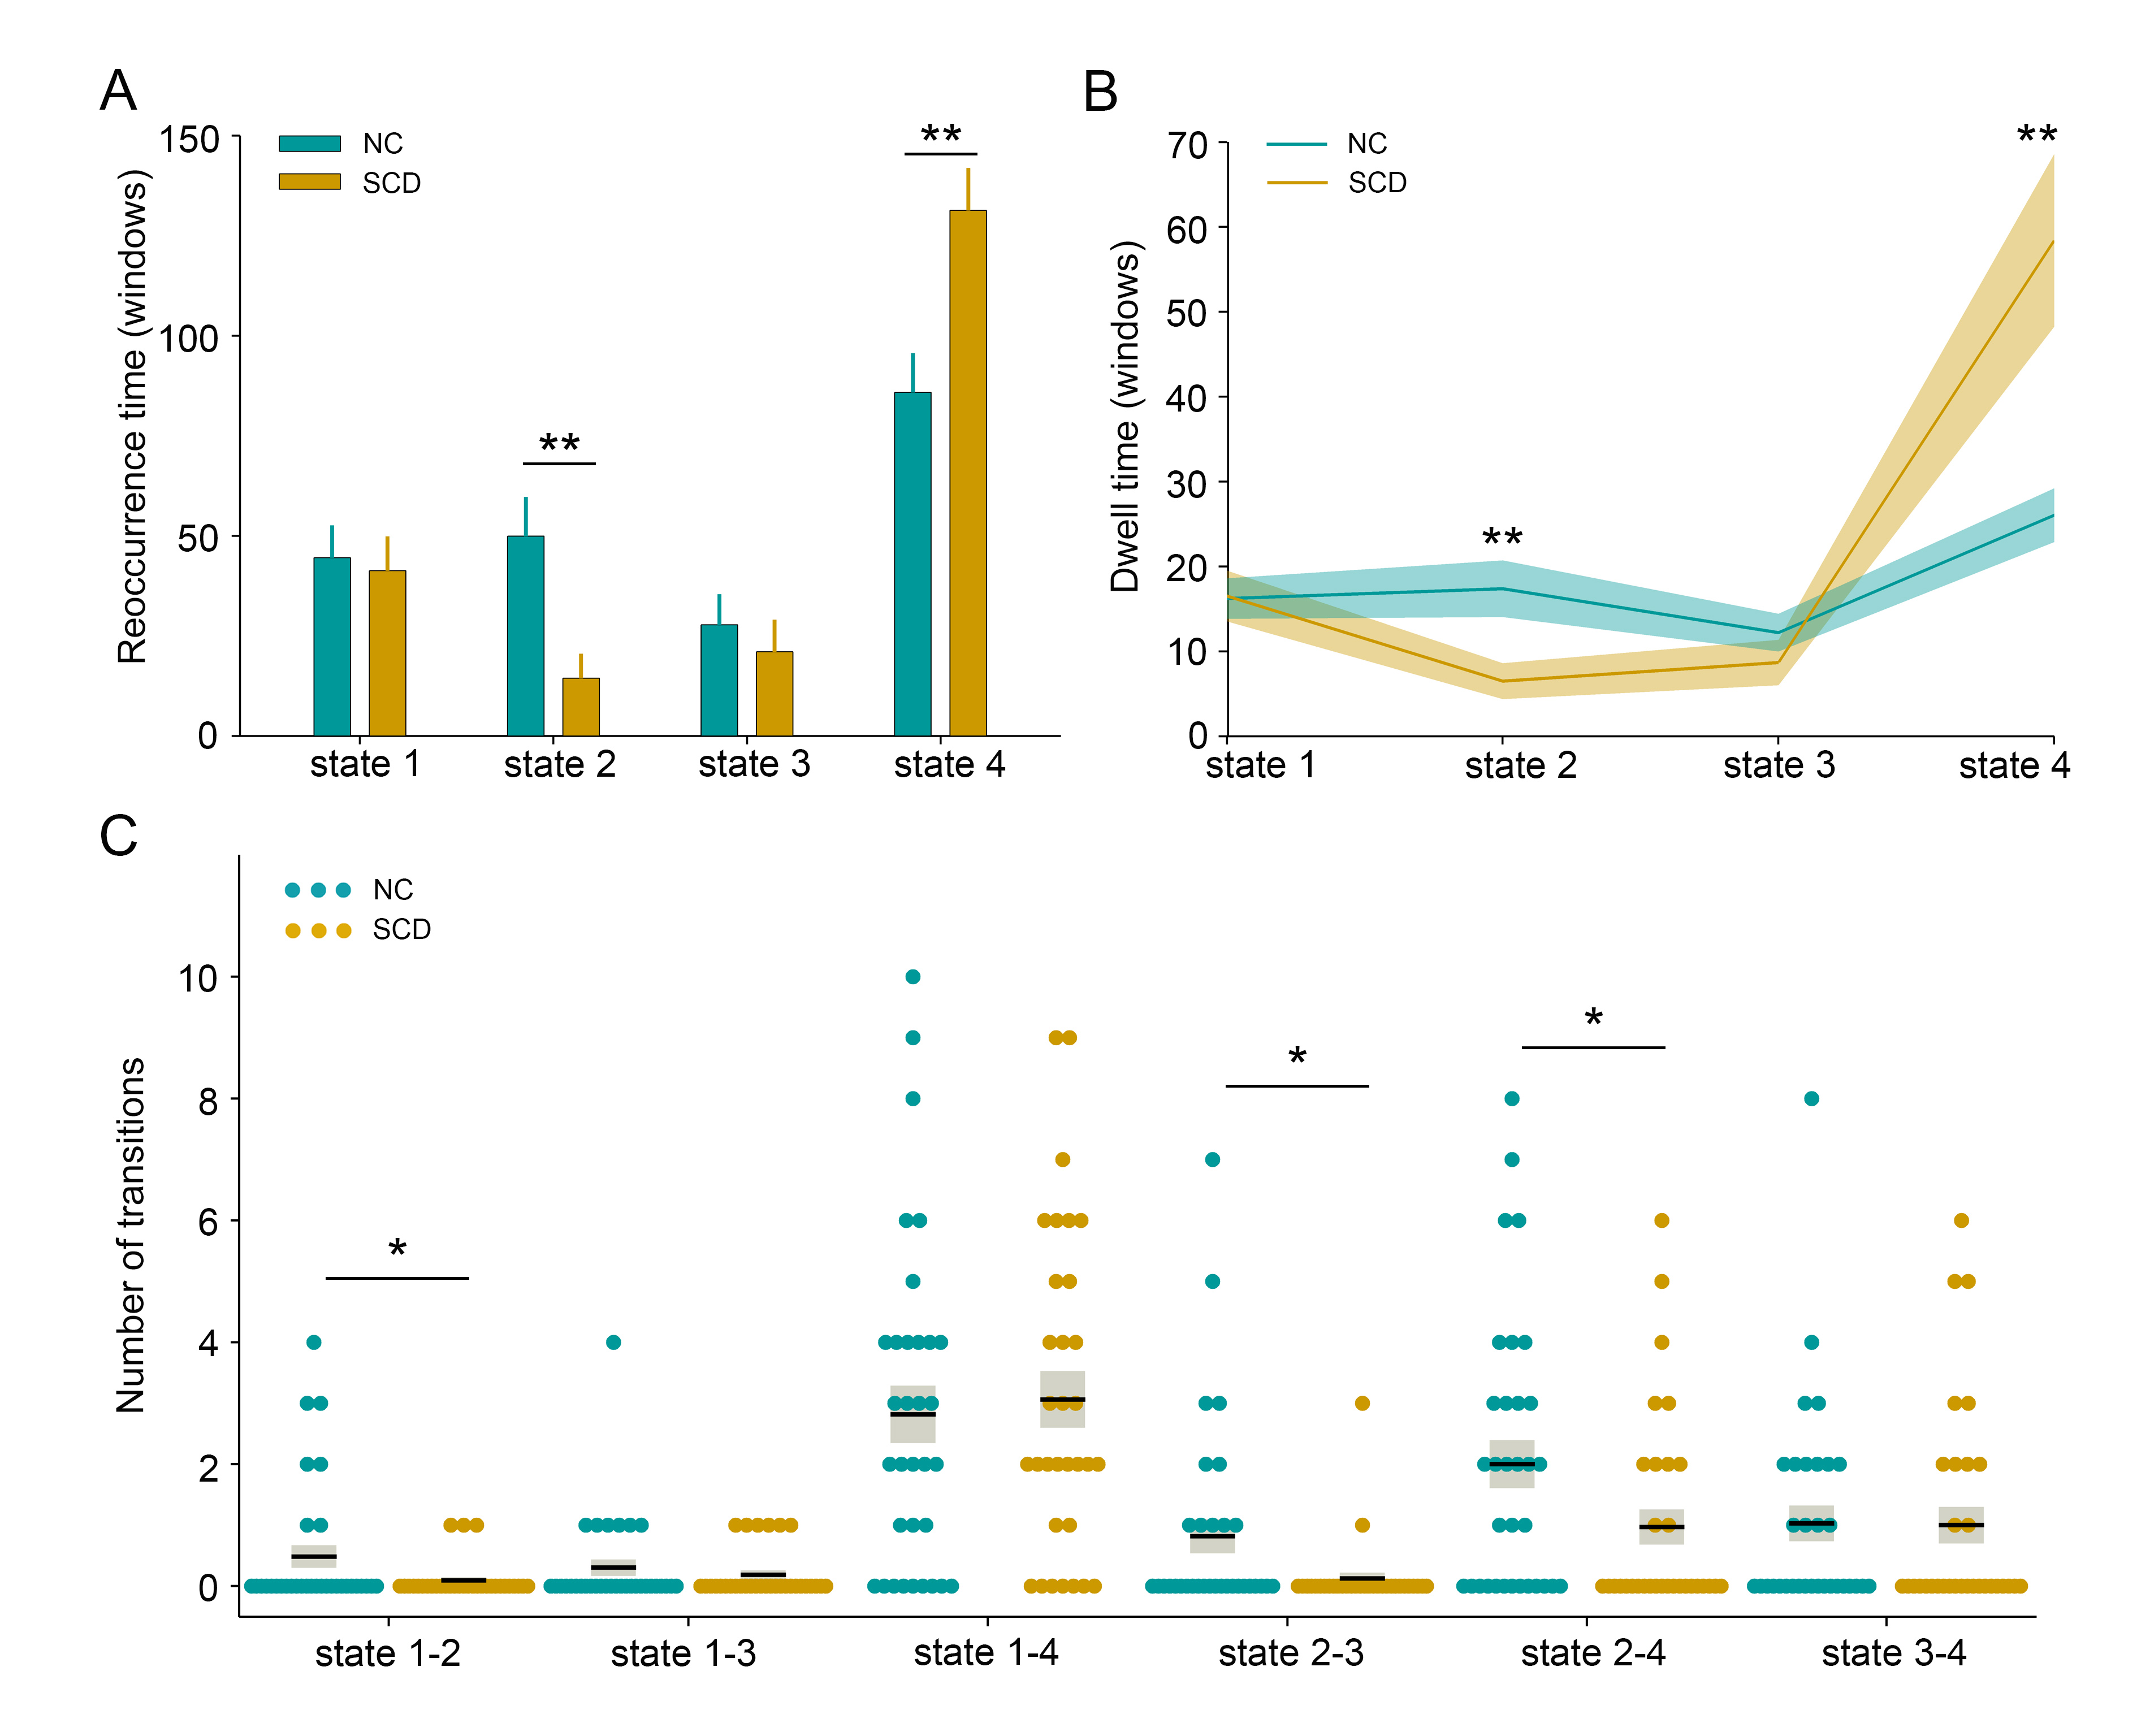
The whole cohort demonstrated four distinct connectivity states. Compared to the control group, the SCD group showed increased fractional windows and mean dwell time in state 4, the most hypo-connected state with weak connectivity located mostly within each network and between each pair of networks. The SCD group also showed decreased fractional windows and mean dwell time in state 2, characterized by the predominance of strong positive intra-network and inter-network connectivity in the auditory, visual, and sensorimotor networks. The number of transitions between state 1 and state 2, state 2 and state 3, and between state 2 and state 4 was significantly reduced in the SCD group. No significant differences in global or local topological metrics were observed. The altered DFC properties showed significant correlations with cognitive performance on global cognition measured by Mini-mental state examination, executive function measured by trail making test, episodic memory measured by auditory verbal learning test, and language function measured by Boston naming test.Discussion
The SCD group spent more time in state 4 showing a sparsely connected configuration with the absence of strong connections, which was similar to that observed in AD dementia patients in a previous study3. This indicated the inability to switch out of state with weak intra-network and inter-network connectivity into states with more highly and specifically connected patterns in the SCD group, which may contribute to the early cognitive decline. Contrastingly, the less time spent in state 2 may suggest reduced auditory-visual-sensorimotor network integration and loss of cooperation in sensory regions in the SCD stage. The state transitions were believed to reflect neural metastability, which enables multiple brain regions to engage and disengage flexibly in coordination without being locked into fixed interaction patterns9. The SCD group demonstrated significantly reduced transitions between state 1 and state 2, state 2 and state 3, and between state 2 and state 4, which suggested the disruption of flexible information integration and intensive information exchange across multiple specialized subnetworks. The significant associations between DFC measures and cognitive variables provided evidence that altered dynamic functional brain organization was linked to cognitive function, which may further serve as the neural substrates underlying cognitive decline in the SCD stage. The absence of significant differences in topological properties between groups indicated that DFC may be a more informative representation of functional brain networks compared to static FC for the preclinical detection of incipient AD patients10. These results elucidated the vulnerability of rs-fMRI networks in the SCD stage and emphasized the importance of investigating the dynamic characteristics of the brain.Conclusion
Our findings indicated the DFC network deterioration in the SCD stage, which may underlie the early cognitive decline in SCD subjects, and also serve as sensitive neuroimaging biomarkers for the preclinical detection of individuals with incipient AD.Acknowledgements
This
work was supported by the National Natural Science Foundation of China
(81720108022 B.Z., 81971596, X.Z., 82071904, Z.Q.); the Fundamental
Research Funds for the Central Universities, Nanjing University (2020-021414380462);
the key project of Jiangsu Commission of Health (K2019025); Key medical talents
of the Jiangsu province, the "13th Five-Year" health promotion
project of the Jiangsu province (ZDRCA2016064); Jiangsu Provincial Key Medical
Discipline (Laboratory) (ZDXKA2016020); the project of the sixth peak of
talented people (WSN -138). The funders had no role in the study design, data
collection and analysis, decision to publish, or preparation of the manuscript.
References
- Jessen F, Amariglio RE, Buckley RF, et al. The characterisation of subjective cognitive decline. Lancet Neurol. 2020;19(3):271-278.
- Jessen F, Amariglio RE, van Boxtel M, et al. A conceptual framework for research on subjective cognitive decline in preclinical Alzheimer's disease. Alzheimers Dement. 2014;10(6):844-852.
- Schumacher J, Peraza LR, Firbank M, et al. Dynamic functional connectivity changes in dementia with Lewy bodies and Alzheimer's disease. Neuroimage Clin. 2019;22:101812.
- Peraza LR, Taylor JP, Kaiser M. Divergent brain functional network alterations in dementia with Lewy bodies and Alzheimer's disease. Neurobiol Aging. 2015;36(9):2458-2467.
- Allen EA, Damaraju E, Plis SM, et al. Tracking whole-brain connectivity dynamics in the resting state. Cereb Cortex. 2014;24(3):663-676.
- Calhoun VD, Adali T, Pearlson GD, et al. A method for making group inferences from functional MRI data using independent component analysis. Hum Brain Mapp. 2001;14(3):140-151.
- Fiorenzato E, Strafella AP, Kim J, et al. Dynamic functional connectivity changes associated with dementia in Parkinson's disease. Brain. 2019;142(9):2860-2872.
- Wang J, Wang X, Xia M, et al. GRETNA: a graph theoretical network analysis toolbox for imaging connectomics. Front Hum Neurosci. 2015;9:386.
- Li J, Zhang D, Liang A, et al. High transition frequencies of dynamic functional connectivity states in the creative brain. Sci Rep. 2017;7:46072.
- de Vos F, Koini M, Schouten TM, et al. A comprehensive analysis of resting state fMRI measures to classify individual patients with Alzheimer's disease. Neuroimage. 2018;167:62-72.
Figures