0260
Dermal sodium space in controls and Type 2 Diabetes Mellitus patients characterised at histological length scales using 1H/23Na MRS and MRI at 9.4T1SPMIC/Medicine, Univeristy of Nottingham, Nottingham, United Kingdom, 24Nottingham NIHR Biomedical Research Centre, Nottingham, United Kingdom, 3Warwick Medical School, University of Warwick, Warwick, United Kingdom, 42Warwickshire Institute for the Study of Diabetes Endocrinology and Metabolism, University Hospitals Coventry and Warwickshire, Coventry, United Kingdom, 5Warwick Medical School, University of Warwick, Coventry, United Kingdom
Synopsis
We reveal intriguing experimental results providing the evidence for dermal space storage for sodium, and how dynamics of the space changes in patients with Type2 Diabetes Mellitus.
Synopsis
We reveal intriguing experimental results providing the evidence for dermal space storage for sodium, and how dynamics of the space changes in patients with Type2 Diabetes Mellitus.Introduction
Recent data reveal a mismatch between dietary sodium intake and urinary sodium excretion over prolonged periods, and sodium retention without attendant (osmotically induced) weight-gain [1]. Skin, as the largest organ in the body, has been proposed to serve as a reservoir for sodium by many researchers [2,3,4] however it was not clear what cutaneous anatomical compartment would serve as a repository space for sodium. Our aim was to identify this compartment within the skin and to quantify sodium stored within that compartment using multi-scale MRI at histological length scales, and to explore how Type 2 Diabetes Mellitus (T2D) influences dermal sodium levels.Methods
. Adult participants included patients with T2D (n=9) and euglycemic patients with no history of Diabetes Mellitus (n=8). All had undergone either lower limb amputations or abdominal skin reduction surgery (performed for clinical purposes), with skin biopsies taken intra-operatively. NMR and MRI of all spin species reported in this study were performed on a 9.4 T Bruker Avance III Microimaging system (Bruker, Germany) using 25mm dual tuned 1H/23Na microimaging coil (Bruker, Germany). 1H multi-slice T1/T2* weighted gradient echo MRI protocol (Paravision 6.01) was used to visualise anatomical skin regions in intra-operative skin biopsies with 20mm in-plane resolution. 23Na MRI was performed using non-slice selective gradient echo home-written protocol for TopSpin 3.2 environment and spectroscopically determined triple quantum filter (TQF) was integrated into the code to visualise stored sodium in the same skin biopsies. Home-written 2D triple quantum-filtered with time proportional phase incrementation (TQ-TPPI) [5,6] spectroscopy was used to determine sodium storage skin capacity in all studied skin biopsies. Sodium levels in selected skin samples were to quantified by Inductively Coupled Plasma Mass Spectrometry.Results
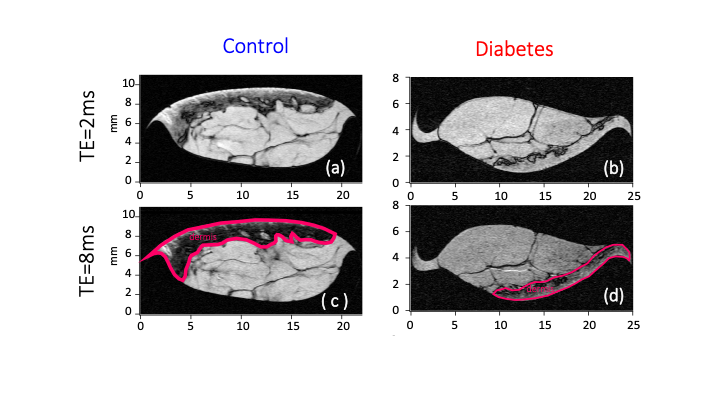
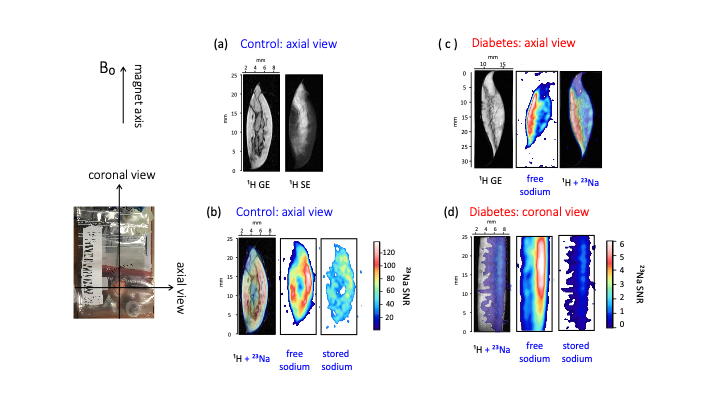
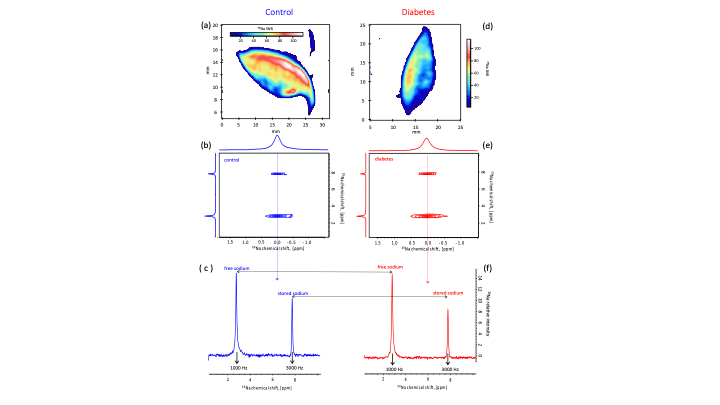
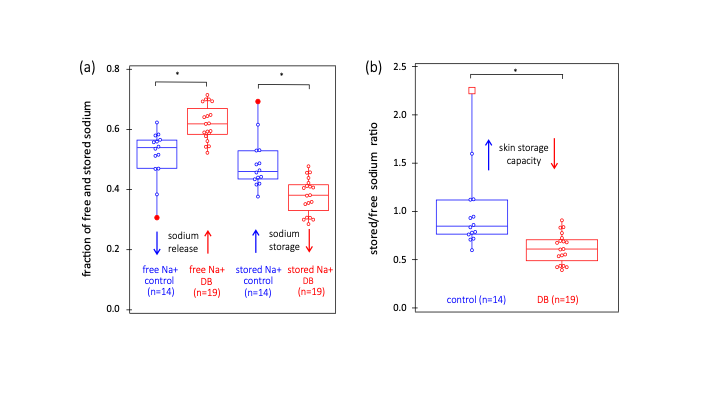
Segmentation of anatomical skin layers by MRI at histological length scales are shown in Figure 1 for both control and DB2 biopsies. The co-localisation of free and stored sodium in skin biopsies visualised by 23Na MRI is shown in Figure 2. 23Na TqTPPI spectra used to determine skin sodium storage capacity are displayed in Figure 3, and corresponding skin storage capacity for controls and T2D patients are displayed in Figure 4.Discussion
We demonstrate that (>90%) of both free and stored sodium are located within the dermis compartment of the skin that consists mostly of the extracellular matrix enriched with glycosaminoglycans (GAGs) and collagen. While imaging is important for localisation of sodium in the skin we also show that bulk sodium 2D spectroscopy is efficient in providing clinically relevant information as in T2D. Spectroscopic outcomes can be translated into dermal sodium skin storage capacity that diminishes in case of TD2. This can be explained by the reduction of GAGs in the dermis during the disease progression.Conclusion
We provide the first evidence for stored sodium within the human dermis, co-locating to the GAG scaffold. We also provide evidence that T2D associates with diminishment of the dermal binding capacity for sodium.Acknowledgements
GEP and TM thank the Medical Research Council for funding (Grant No. MC_PC_15074). We would like to thank Sean James from the Arden Tissue Bank at UHCW for his help and support in the coordination and collection of the skin biopsy samples.References
1. Birukov A, Rakova N, Lerchl K, et al. Ultra-long-term human salt balance studies reveal interrelations between sodium, potassium, and chloride intake and excretion. Am J Clin Nutr 2016;104(1):49-57 doi: 10.3945/ajcn.116.132951
2. Kopp C, Linz P, Wachsmuth L, et al. Na-23 Magnetic Resonance Imaging of Tissue Sodium. Hypertension 2012;59(1):167-72 doi: 10.1161/hypertensionaha.111.183517
3. Kannenkeril D, Karg MV, Bosch A, et al. Tissue sodium content in patients with type 2 diabetes mellitus. J. Diabetes Complications 2019;33(7):485-89 doi: 10.1016/j.jdiacomp.2019.04.006
4. Titze J, Maillet A, Lang R, et al. Long-term sodium balance in humans in a terrestrial space station simulation study. Am J Kidney Dis 2002;40(3):508-16 doi: 10.1053/ajkd.2002.34908
5. Jaccard G, Wimperis S, Bodenhausen G. MULTIPLE-QUANTUM NMR-SPECTROSCOPY OF S=3/2 SPINS IN ISOTROPIC-PHASE - A NEW PROBE FOR MULTIEXPONENTIAL RELAXATION. Journal of Chemical Physics 1986;85(11):6282-93 doi: 10.1063
6. Schepkin VD. Sodium MRI of glioma in animal models at ultrahigh magnetic fields. Nmr Biomed 2015 doi: 10.1002
Figures