0259
Evaluation of muscle oxygen extraction fraction in response to 15 weeks of exercise training: Comparison of people with and without type 2 diabetes
Erin K Englund1, Deirdre Rafferty2, Jie Zheng3, Hongyu An3, Judith G Regensteiner2,4, Alex J Barker1,5, and Jane EB Reusch2,4
1Department of Radiology, University of Colorado Anschutz Medical Campus, Aurora, CO, United States, 2Department of Medicine, University of Colorado Anschutz Medical Campus, Aurora, CO, United States, 3Department of Radiology, Washington University in St. Louis, St. Louis, MO, United States, 4Center for Women’s Health Research, University of Colorado Anschutz Medical Campus, Aurora, CO, United States, 5Department of Bioengineering, University of Colorado Anschutz Medical Campus, Aurora, CO, United States
1Department of Radiology, University of Colorado Anschutz Medical Campus, Aurora, CO, United States, 2Department of Medicine, University of Colorado Anschutz Medical Campus, Aurora, CO, United States, 3Department of Radiology, Washington University in St. Louis, St. Louis, MO, United States, 4Center for Women’s Health Research, University of Colorado Anschutz Medical Campus, Aurora, CO, United States, 5Department of Bioengineering, University of Colorado Anschutz Medical Campus, Aurora, CO, United States
Synopsis
Oxygen extraction fraction (OEF) provides insight into muscle oxygen consumption. As part of a larger exercise training study, 16 sedentary participants (12 controls, 4 with diabetes) underwent an MRI scan to determine OEF before and after 15 weeks of supervised exercise training. Pilot MRI data were acquired at rest with an asymmetric spin echo sequence and used to calculate OEF in the medial gastrocnemius muscle. Cardiovascular exercise capacity, measured as VO2Peak, was reduced in people with diabetes. MRI-measured OEF did not differ between groups, however a decrease in OEF was observed in all participants in response to exercise training.
Introduction
Microvascular complications of type 2 diabetes mellitus (T2D) contribute to retinopathy, neuropathy, and nephropathy1, leading to a decrease in health-span and increased healthcare cost2. In addition to these well-known microvascular complications, prior work has revealed that skeletal muscle and cardiac microvascular dysfunction contribute to reduced cardiovascular exercise capacity and incipient heart failure3-5, two causes of premature mortality in T2D. Exercise training has been shown to improve exercise capacity in T2D, however the mechanisms underlying the reduced cardiovascular exercise capacity and the mediators of its response to exercise training are not fully understood. Notable hypotheses include perfusion and oxygen extraction heterogeneity, or altered muscle mitochondrial function. A variety of MRI methods can be used to measure the oxygenation and blood flow responses in muscle6-9; however, few have evaluated the response to a long-term exercise intervention. Thus, the purpose of this work was to measure muscle oxygen extraction fraction (OEF) at rest before and after 15 weeks of supervised exercise training in sedentary individuals with and without T2D. We hypothesize that reduced local blood flow leads to increased local OEF in people with T2D and that exercise training improves cardiovascular exercise capacity and OEF.Methods
A total of sixteen sedentary people were recruited from a larger, ongoing exercise training study, four with a diagnosis of T2D, and twelve body mass index (BMI)-similar controls (Table 1). All study procedures were approved by the local IRB, and subjects provided written, informed consent. Prior to exercise training, screening, laboratory, and maximal exercise capacity tests were conducted, followed by an MRI scan of the calf. Subsequently, all participants completed 15 weeks of supervised exercise training. Subjects then returned for a follow-up MRI and physiologic testing sessions, identical to the baseline visits (Figure 1).Maximal exercise capacity was determined using a standardized incremental bicycle exercise test to obtain VO2Peak. The supervised exercise training was performed three times per week for 15 weeks. Each visit consisted of a 5-min warm-up, 50 min of moderate intensity exercise, and a 5-min cooldown period. Subjects exercised on treadmills, rowing machines, and bicycle ergometers, with targeted heart rates of 70-85% of maximum.
MR data were collected at 3T with a flexible surface coil wrapped around the subject’s right leg while they rested in the supine position. A 2D, multi-slice, triple-echo, asymmetric spin echo sequence, described previously6, was used to acquire data for OEF calculation with FOV=220×220 mm2, slice thickness = 8 mm, 21 slices, acquisition matrix = 64×64, TR/TE1/TE2/TE3 = 4000/44/79.6/114.8 ms. Post-processing yielded the reversible component of the transverse relaxation rate (R2’), and venous blood volume (λ), from which OEF was computed assuming signal decay in the static dephasing regime10. OEF values were thresholded between 0.011 and 1.0. Regions of interest (ROIs) were defined on the medial gastrocnemius muscle across all slices, and the average OEF was determined. Two-way repeated measures ANOVA tests were used to compare OEF and VO2Peak between groups and across longitudinal time points.
Results
Prior to exercise intervention, mean (standard deviation) resting OEF in the medial gastrocnemius muscle was 0.52 (0.05) and 0.52 (0.02) in control and T2D groups, respectively. VO2Peak was lower in T2D compared to controls (p=0.043) and there was a trend toward a significant increase in VO2Peak in response to exercise training (p=0.052). The supervised exercise training also elicited a decrease in OEF to 0.49 (0.06), and 0.48 (0.06) in control and T2D groups, respectively (main effect time, p=0.015). OEF did not differ between groups. OEF and VO2Peak results are summarized in Figure 2, and representative OEF maps are shown in Figure 3.Discussion & Conclusion
This preliminary analysis of an ongoing study showed that participants enrolled in a supervised exercise intervention had a significant decrease in resting OEF in the medial gastrocnemius muscle in response to exercise training. Contrary to our hypothesis, there was no difference in OEF between T2D and controls, however these results should be interpreted cautiously due to the limited sample size (particularly given the difference in distribution of sexes between groups). Compared to prior work investigating OEF in lean, healthy participants (OEF = 0.38)6, OEF in this cohort was greater, potentially due to a reduction in local blood flow in both the T2D and BMI-similar sedentary participants. Another study found that resting OEF was somewhat increased in people with T2D compared to healthy volunteers11, however the difference was not statistically significant.Exercise training elicited a reduction in OEF, which may be indicative of exercise-induced increases in blood flow or local metabolic function. Additional measures of perfusion in muscle would help to elucidate the mechanistic determinants of exercise training, however it remains difficult to quantify the low perfusion state of skeletal muscle at rest (on the order of 3-5 mL/min/100g) by methods like arterial spin labeling. Data collection is ongoing and future studies evaluating blood flow and oxygenation responses to periods of in-scanner, isometric exercise in this cohort are planned.
Acknowledgements
VA Clinical Merit Review CX001532References
- Fowler MJ. Microvascular and Macrovascular Complications of Diabetes. Clinical Diabetes. 2008;26:77–82.
- Saeedi P, Petersohn I, Salpea P, Malanda B, Karuranga S, Unwin N, Colagiuri S, Guariguata L, Motala AA, Ogurtsova K, Shaw JE, Bright D, Williams R, Committee OBOTIDA. Global and regional diabetes prevalence estimates for 2019 and projections for 2030 and 2045: Results from the International Diabetes Federation Diabetes Atlas, 9th edition. Diabetes Research and Clinical Practice. 2019;157:107843.
- Brandenburg SL, Reusch JE, Bauer TA, Jeffers BW, Hiatt WR, Regensteiner JG. Effects of exercise training on oxygen uptake kinetic responses in women with type 2 diabetes. Diabetes Care. 1999;22:1640–1646.
- Bauer TA, Reusch JEB, Levi M, Regensteiner JG. Skeletal Muscle Deoxygenation After the Onset of Moderate Exercise Suggests Slowed Microvascular Blood Flow Kinetics in Type 2 Diabetes. Diabetes Care. 2007;30:2880–2885.
- Reusch JEB, Bridenstine M, Regensteiner JG. Type 2 diabetes mellitus and exercise impairment. Rev Endocr Metab Disord. 2013;14:77–86.
- Zheng J, An H, Coggan AR, Zhang X, Bashir A, Muccigrosso D, Peterson LR, Gropler RJ. Noncontrast skeletal muscle oximetry. Magn Reson Med. 2013;71:318–325.
- Englund EK, Langham MC, Li C, Rodgers ZB, Floyd TF, Mohler ER, Wehrli FW. Combined measurement of perfusion, venous oxygen saturation, and skeletal muscle T 2 * during reactive hyperemia in the leg. Journal of Cardiovascular Magnetic Resonance. 2013;15:70.
- Raynaud JS, Duteil S, Vaughan JT, Hennel F, Wary C, Leroy-Willig A, Carlier PG. Determination of skeletal muscle perfusion using arterial spin labeling NMRI: Validation by comparison with venous occlusion plethysmography. Magn Reson Med. 2001;46:1–7.
- Mathewson KW, Haykowsky MJ, Thompson RB. Feasibility and reproducibility of measurement of whole muscle blood flow, oxygen extraction, and VO 2with dynamic exercise using MRI. Magn Reson Med. 2014;74:1640–1651.
- Yablonskiy DA, Haacke EM. Theory of Nmr Signal Behavior in Magnetically Inhomogeneous Tissues - the Static Dephasing Regime. Magn Reson Med. 1994;32:749–763.
- Zheng J, Hasting MK, Zhang X, Coggan A, An H, Snozek D, Curci J, Mueller MJ. A pilot study of regional perfusion and oxygenation in calf muscles of individuals with diabetes with a noninvasive measure. Journal of Vascular Surgery. 2014;59:419–426.
Figures
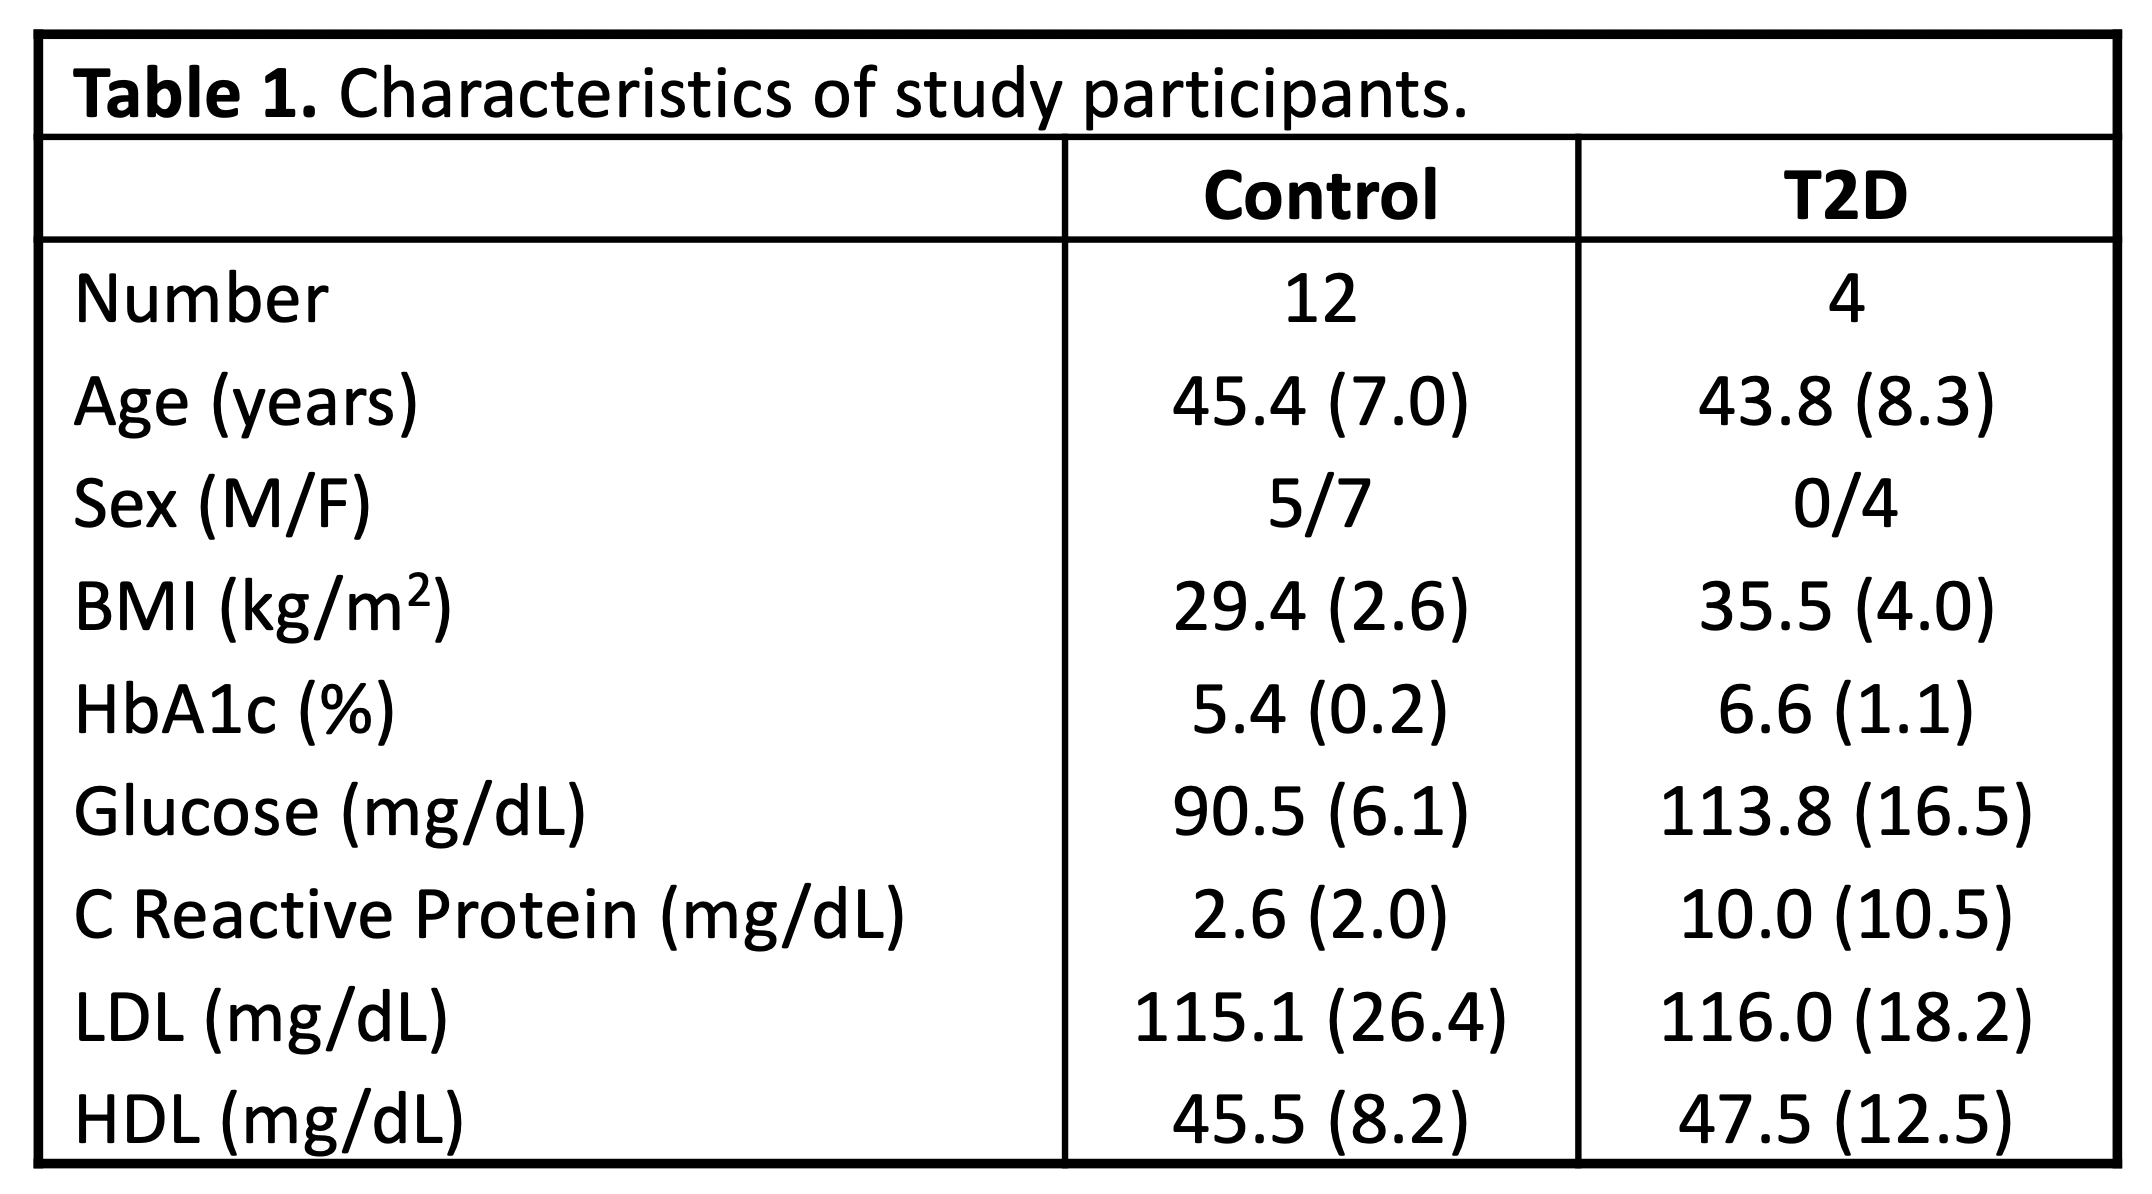
Table
1. Characteristics
of study participants. Data shown as mean (standard deviation) or number.
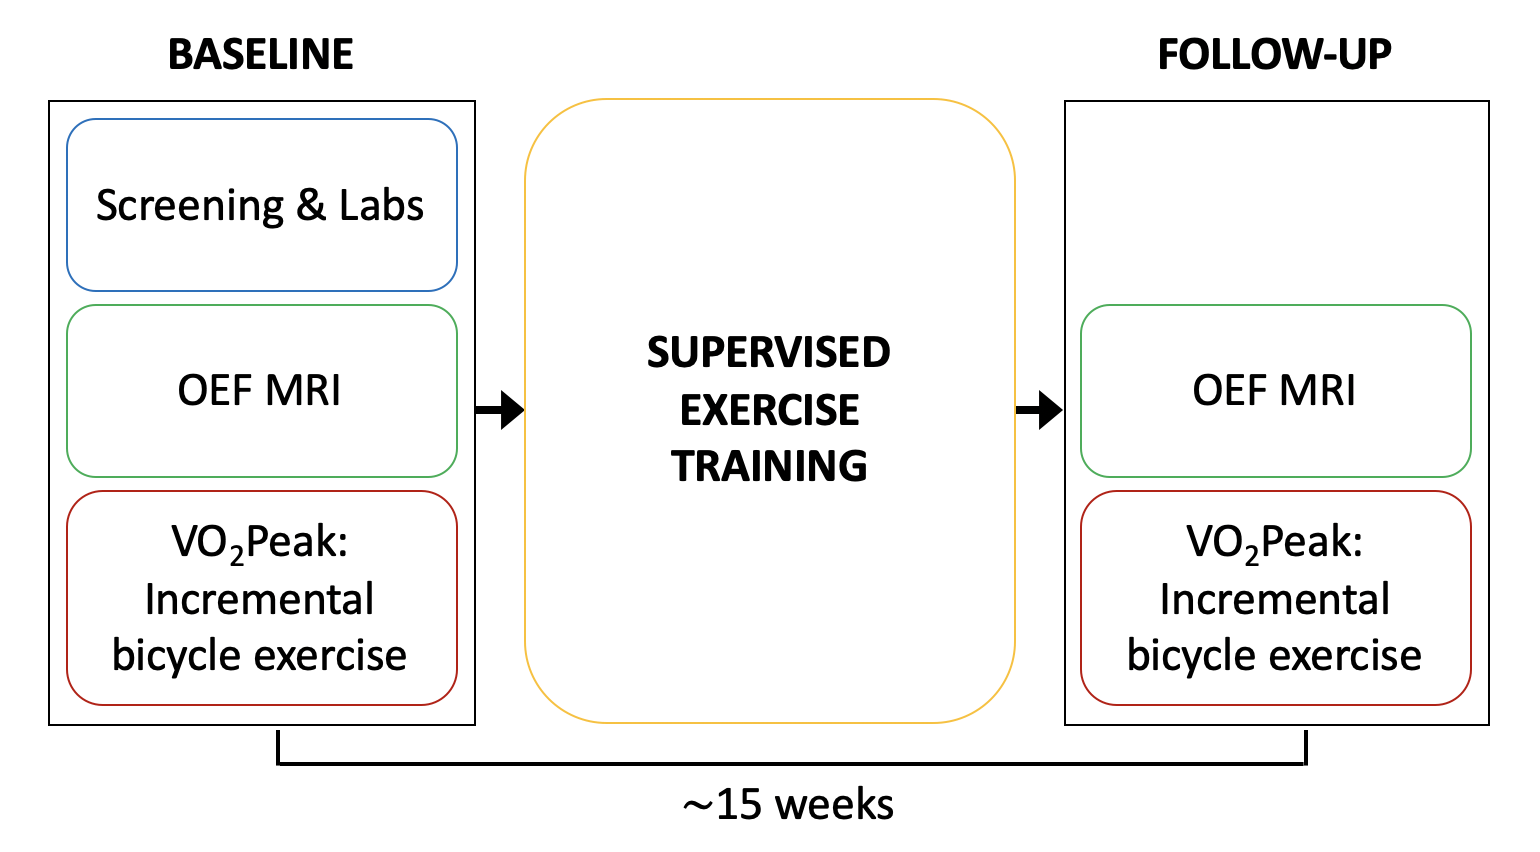
Figure
1. Overview
of study design. Maximal exercise capacity (VO2Peak)
and resting skeletal muscle oxygen extraction fraction (OEF) were determined
before and after 15 weeks of supervised exercise training.
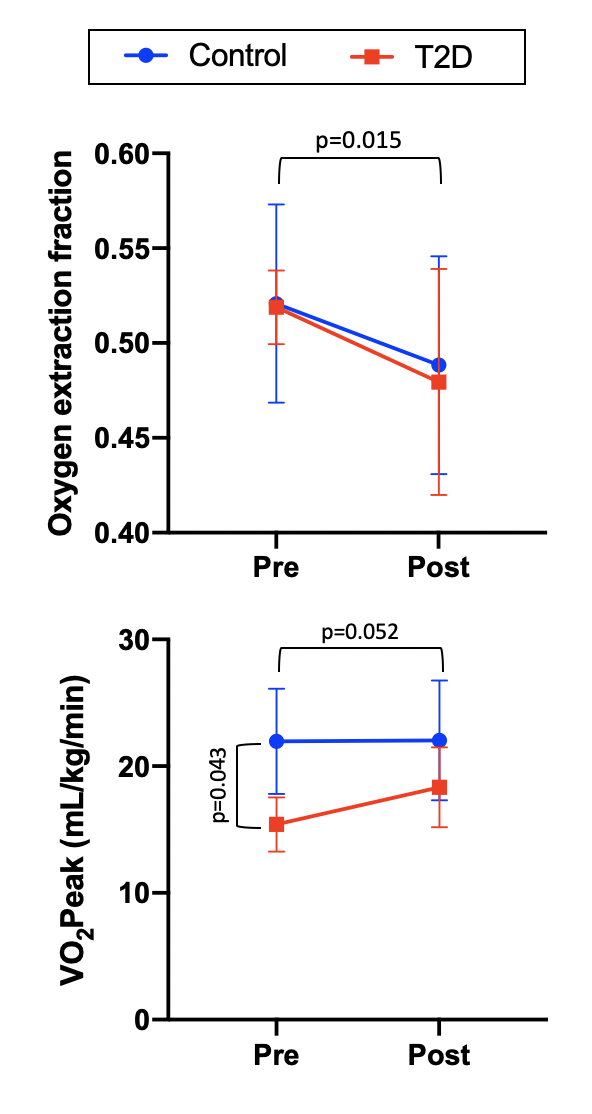
Figure
2. Mean
oxygen extraction fraction and maximal exercise capacity (VO2Peak)
before and after supervised exercise training. Error bars indicate standard
deviation.
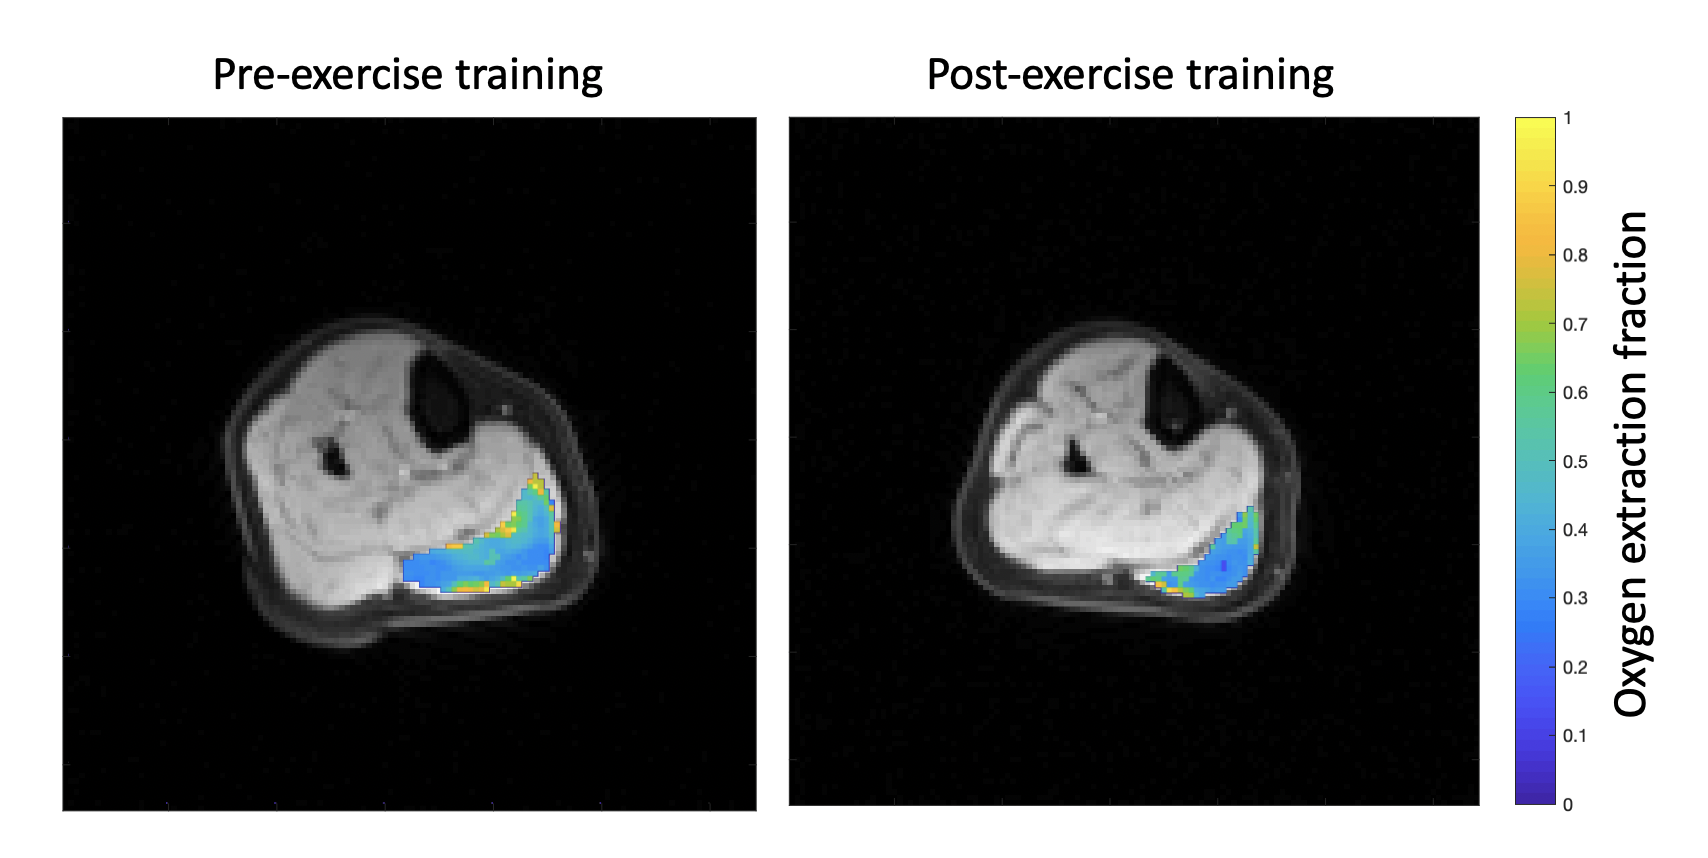
Figure
3. OEF
in the medial gastrocnemius muscle at the centrally acquired slice overlaid on
an anatomical reference image in a representative subject before and after
exercise training.