0258
Deep Learning Based Segmentation and Fat Fraction Assessment of the Calf in Diabetic Subjects and Non-Diabetic Controls1New York University Grossman School of Medicine, New York, NY, United States, 2Center for Biomedical Imaging, Department of Radiology, New York University Grossman School of Medicine, New York, NY, United States, 3Center for Advanced Imaging Innovation and Research (CAI2R), Department of Radiology, New York University Grossman School of Medicine, New York, NY, United States, 4Center for Data Science, New York University, New York, NY, United States
Synopsis
Diabetes mellitus, muscular dystrophies, and other pathologies are characterized by metabolic impairment that can lead to lower extremity muscle degeneration. While MRI provides access to quantitative biomarkers to characterize muscle quality, analysis requires time-consuming manual image segmentation. To address this problem, we developed an automated segmentation algorithm based on a convolutional neural network that provided high dice similarity coefficient scores (>0.92) in the gastrocnemius medial, gastrocnemius lateral, and soleus muscles. We utilized the automatic segmentations to show volumetric fat fraction was elevated in individuals with diabetic peripheral neuropathy compared to controls in the soleus and gastrocnemius medial muscles (P<0.05).
Introduction
Quantitative MRI, such as Dixon-based fat quantification, diffusion, relaxometry, and measures of tissue volume are effective for evaluating muscle pathology (1-7), and diseases such as diabetic peripheral neuropathy cause preferential degeneration in the lower extremities. Given the anatomical variability of muscle and interstitial tissue in the calf, evaluation of quantitative MRI can require painstaking, subject-specific manual segmentation. While others have developed programs to distinguish lower extremity subcutaneous adipose tissue and intermuscular adipose tissue (8) and delineate the subtle fascia lata boundary (9,10), to our knowledge none report an automatic calf segmentation program. Therefore, we set out to build an accurate and fast segmentation algorithm to streamline large-scale volumetric analysis of the gastrocnemius and soleus muscles, fibula, and tibia. To do so, we trained a convolutional neural network (CNN) with manually segmented images acquired from controls and those with type 2 diabetes mellitus (T2DM) without and with diabetic peripheral neuropathy (DPN). To evaluate the algorithm, we compare automatic and manual segmentations, and utilize it to determine fat fraction in posterior calf muscles.Methods
The study was approved by NYU Langone Health’s Institutional Review Board, and 56 subjects provided informed written consent prior to enrollment. All MRI experiments were performed on a 3 Tesla scanner (Prisma, Siemens Medical Solutions, Erlangen, Germany) with an in-house developed lower extremity coil (11). The scans were centered at the widest mid-calf dimension of the right leg. We acquired fat-suppressed PSIF images for segmentation (TR/TE/FA = 10.8ms/3.3ms/30° and resolution = 0.9x0.9x1.8mm3 or 0.9mm isotropic). Adipose fraction was measured with a chemical shift-based technique (12,13) for which GRE datasets with different echo times (TR/TE/ΔTE/FA = 12ms/2.2ms/0.8ms/3° and resolution = 1.7x1.7x5mm3) were processed in MATLAB using an algorithm by Tsao and Jiang that is available in the ISMRM fat/water toolbox (14,15).To train the network and evaluate its effectiveness, we manually segmented the medial gastrocnemius, lateral gastrocnemius, soleus, tibia, and fibula using ITK-SNAP software; training data included approximately 60 slices in each of 19 subjects (Table 1A), which required at least one hour of effort per subject. Images were filtered and intensity normalized to reduce the influence of noisy pixels and inhomogeneity related to the MRI coil, acquisition, and image reconstruction methods with an N4 bias field correction algorithm (16). The images were fed into a 2D CNN with a U-net architecture (17) that is popular for medical imaging segmentation (9,18). Using three-fold cross validation, each model was trained with a multi-class version of dice loss for 500 epochs with early stopping at 100 epochs. Within each fold, the model with the highest dice loss in the validation set was saved. Additional parameters are listed in Table 2. The output of the neural network was evaluated against the ground truth manual segmentations by calculating the dice similarity coefficient (DSC) (19). The three models were ensembled to generate a single automated segmentation tool. This tool was applied to generate segmentations in PSIF images used to evaluate co-registered fat fraction maps in a separate cohort with 37 subjects (Table 1B). Each region of interest (ROI) was subsequently eroded by 2.7mm (3 voxels) to minimize contamination from neighboring interstitial tissue or subcutaneous adipose.
Results
MR images with overlaid manual and automated segmentation results of representative slices from the validation set demonstrate satisfying visual agreement (Figure 1). The mean DSCs were greater than 0.92 for the muscle ROIs over an 8.1cm longitudinal range (Table 3). Note that the fibula has the smallest ROI, which makes the DSC (0.84) more sensitive to inaccuracies in segmentation.Inset in Figure 1 are plots showing significant fat fraction variation with slice location in a given subject, which highlights the need for volumetric analysis. Table 1B summarizes the fat fraction analysis for each muscle within each cohort. Significant differences were observed between normal subjects and DPN subjects in the gastrocnemius medial (P<0.01) and soleus muscles (P<0.05).
Discussion
In this work, we developed an automated calf segmentation tool by training a CNN on anatomical MR images with manually-drawn contours. The high DSCs indicate that the automated algorithm can eliminate the tedious manual segmentation process. The algorithm was used to analyze fat fraction in posterior calf muscles, in which significant longitudinal variation along a given muscle was observed, indicating the need for volumetric analysis that would require over one-hour of manual effort for a single subject. The analysis further showed statistically elevated fat fraction in individuals with DPN compared to controls (P<0.01 in the gastrocnemius medial and P<0.05 in the soleus) and elevated fat fraction trends in T2DM compared to controls (P>0.05), which is in similar to that reported in the literature (20).Conclusion
This tool provides a foundation for future studies on muscle pathologies and their response to therapy. For example, while physical therapy studies have shown that exercise improves muscle strength and balance in DPN (21,22), MRI promises to provide other clinically relevant markers that have only begun to be explored in the context of longitudinal response (23). The algorithm developed in this work could be utilized to automate the analysis of such MRI measurements.Acknowledgements
This work was partially supported by National Institutes of Health grants T35 DK007421-37, R21 CA213169, R01 DK106292, R21 AG061579, R01 DK114428, R21 EB027263, and R01 AR074453 and was performed under the rubric of the Center for Advanced Imaging Innovation and Research (CAI2R, www.cai2r.net) at the New York University Grossman School of Medicine, which is an NIBIB Biomedical Technology Resource Center (P41 EB017183).References
1. Stouge A, Khan KS, Kristensen AG, Tankisi H, Schlaffke L, Froeling M, Vaeggemose M, Andersen H. MRI of Skeletal Muscles in Participants with Type 2 Diabetes with or without Diabetic Polyneuropathy. Radiology 2020;297(3):608-619.
2. Hilton TN, Tuttle LJ, Bohnert KL, Mueller MJ, Sinacore DR. Excessive adipose tissue infiltration in skeletal muscle in individuals with obesity, diabetes mellitus, and peripheral neuropathy: association with performance and function. Physical therapy 2008;88(11):1336-1344.
3. Virta A, Komu M, Lundbom N, Jaaskelainen S, Kalimo H, Airio A, Alanen A, Kormano M. Low field T1rho imaging of myositis. Magn Reson Imaging 1998;16(4):385-391.
4. Lamminen AE, Tanttu JI, Sepponen RE, Pihko H, Korhola OA. T1 rho dispersion imaging of diseased muscle tissue. Br J Radiol 1993;66(789):783-787.
5. Lamminen AE, Tanttu JI, Sepponen RE, Suramo IJ, Pihko H. Magnetic resonance of diseased skeletal muscle: combined T1 measurement and chemical shift imaging. Br J Radiol 1990;63(752):591-596.
6. Huang Y, Majumdar S, Genant HK, Chan WP, Sharma KR, Yu P, Mynhier M, Miller RG. Quantitative MR relaxometry study of muscle composition and function in Duchenne muscular dystrophy. J Magn Reson Imaging 1994;4(1):59-64.
7. Fujino H, Kobayashi T, Goto I, Onitsuka H. Magnetic resonance imaging of the muscles in patients with polymyositis and dermatomyositis. Muscle & nerve 1991;14(8):716-720.
8. Valentinitsch A, Karampinos DC, Alizai H, Subburaj K, Kumar D, Link TM, Majumdar S. Automated unsupervised multi-parametric classification of adipose tissue depots in skeletal muscle. J Magn Reson Imaging 2013;37(4):917-927.
9. Amer R, Nassar J, Bendahan D, Greenspan H, Ben-Eliezer N. Automatic Segmentation of Muscle Tissue and Inter-muscular Fat in Thigh and Calf MRI Images. Lect Notes Comput Sc 2019;11765:219-227.
10. Chaudry O, Friedberger A, Grimm A, Uder M, Nagel AM, Kemmler W, Engelke K. Segmentation of the fascia lata and reproducible quantification of intermuscular adipose tissue (IMAT) of the thigh. Magma 2020.
11. Brown R, Khegai O, Parasoglou P. Magnetic Resonance Imaging of Phosphocreatine and Determination of BOLD Kinetics in Lower Extremity Muscles using a Dual-Frequency Coil Array. Sci Rep 2016;6:30568.
12. Dixon WT. Simple proton spectroscopic imaging. Radiology 1984;153(1):189-194.
13. Glover GH, Schneider E. Three-point Dixon technique for true water/fat decomposition with B0 inhomogeneity correction. Magn Reson Med 1991;18(2):371-383.
14. Tsao J, Jiang Y. Hierarchical IDEAL: robust water-fat separation at high field by multiresolution field map estimation. ISMRM. Toronto 2008. p 653.
15. Jiang Y, Tsao J. Fast and robust separation of multiple chemical species from arbitrary echo times with complete immunity to phase wrapping. ISMRM. Melbourne2012.
16. Tustison NJ, Avants BB, Cook PA, Zheng Y, Egan A, Yushkevich PA, Gee JC. N4ITK: improved N3 bias correction. IEEE Trans Med Imaging 2010;29(6):1310-1320.
17. Ronneberger O, Fischer P, Brox T. U-Net: Convolutional Networks for Biomedical Image Segmentation. Medical Image Computing and Computer-Assisted Intervention, Pt Iii 2015;9351:234-241.
18. Deniz CM, Xiang S, Hallyburton RS, Welbeck A, Babb JS, Honig S, Cho K, Chang G. Segmentation of the Proximal Femur from MR Images using Deep Convolutional Neural Networks. Sci Rep 2018;8(1):16485.
19. Dice LR. Measures of the Amount of Ecologic Association Between Species. Ecol 1945;26:297-302.
20. Bittel DC, Bittel AJ, Tuttle LJ, Hastings MK, Commean PK, Mueller MJ, Cade WT, Sinacore DR. Adipose tissue content, muscle performance and physical function in obese adults with type 2 diabetes mellitus and peripheral neuropathy. Journal of diabetes and its complications 2015;29(2):250-257.
21. Kruse RL, Lemaster JW, Madsen RW. Fall and balance outcomes after an intervention to promote leg strength, balance, and walking in people with diabetic peripheral neuropathy: "feet first" randomized controlled trial. Physical therapy 2010;90(11):1568-1579.
22. Yoo M, D'Silva LJ, Martin K, Sharma NK, Pasnoor M, LeMaster JW, Kluding PM. Pilot Study of Exercise Therapy on Painful Diabetic Peripheral Neuropathy. Pain medicine 2015;16(8):1482-1489.
23. Labayen I, Medrano M, Arenaza L, Maiz E, Oses M, Martinez-Vizcaino V, Ruiz JR, Ortega FB. Effects of Exercise in Addition to a Family-Based Lifestyle Intervention Program on Hepatic Fat in Children With Overweight. Diabetes care 2020;43(2):306-313.
Figures
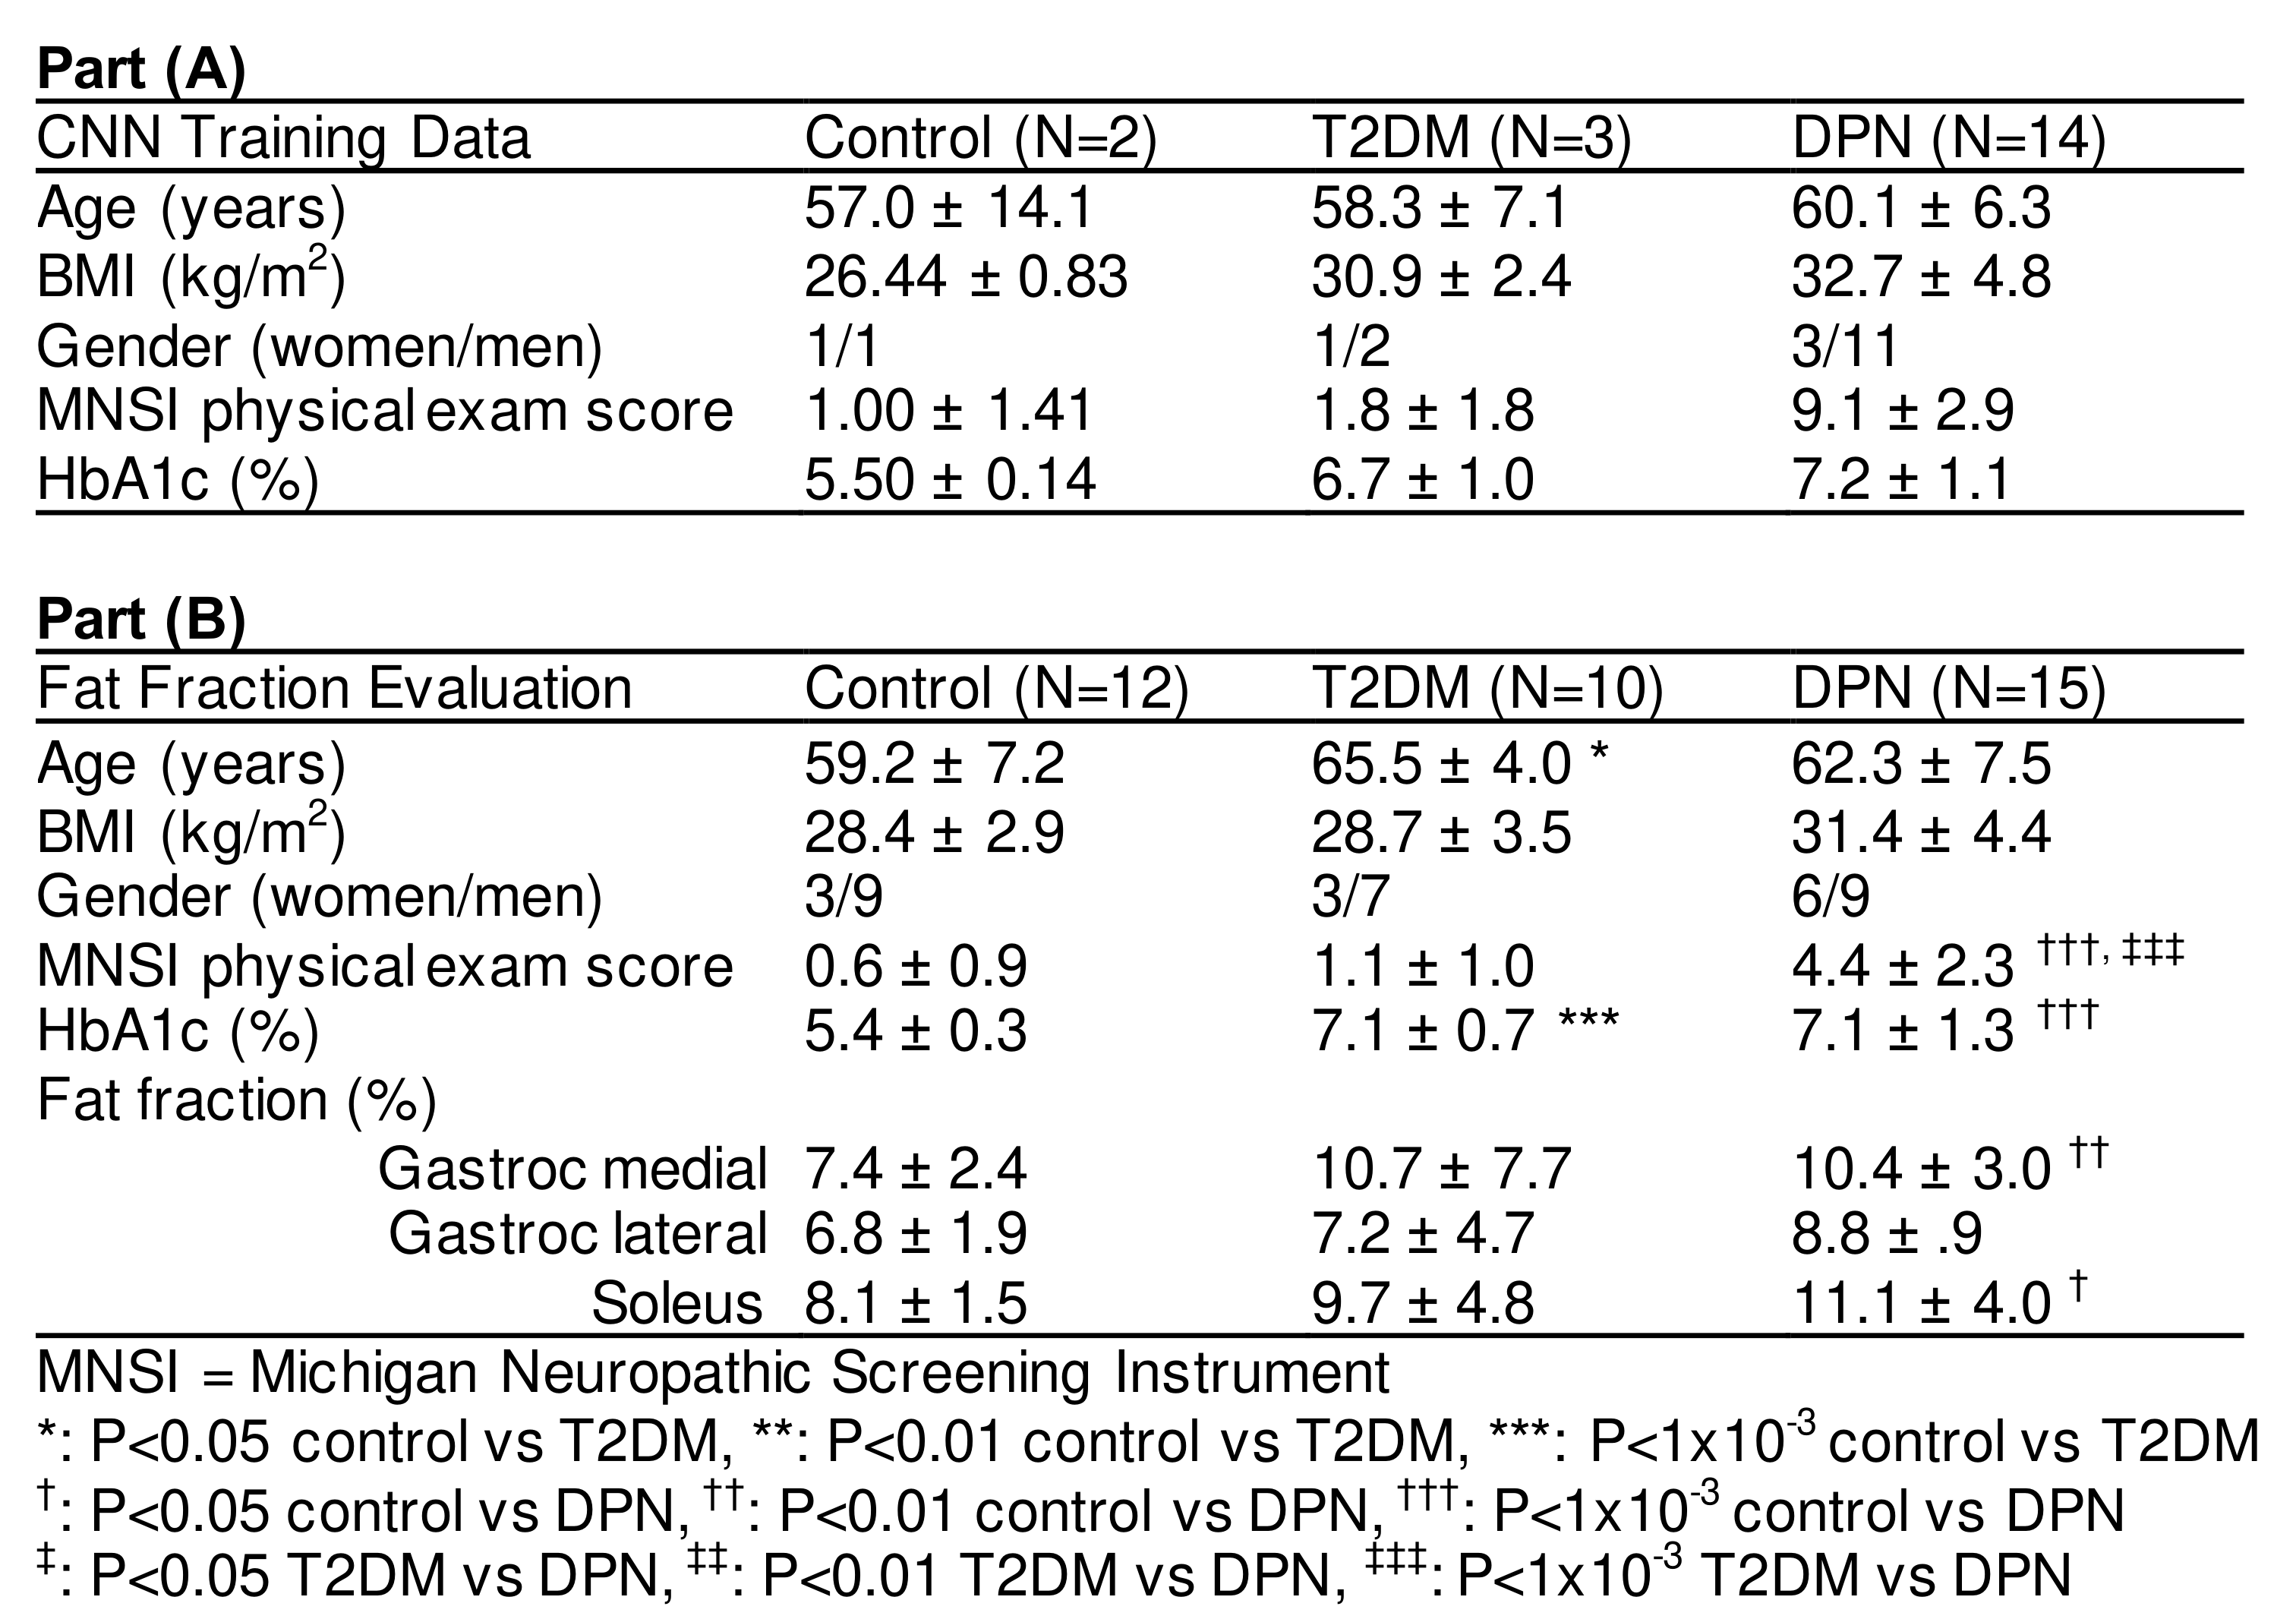
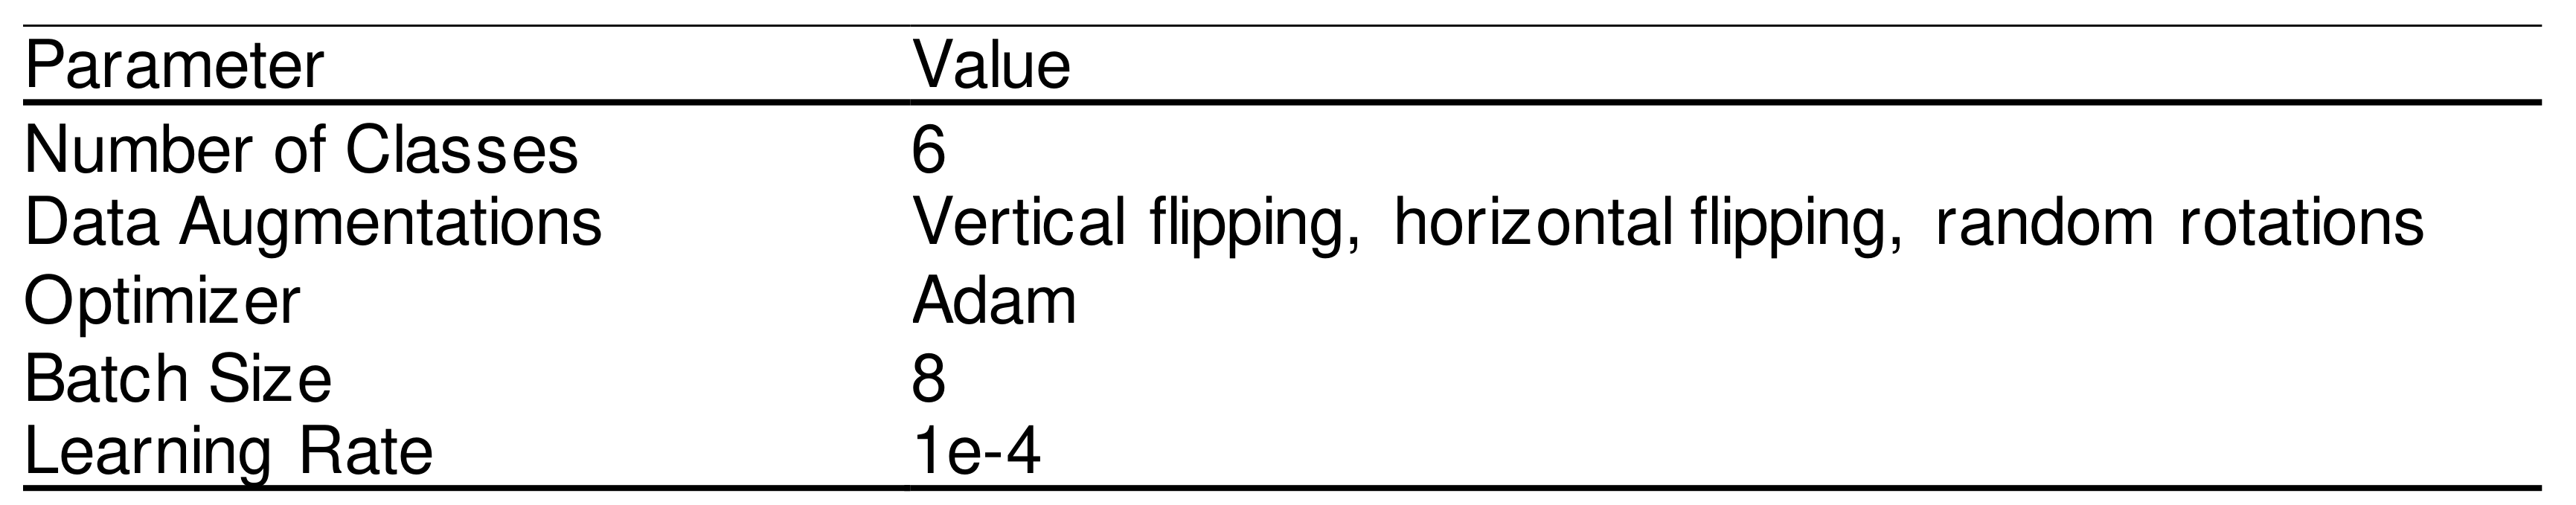
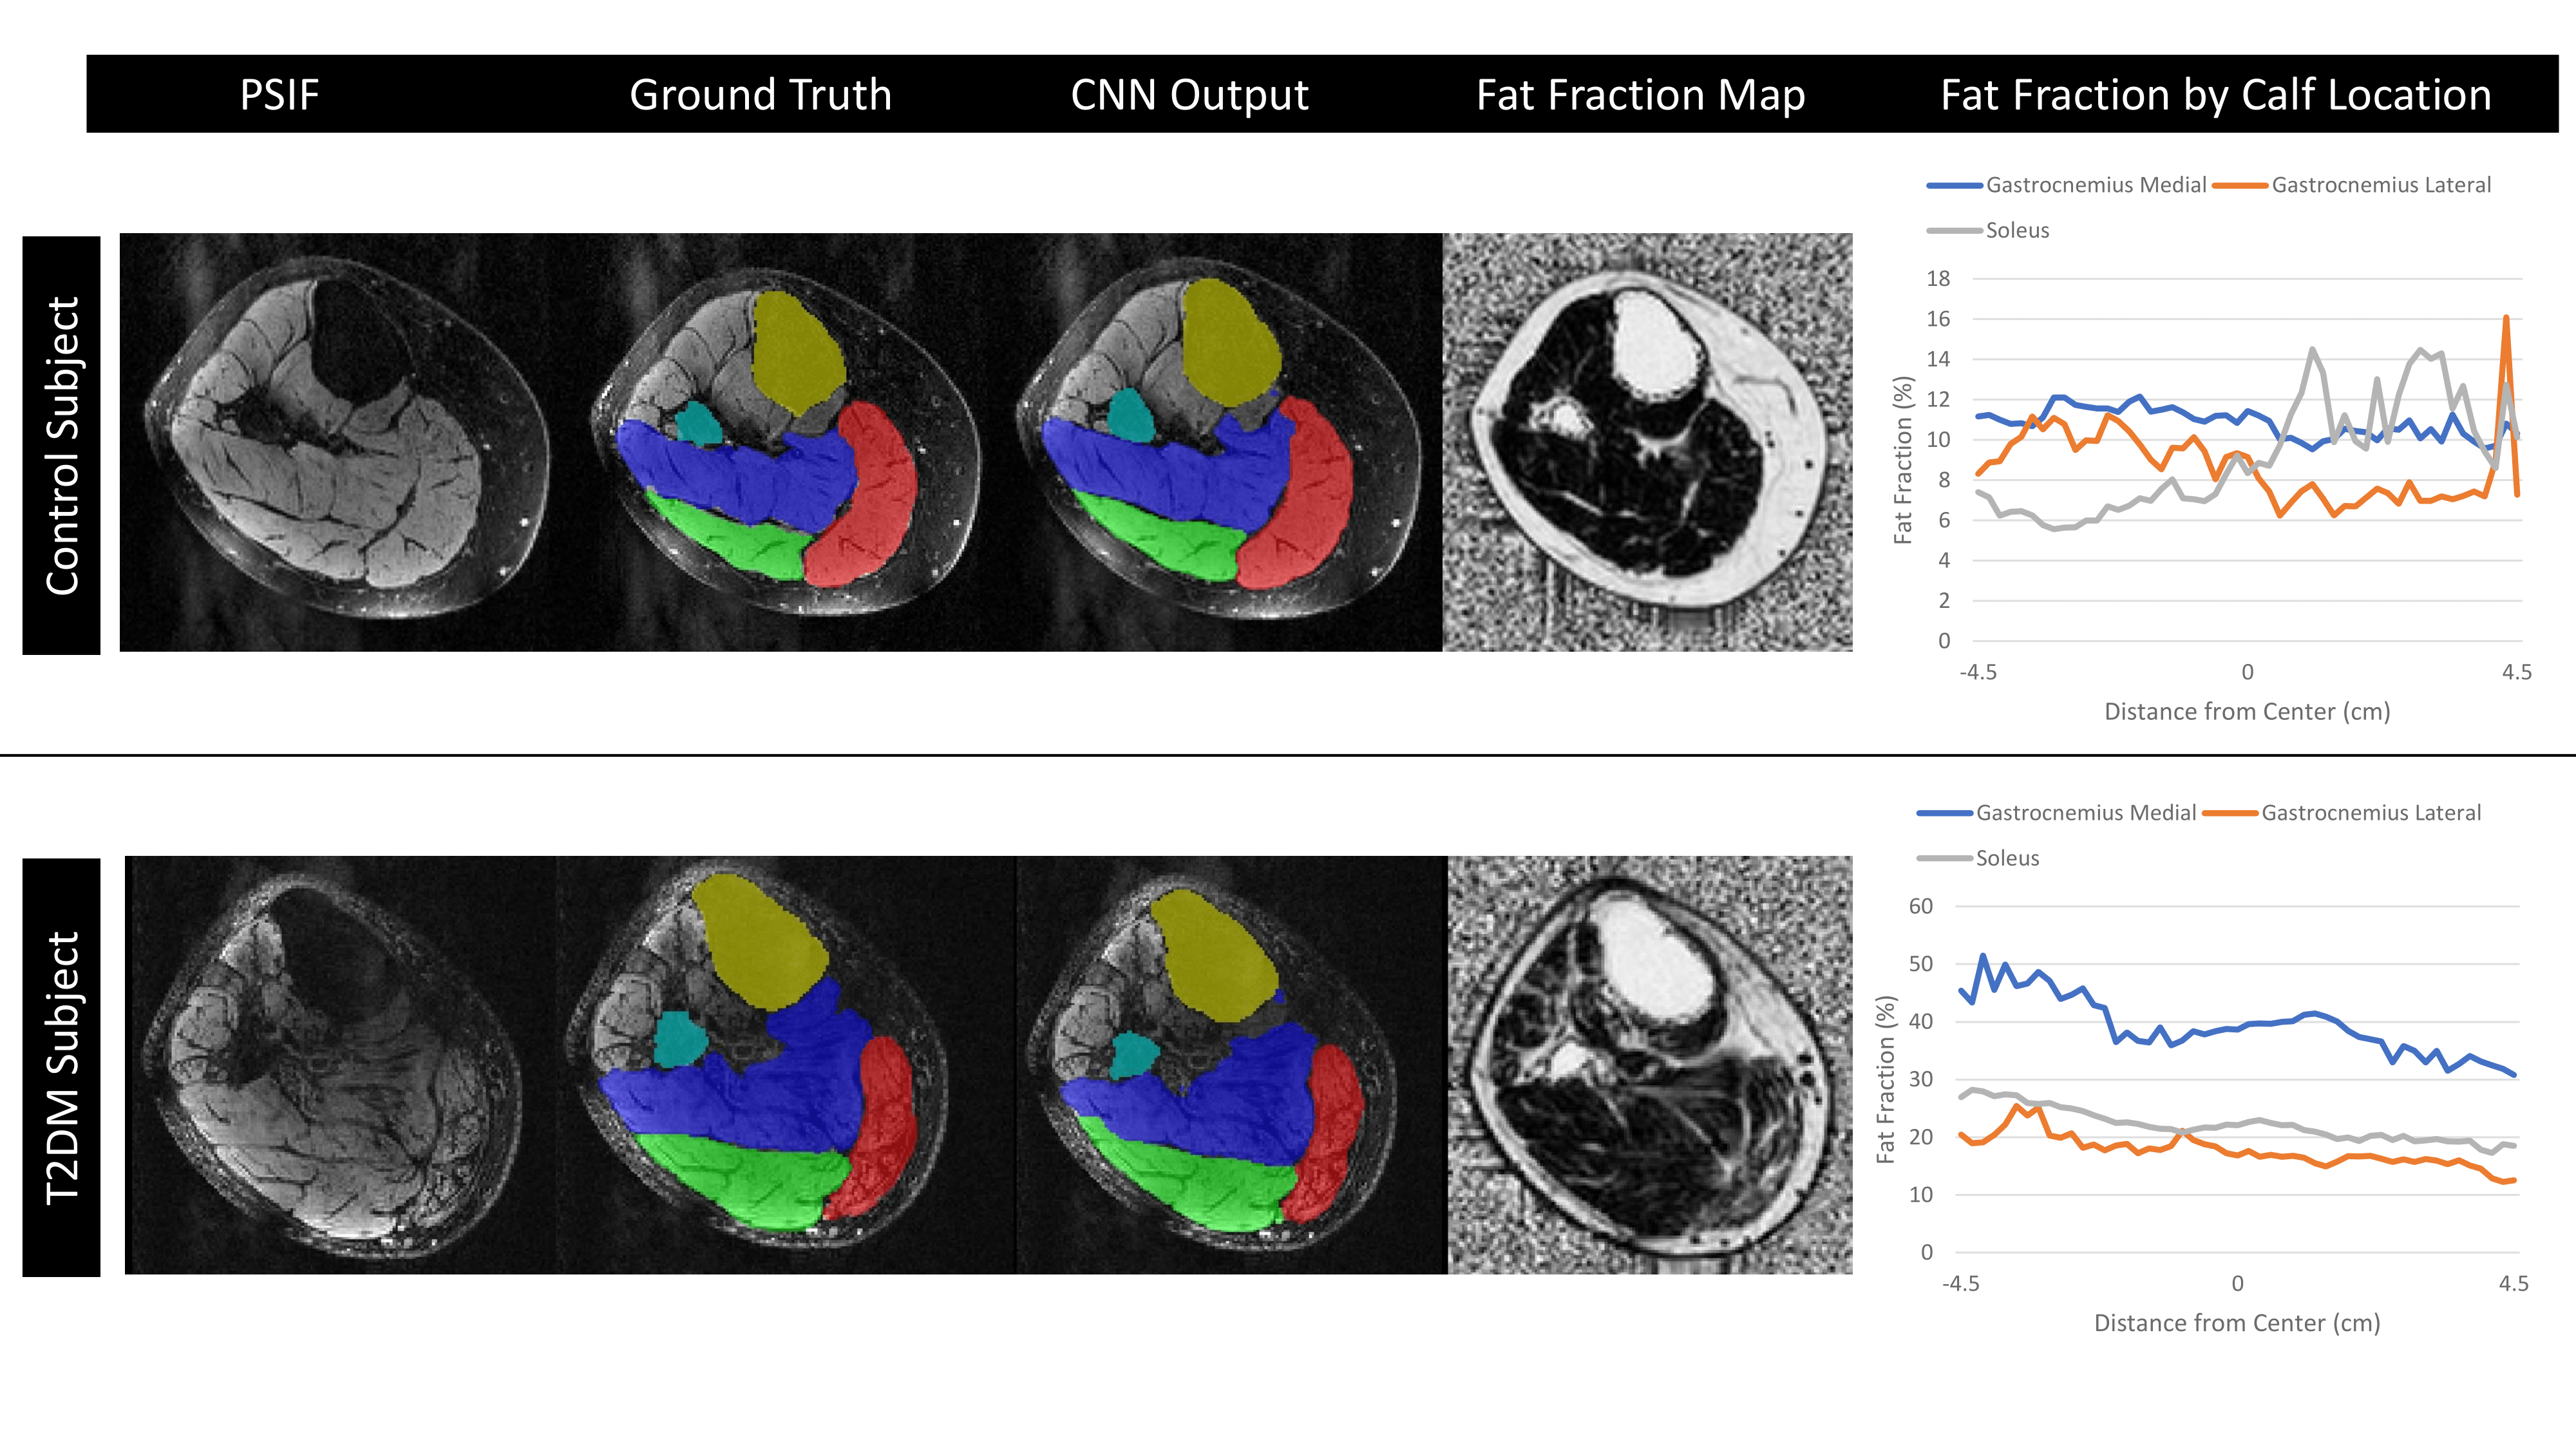
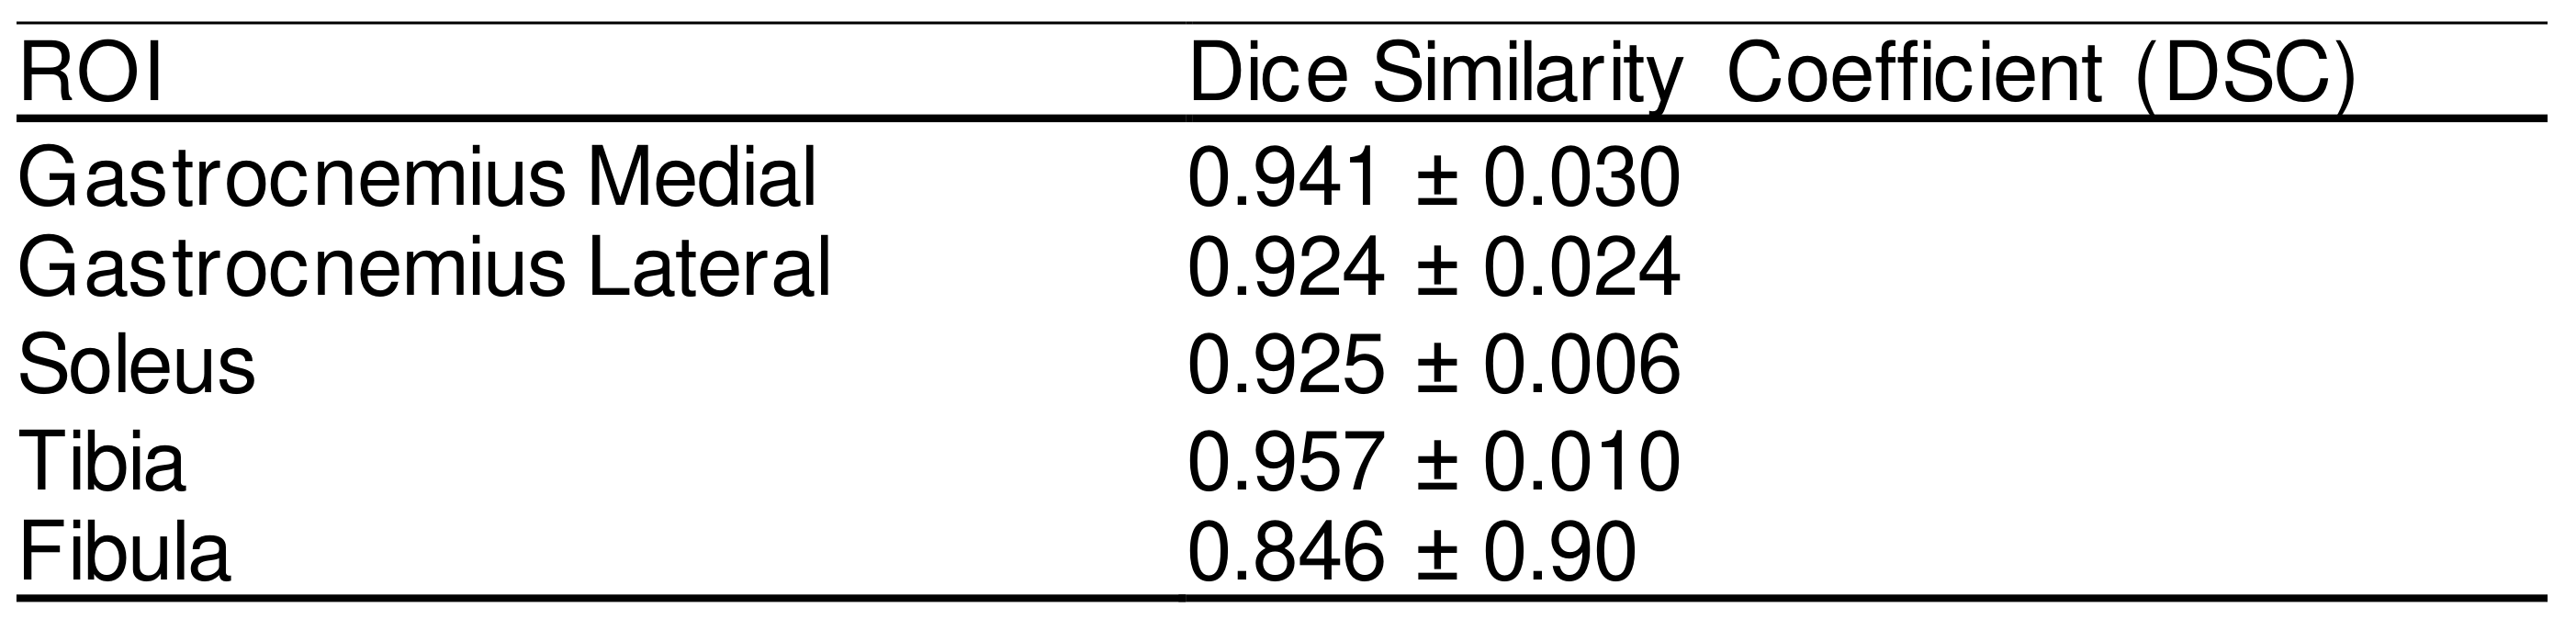
Table 3. CNN evaluation using dice similarity coefficient scores, calculated over an 8.1cm longitudinal region, in three-fold cross validation.