0257
Noninvasive Assessment of Healthy People, New-onset and Long Standing Male T2DM Patients on Skeletal Muscle With T1ρMRI of Calf Muscle
Yufei Zhao1,2, Yang Jiang1,2, Jingyue Dai1,2, Honghong Wu1,2, Ying Cui1,2, Xinxiang Li1,2, and Xingui Peng1,2
1Jiangsu Key Laboratory of Molecular and Functional Imaging, Southeast University, Nanjing, China, 2Radiology, Zhongda Hospital Southeast University, Nanjing, China
1Jiangsu Key Laboratory of Molecular and Functional Imaging, Southeast University, Nanjing, China, 2Radiology, Zhongda Hospital Southeast University, Nanjing, China
Synopsis
T1ρ magnetic resonance can non-invasively assess the changes in the distribution of myofiber in male T2DM patients and this changes is gradually obvious as the course of the disease progresses.
PURPOSE Type 2 Diabetes Mellitus (T2DM) is one of the chronic diseases with the highest incidence in the world. Insulin resistance of skeletal muscle plays a major role in the onset of type 2 diabetes(1). Skeletal muscle is a heterogeneous tissue composed of admixtures of fast and slow fiber types and their subtypes. The tibialis anterior (TA) muscle is mostly composed of fast-twitch fibers and the soleus (SOL) muscle is mostly composed of slow-twitch fibers(2). Patients with T2DM often experience the damage to the structure, function and metabolic capacity of skeletal muscle. The changes of muscle microstructure in long standing diabetic patients are mainly manifested as the decrease of type I slow oxidative fiber and the increase of type II fast glycolytic fiber(3), but the changes in the distribution of skeletal muscle fibers in new-onset diabetes patients are still unclear. The wounds of diabetic patients are not easy to heal so it is difficult to monitor the changes in muscle fiber ratio through biopsy, T1ρrelaxation times of magnetic resonance imaging can be used to display the differences in the TA and SOL muscles with age-, gender-, and exercise-related changes(4), it may become a potential tool for non-invasive continuous assessment of muscle changes in diabetic patients.
METHODS A total of 41 male patients, hospitalized in the Endocrinology Department were enrolled because of the T2DM from December 2014 to December 2019 in the study. All participants were divided into two groups based on their length of illness: Long Standing Diabetes Group (LSD)—duration of longer than 10 years (n=15), New-onset Diabetes Group (ND)—T2DM patients with disease no more than 6 months (n=26). We also recruited healthy volunteers as a control (n=20). The lower limb images of everyone in the group was examined by 3.0T whole-body MR scanner (MAGNETOM Verio; Siemens Medical Solutions). The scanning sequence included T2WI and T1ρwith the range covers the tibiofibular areas. T1ρrelaxation time of calf soleus muscle (SOL) and tibial anterior muscle (TA) was measured. The T1ρ maps were computed on a pixel-by-pixel basis using a monoexponential decay model created with MatLab (MathWorks, Natick, MA).
RESULTS Table 1 summarizes the clinical characteristics of the three groups. The average T1ρrelaxation time of the SOL in the LSD, ND, Control were 41.89±6.41 ms, 34.11±1.98 ms, 32.10±1.18 ms, respectively.(LSD vs ND: P<0.0001, LSD vs Control: P<0.0001, ND vs Control: P<0.0001. (Figure 1B). The average T1ρrelaxation time of the TA in the LSD, ND, Control were 39.24±7.21 ms, 32.76±2.48 ms, 31.38±2.33 ms, respectively. (LSD vs ND: P<0.0001, LSD vs Control: P<0.0001, ND vs Control: P<0.01) (Figure 1C). After eliminating age interference through screening, the average T1ρrelaxation times of the SOL in the ND, Control were 33.13±1.52 ms, 33.78±1.82 ms, respectively. The average T1ρrelaxation times of the TA were 32.01±1.96 ms and 32.69±2.75 ms, respectively. which are all obviously lower than that of long standing diabetes group (Figure 2). Linear correlations were observed between the T1ρrelaxation time of the TA, SOL and the duration of diabetes (R2=0.4198, P<0.0001; R2=0.3257, P<0.0001) (Figure 3A-B). The fasting blood glucose level of LSD(11.15±3.56 mmol/L) was also significantly higher than the ND (7.81±2.74 mmol/L) and Control (5.29±0.44 mmol/L) (P<0.0001, P<0.001) (Figure 3C). Linear correlations were also observed between the T1ρrelaxation time of the TA, SOL and the fasting blood glucose (R2=0.2527, P<0.0001; R2=0.071, P<0.001) (Figure 3D-E).
DISCUSSION The feasibility and sensitivity of T1ρMRI for noninvasive delineation of the difference between fast skeletal muscles(TA) and slow skeletal muscles (SOL)(4). The T1ρrelaxation time of the SOL and TA muscles of the lower limbs of diabetic patients increased compared with the healthy control group, and as the course of the disease progressed, the T1ρrelaxation time of the SOL and TA muscles of the calf further increased. The TA and SOL of LSD were significantly higher than other two groups. After excluding age-influencing factors, the statistical differences still exist and shows clear dependence on the length of illness and state of insulin resistance. Therefore, we suspect that the composition ratio of fast and slow myofibers has changed in the early stage of diabetes and it becomes more obvious as the course of the disease progresses and the insulin resistance aggravated. The percentage of muscle type 1 fiber has been positively correlated to insulin sensitivity in type 2 DM subjects(5-8). The T1ρcan be measured as the decay of the transverse magnetization in the presence of a spin-lock radiofrequency field, it reflected the change of collagen content(9), thereby monitoring the transforms in muscle composition of diabetic patients.
CONCLUSION Our results showed that T1ρrelaxation times can be used to display the differences in the TA and SOL muscles with the healthy volunteers and the T2DM at different stages. Noninvasive T1ρMRI is a potential tool for evaluating physiological and pathological changes of muscles related to the T2DM.
Acknowledgements
No acknowledgement found.References
(1) Kelley D E., et al, Diabetes. 2000; 49: 677-83.
(2) Oberbach A., et al, Diabetes Care. 2006; 29: 895-900.
(3) Punkt K., et al, Acta Histochem. 1999; 101: 53-69.
(4) Peng XG., et al, J Magn Reson Imaging. 2017; 46: 61-70.
(5) Marin P., et al, Diabetes Care. 1994; 17: 382-386.
(6) Oberbach A., et al, Diabetes Care. 2006; 29: 895-900.
(7) Lillioja S., et al, J Clin Investig. 1987; 80: 415-424.
(8) Hudlicka O. J Exp Biol. 1985; 115: 215-228.
(9) Wang YX., et al, Radiology 2011;259: 712-719.
Figures

Summary of the Subject Characteristics in Healthy Volunteers, New-onset diabetes and Long standing diabetes.
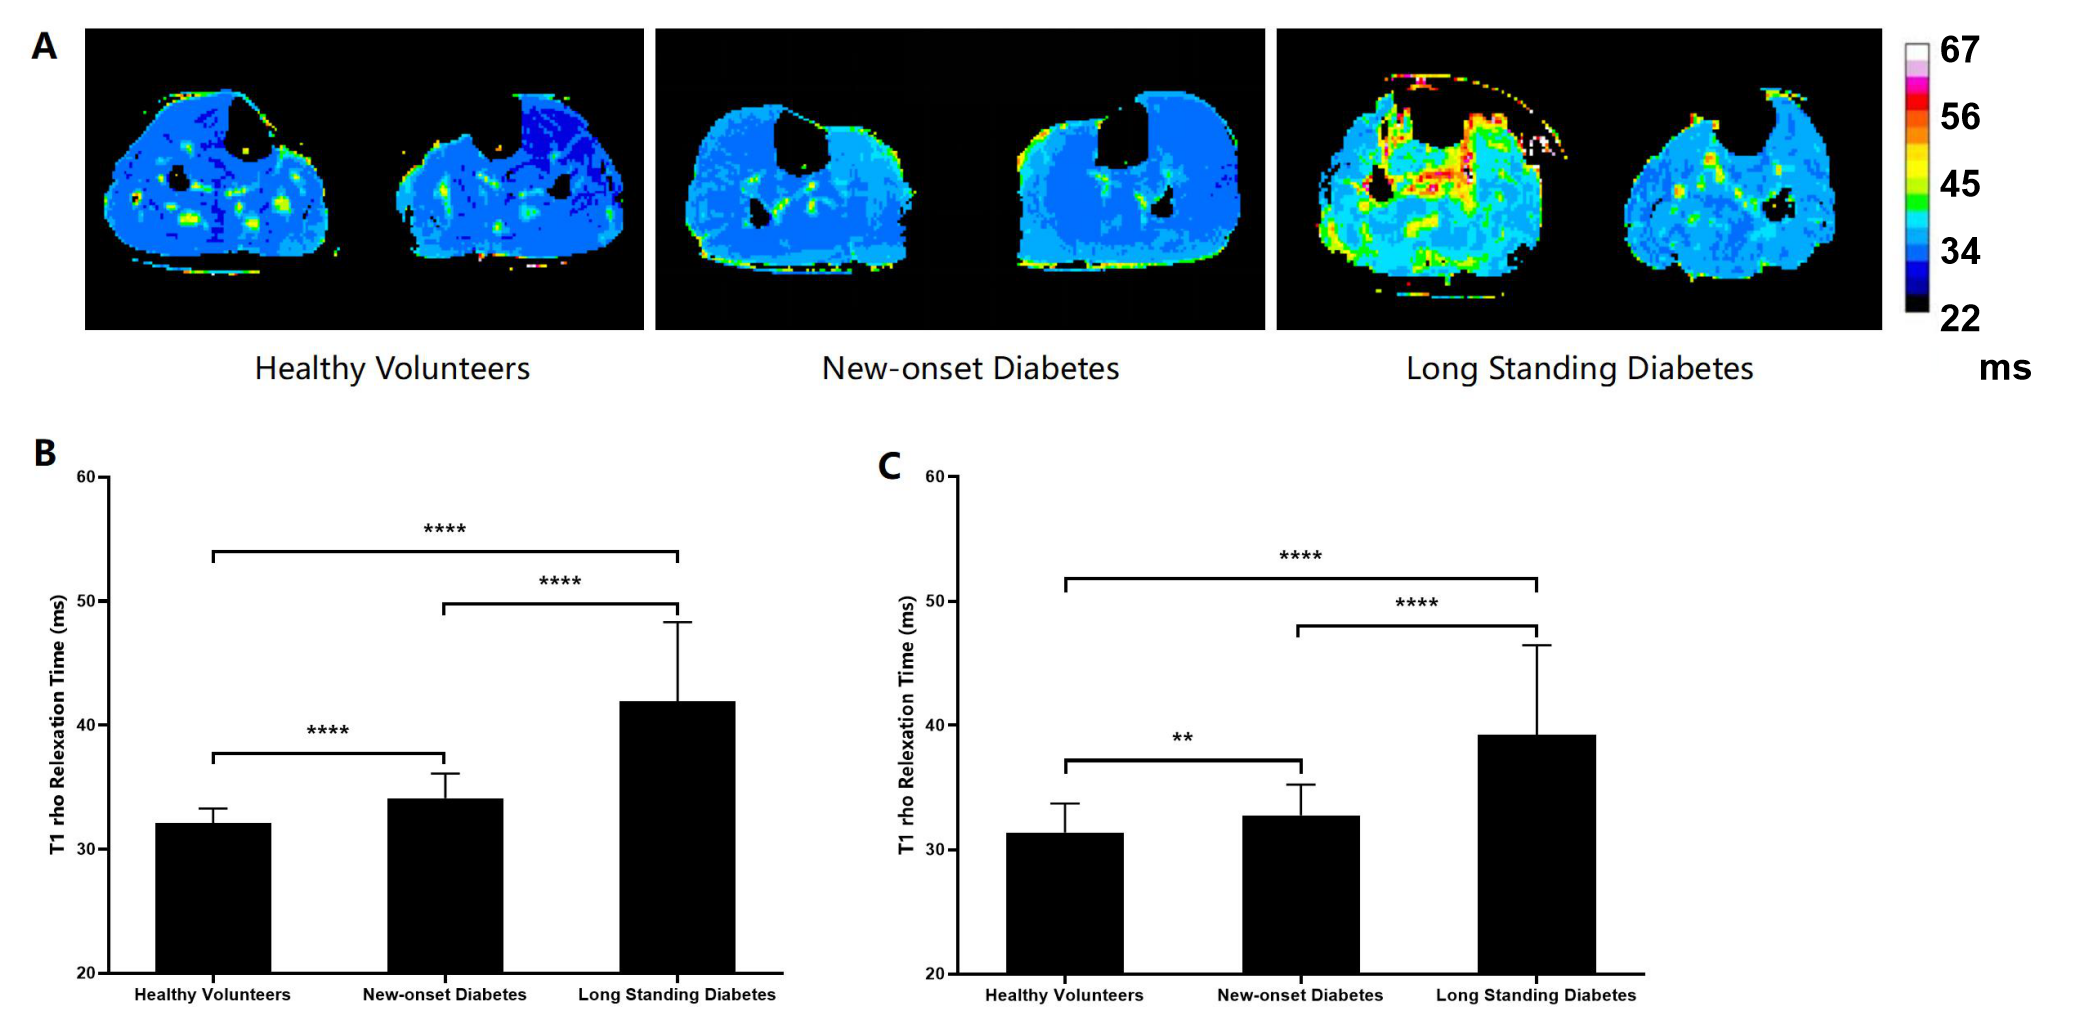
Comparison of the T1ρ relaxation time of the TA and SOL muscles in the three group. A) Comparison of the T1ρ map of the TA and SOL muscles in the three group. B) The T1ρ relaxation times of the SOL muscle in the three group. C) The T1ρ relaxation times of the TA in the three group.**P < 0.01 and ****P < 0.0001.
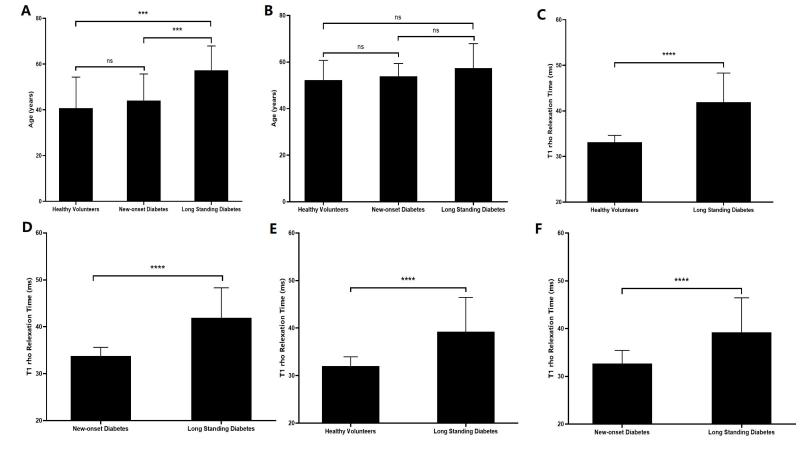
Comparison of the T1ρrelaxation time of the TA and SOL muscles in three age-matched groups after screening. A) The age of the three groups. B) The age of the three groups after screening. C) The T1ρrelaxation time of the SOL muscles in the Control after screening and LSD. D) The T1ρrelaxation time of the SOL muscles in the ND after screening and LSD. E) The T1ρrelaxation time of the TA muscles Control after screening and LSD. F) The T1ρrelaxation time of the TA muscles in the ND after screening and LSD.***P < 0.001 and ****P < 0.0001.
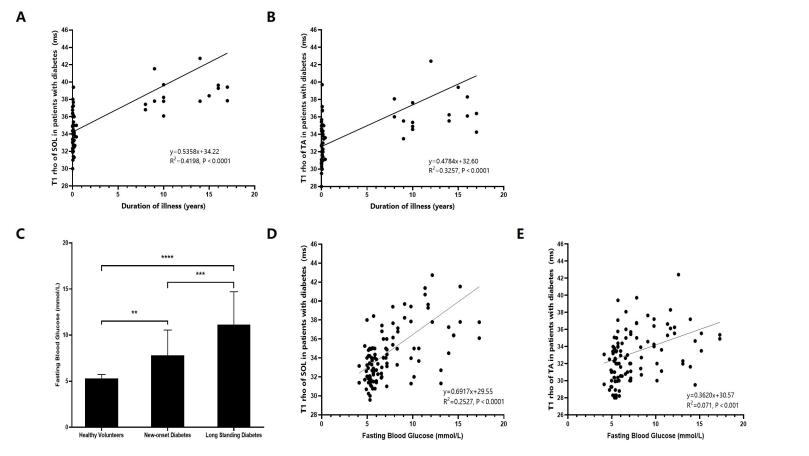
The linear relationship with the duration time of illness and fasting blood glucose of the TA and SOL muscles. A) The linear relationship with the duration time of illness of the TA muscles. B) The linear relationship with the duration time of illness of the SOL muscles. C) Fasting blood glucose levels in three groups. D) The linear relationship with the fasting blood glucose and the SOL muscles T1ρ relaxation time. E) The linear relationship with the fasting blood glucose and the TA muscles T1ρ relaxation time. **P < 0.01, ***P < 0.001 and ****P < 0.0001.