0256
Using texture analysis to detect changes in intestinal contents in people with cystic fibrosis1Sir Peter Mansfield Imaging Centre, University of Nottingham, Nottingham, United Kingdom, 2Nottingham NIHR Biomedical Research Centre, University of Nottingham, Nottingham, United Kingdom, 3Division of Child Health, Obstetrics and Gynaecology, University of Nottingham, Nottingham, United Kingdom, 4Nottingham Digestive Diseases Centre, University of Nottingham, Nottingham, United Kingdom
Synopsis
Cystic Fibrosis (CF) is a genetic disease leading to sticky mucus, slower small bowel transit and maldigestion. We used MRI to characterize gastrointestinal function in CF. Changes in the image texture suggested increased bacterial load in the small bowel, which we have now quantified applying Haralick texture analysis. The difference in texture observed between small bowel and colon chyme in healthy subjects was less distinct in people with CF (Control median 2.11 a.u. [IQR 0.71, 3.30] v.CF 0.90 a.u. [0.38, 1.67], Wilcoxon P=0.010). This compared well to subjective analysis. These findings probably indicate overgrowth of colonic bacteria and maldigestion.
Introduction
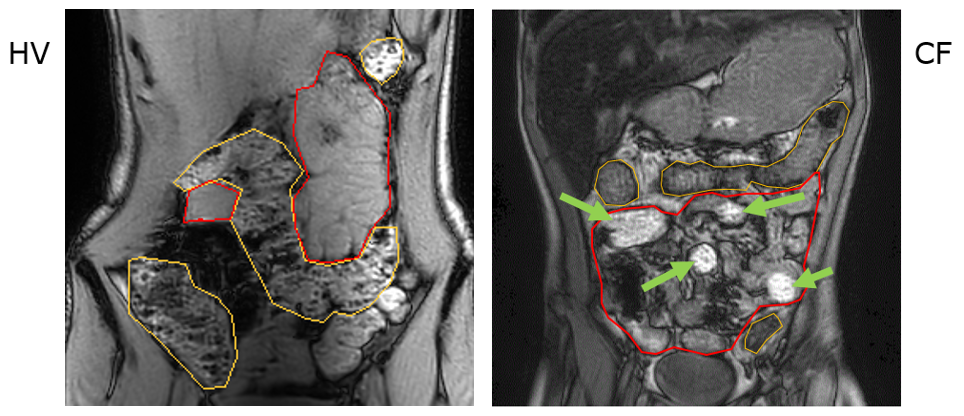
Cystic Fibrosis (CF) is a life-limiting genetic disease with dry, sticky mucus secretions, affecting the respiratory and digestive systems. Digestive disorders present a significant burden in CF. Up to 90% of people with CF have insufficient secretion of pancreatic enzymes and bicarbonate into the small bowel (SB) leading to malabsorption and reduced growth1. The most severe complication is complete blockage of the SB, distal intestinal obstruction syndrome, occurring in 6% of patients every year1. We have shown that people with CF have slower SB transit and reduced gastro-ileal reflex2 as assessed by MRI. We have also observed that the texture of the contents of the SB and colon is altered in CF on MRI (Fig 1)2. Normally, the contents of the colon show a mottled texture on T1-weighted MRI scans whereas the contents of the SB appear smooth. We need to be able to quantify these changes to use them as outcome measures in clinical studies of new treatment options for CF. We are here evaluating Haralick texture analysis, which has previously been used in cancer imaging3, but not in describing intestinal chyme, by comparing this measure with subjective analysis undertaken by two experienced assessors.Methods
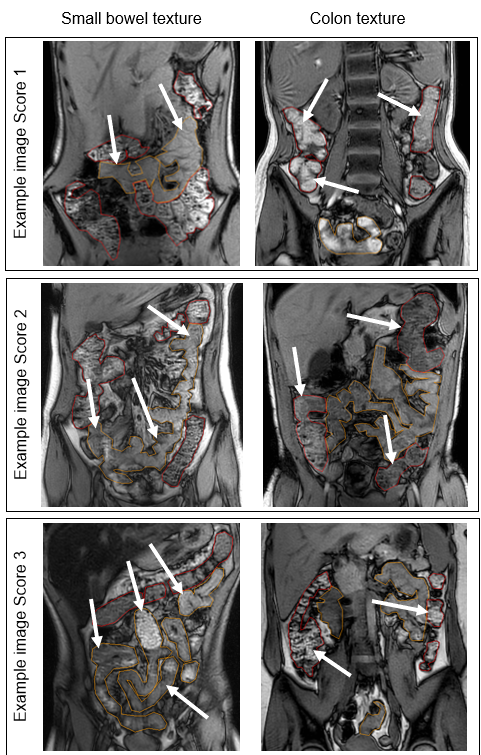
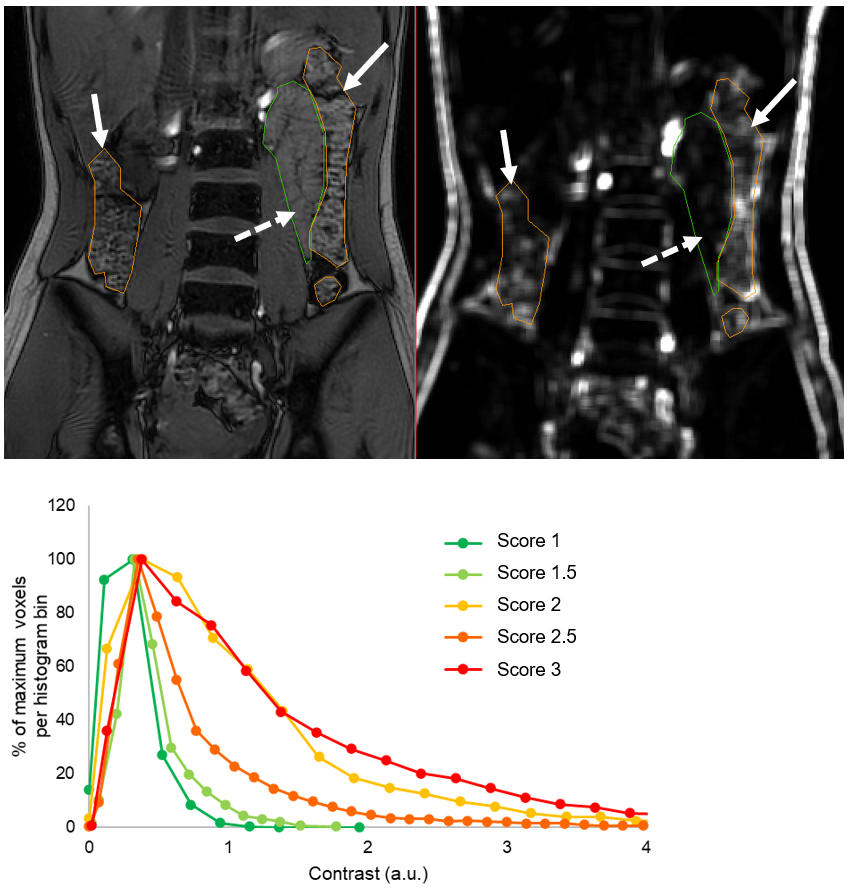
The data were taken from a pilot study of 12 people with CF and 12 healthy controls, aged 12-36 years and matched for age and gender2. Subjects underwent a fasted MRI scan using a 3T Ingenia (Philips) scanner, including a coronal dual-echo gradient echo sequence: TR 110 ms, TE 1.15 (out of phase, T1-weighted) and 2.30 ms (in phase), FA 60°. Global ROIs were drawn for the SB and for the colon, avoiding obvious gas pockets and partial volume effects, and then eroded (10 mm sphere) to exclude any gut wall. First, T1-weighted images were scored by two independent assessors (NSD, CH). For SB, the texture was scored between 1 (normal, very homogeneous throughout the SB) and 3 (very inhomogeneous, which could include differences in signal brightness or obvious mottling). For colon, the texture was similarly scored between 1 (smooth) and 3 (normal, mottled). See example images in Fig 2. The two assessors’ scores were averaged. Next, the Haralick contrast was calculated from the T1-weighted image using MIPAV (Center for Information Technology, US National Institutes of Health, Bethesda, MD, USA) (2 dimensional, spatially invariant, window size 7, 32 grey levels)4. The output is a map in which higher values correspond to regions with mottled texture (greater contrast between adjacent pixels), and lower values to smooth texture (see Fig 3).Results
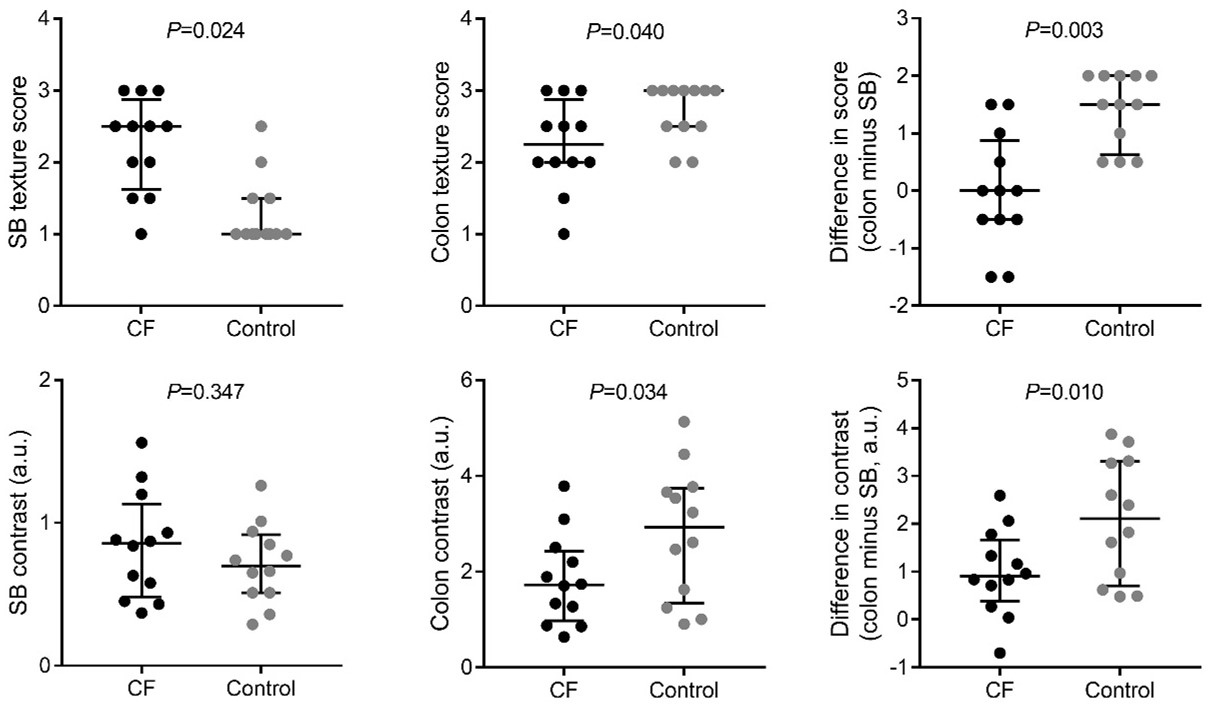
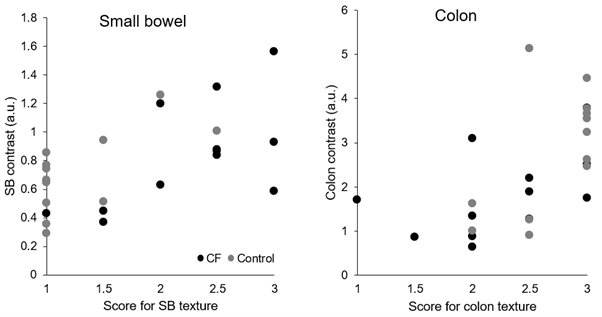
Experienced assessors’ scoring of SB texture (CF median 2 [IQR 1, 3] vs Control 1 [1, 1], P=0.024, Wilcoxon) and colon texture (CF 2.25 [2.875, 2] vs Control 3 [3, 2.5], P=0.040, Wilcoxon) showed clear differences between healthy controls and people with CF (Fig 4). Whilst SB Haralick contrasts were not significantly different in people with CF vs controls (CF median 0.85 a.u. [IQR 0.48, 1.13] vs Control 0.70 a.u. [0.51, 0.92], P=0.347, Wilcoxon), colon contrast was significantly lower in people with CF (CF 1.73 a.u. [0.98, 2.43] vs Control 2.93 a.u. [1.34, 3.74], P=0.034, Wilcoxon). The difference in the Haralick contrasts between SB and colon was significantly less in people with CF than in healthy control participants (CF 0.90 a.u. [0.38, 1.67] vs Control 2.11 a.u. [0.71, 3.30], P=0.010, Wilcoxon, Fig 4). Subjective score and Haralick score were positively correlated in the SB (Spearman’s rho 0.587, P=0.003) and in the colon (Spearman’s rho 0.688, P<0.001; Fig 5).Discussion
Subjective analysis and Haralick contrast analysis have been used to describe changes in the texture of the contents of the SB and colon in people with CF. Automated texture analysis also detected differences between CF and control individuals in the colon, but changes were not significant in the SB. We assume that the increased contrast in SB represents gas bubbles from bacterial overgrowth. This is consistent with similar signs on CT5, which we can now for the first time demonstrate on MRI. Interestingly we also found a significant change in colon texture, showing that the colonic contents are altered in CF, which may be due to altered microbiota6, the presence of unabsorbed nutrients including fats resulting in a more paste-like consistency of stools, or altered mucosal secretions. Automated (Haralick) texture analysis offers a more objective and quantitative approach compared to subjective analysis. The two measures correlated well and showed similar group differences in the colon but not in the SB. It is possible that the results are complicated by local changes in chyme brightness, which will be taken into account by the assessor but not by texture analysis, which only considers neighbouring voxels, and so further refinements to the texture analysis will be explored next.Conclusion
MRI analysis supports hypotheses about CF GI pathophysiology previously built on results from invasive methods7. The observed differences in intestinal contents may underlie GI complications in CF such as distal ileal obstruction syndrome and are therefore highly clinically relevant. Haralick contrasts provide a potential method for objective, and potentially semi automated analysis in the future. We are now using MRI to determine if new CF medications can improve GI function in CF.Acknowledgements
No acknowledgement found.References
1. Cystic Fibrosis Trust. UK cystic fibrosis registry annual data report 2019. (2020).
2. Ng, C. et al. Postprandial changes in gastrointestinal function and transit in cystic fibrosis assessed by Magnetic Resonance Imaging. J. Cyst. Fibros. S1569199320307335 (2020) doi:10.1016/j.jcf.2020.06.004.
3. Assefa, D. et al. Robust texture features for response monitoring of glioblastoma multiforme on T1-weighted and T2-FLAIR MR images: a preliminary investigation in terms of identification and segmentation. Med. Phys. 37, 1722–1736 (2010).
4. Hall-Beyer, M. GLCM Texture: A Tutorial. (2017).
5. Mayo-Smith, W. W. et al. The CT small bowel faeces sign: description and clinical significance. Clin. Radiol. 50, 765–767 (1995).
6. Burke, D. G. et al. The altered gut microbiota in adults with cystic fibrosis. BMC Microbiol. 17, 58 (2017).
7. Munck, A. Cystic fibrosis: evidence for gut inflammation. Int. J. Biochem. Cell Biol. 52, 180–183 (2014).
Figures