0254
Quantitative MRI measurements of ectopic fat and body composition as predictors of T2D remission after bariatric surgery1University College London, London, United Kingdom, 2University College London Hospitals, London, United Kingdom
Synopsis
Bariatric surgery can lead to rapid and substantial improvements in glycaemic control, often before significant weight loss has occurred. However, a proportion of patients do not achieve type 2 diabetes (T2D) remission after surgery despite significant post-surgical weight loss. Ectopic fat deposition and alterations in body composition are implicated in T2D pathoaetiology. Quantitative MRI (qMRI) can provide non-invasive measurements of ectopic organ fat and body composition which may have roles as predictors of T2D remission after bariatric surgery. This study aimed to assess the relationship between T2D remission status and qMRI-derived measurements of ectopic fat and body composition.
Introduction
Bariatric surgery can lead to rapid and substantial improvements in glycaemic control, often before significant weight loss has occurred. Studies have shown type 2 diabetes (T2D) remission rates of 20% to 84% after bariatric surgery, which in this context has been termed ‘metabolic surgery’ (1,2). However, a proportion of patients do not achieve T2D remission after metabolic surgery despite significant post-surgical weight loss. Several factors have been identified that are associated with failure to achieve remission of T2D including: age, poor baseline glycaemic control, use of insulin, duration of T2D before surgery, the type of surgical procedure, and percentage weight loss. There is continued interest and a clinical need in identifying other variables that can help improve predictions of T2D remission after surgery.Alterations in body composition, particularly the relative sizes of different fat compartments, for example the subcutaneous adipose tissue (SAT) and visceral adipose tissue (VAT), have a role in insulin resistance and development of T2D. Furthermore, increased ectopic fat deposition in the liver and pancreas have been implicated in T2D initiation. Chemical shift-encoded MRI sequences can be used to quantify organ fat and body composition non-invasively. Recent developments in both image acquisition and analysis mean that proton density fat fraction (PDFF) measurements are accurate and reproducible across multiple sites.
The aim of this study was to assess the relationship between quantitative MRI (qMRI)-derived measurements of organ fat and body composition and T2D remission status after bariatric surgery.
Methods
Patients with pre-operative T2D who had undergone bariatric surgery were identified from a clinical database. Patients were divided into two groups (one with remission of T2D and the other without remission) according to their T2D remission status using the American Diabetes Association criteria (3).All patients had a quantitative MRI scan of the abdomen and pelvis (from the dome of the liver to the mid-thigh) on a wide bore 3T Philips system (Ingenia, Philips, Amsterdam, Netherlands) using a dedicated protocol for imaging obese patients, Figure 1. This consisted of a vendor-supplied six-echo spoiled gradient echo acquisition with bipolar readout gradients. PDFF calculation was performed in-line (mDixon Quant) using a complex model for fat composition and correction for R2* decay.
Images were analysed using an in-house MATLAB tool. For the liver, a circular region of interest (ROI) measuring up to 20 mm in diameter was placed in each of the 9 Coinaud liver segments on PDFF maps, avoiding vessels and the biliary tree, Figure 2a. For the pancreas, a circular ROI measuring 100m2 was placed on PDFF maps parenchyma of the head, body and tail of the pancreas, Figure 2b. Body composition was measured using an in-house MATLAB tool which segments fat and muscle using fat and water-only images.
The VAT:SAT fat ratio was calculated from the visceral and subcutaneous fat areas (in cm2) at the level of the L3 vertebral body. Total body fat mass (FM), fat-free mass (FFM) and skeletal muscle mass (SM) were calculated using regression equations described previously (4) and adjusted for height to give FM, FFM and SM indices.
Differences between mean liver PDFF, mean pancreatic PDFF, and VAT:SAT ratio for the two groups were assessed using the Mann-Whitney U test. Differences in the FM index, FFM index and SM index were assessed using the unpaired t-test.
Results and Discussion
26 patients, 13 with remission (8 F, 5 M; median age 53.5, Q1Q3 48.6 59.1) and 13 without remission (6 F, 7 M; median age 52.5, Q1Q3 50.9 55) of T2D completed this study.There was no significant difference in the mean liver PDFF between the no remission (median = 4.27%, IQR = 3.23 – 4.58%) and remission groups (median = 4.57 %, IQR 3.64 – 6.20 %), (U = 64, p = 0.31), Figure 3a.
There was no significant difference in the mean pancreatic PDFF (mean of the head, body and tail) between the no remission group (median = 8.03 %, IQR 7.44 – 9.84 %) and the remission group (median = 8.48%, IQR = 7.30 – 11.5%), (U = 73, p = 0.58), Figure 3b.
The median VAT:SAT ratio was significantly greater in the no remission group (0.54, IQR = 0.37 – 1.16) compared to the remission group (0.29, IQR = 0.21 – 0.48), (U = 39, p = 0.019), Figure 4a. There was no significant difference in the mean FM index (p = 0.99), FFM mass index (p = 0.89), SM index (p = 0.88), Figure 4b-d.
Conclusion
The VAT:SAT ratio was significantly greater in the patients who had not achieved remission of T2D. There was no significant difference in the FM, FFM or SM indices measured using MRI between the remission and no remission groups, suggesting that the distribution of fat in different compartments, i.e. the VAT and SAT depots, is more important in remission of T2D after bariatric surgery than the absolute total amount of fat.No differences in ectopic organ fat deposition were found between the remission and no remission groups but further, larger studies with pre- and post-operative imaging are warranted to investigate associations between ectopic organ fat and body composition and T2D remission.
Acknowledgements
NS, RB, MHC and SAT receive funding from the UCL/UCLH BRC. This work was undertaken at UCLH/UCL, which receives funding from the UK Department of Health’s the National Institute for Health Research (NIHR) Biomedical Research Centre (BRC) funding scheme. The views expressed in this publication are those of the authors and not necessarily those of the UK Department of Health.References
1. Hayes MT, Hunt LA, Foo J, Tychinskaya Y, Stubbs RS. A Model for Predicting the Resolution of Type 2 Diabetes in Severely Obese Subjects Following Roux-en Y Gastric Bypass Surgery. Obes Surg. 2011 Jul 19;21(7):910–6.
2. Chondronikola M, Harris LLS, Klein S. Bariatric surgery and type 2 diabetes: are there weight loss-independent therapeutic effects of upper gastrointestinal bypass? J Intern Med. 2016 Nov 1;280(5):476–86.
3. Buse JB, Caprio S, Cefalu WT, Ceriello A, Del Prato S, Inzucchi SE, et al. How do we define cure of diabetes? Vol. 32, Diabetes Care. American Diabetes Association; 2009. p. 2133–5.
4. Mourtzakis M, Prado CMM, Lieffers JR, Reiman T, McCargar LJ, Baracos VE. A practical and precise approach to quantification of body composition in cancer patients using computed tomography images acquired during routine care. Appl Physiol Nutr Metab. 2008 Oct;33(5):997–1006.
Figures
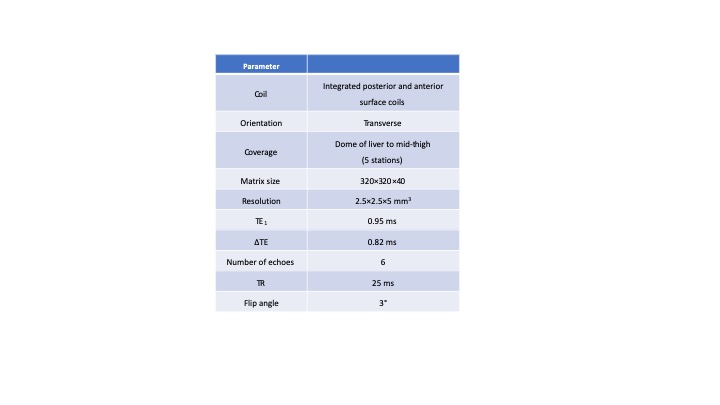
Figure 1.
MRI acquisition parameters
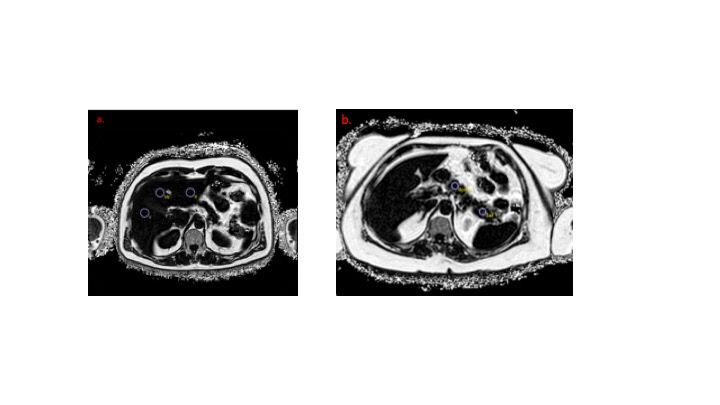
Figure 2.
Example of ROI placement on PDFF maps of (a) the liver and (b) the body and tail of the pancreas.
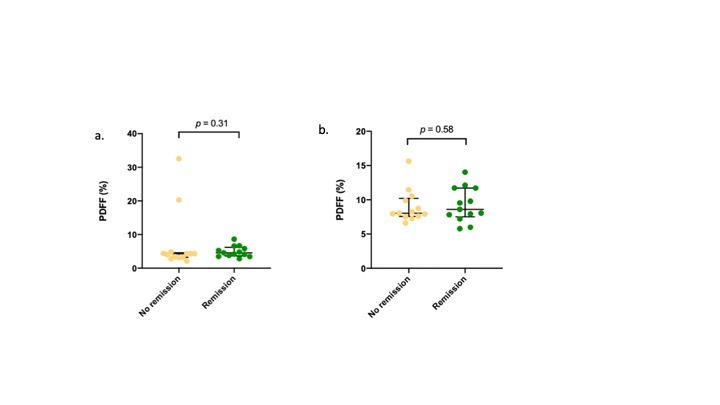
Figure 3.
a.Plot showing mean PDFF of the liver in the no remission and remission groups.
b.Plot showing mean PDFF (mean of three anatomical regions) of the pancreas in the no remission and remission groups.
Error bars represent the median ± interquartile range.
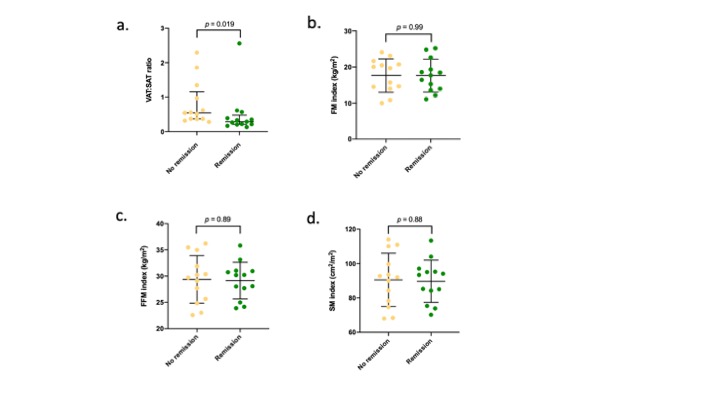
Figure 4.
Graphs showing comparison of body composition parameters between the no remission and remission groups.
(a) VAT:SAT ratio (median ± IQR), (b) FM index (mean ± SD), (c) FFM index (mean ± SD), (d) SM index (mean ± SD).