0253
To quantify liver and pancreatic fat content in subjects with and without type 2 diabetes as measured by MRI-PDFF-observational study
Sonal Krishan1, Aparajita Pradhan2, and Shafi Kuchay3
1Radiology, Medanta Hospital, Gurgaon, India, 2Medanta Hospital, Gurgaon, India, 3Endocrinology, Medanta Hospital, Gurgaon, India
1Radiology, Medanta Hospital, Gurgaon, India, 2Medanta Hospital, Gurgaon, India, 3Endocrinology, Medanta Hospital, Gurgaon, India
Synopsis
Aim of this study was to quantify liver (LFC) and pancreatic fat content (PFC) in subjects with and without type 2 diabetes (DM) as measured by MRI-PDFF. 25 adult patients who had recently diagnosed DM were compared with control group of 37 without DM. All underwent MRI PDFF for evaluation of LFC and PFC. The mean LFC in DM group was more: 12.1 % (8-20) vs Non-DM 6.7% (4.2-10.7).The overall prevalence of NAFLD in our study, was 72.6% (45/62 patients).In DM subgroup the NAFLD prevalence was more-88.0%. MRI PDFF can be a screening tool for NAFLD in patients with DM.
Introduction
There is urgent need for accurate assessment of NAFLD among patients with type 2 diabetes (DM) so that preventive measures could be taken to prevent its progression. There are scarce data regarding Magnetic Resonance Imaging derived proton density fat fraction (MRI PDFF) burden of liver and pancreatic fat in patients with type 2 diabetes.Aim
To quantify liver and pancreatic fat content in subjects with and without type 2 diabetes as measured by MRI-PDFF. Comparing the prevalence of NAFLD in subjects with and without DM (defined as MRI PDFF >6%). Comparing the prevalence of Liver fibrosis in subjects with and without DM by using USG based Acoustic Radiation Force Impulse (ARFI)Methods
This prospective, single center, observational study was conducted between 1 October 2019 and 20 August 2020 at tertiary care hospital in Delhi NCR, India.Consecutive selected subjects attending wellness clinic and opting for whole body check-up were enrolled for the study. Covid pandemic severely restricted the recruitment of patients.
Subjects with history of diagnosed diabetes mellitus in last 2 years on anti-diabetic therapy (DM group) were compared with participants without DM if there was no history of DM in the past and they fulfilled all exclusion criteria (Table 1)
MRI PDFF protocol- Imaging was performed on 1.5 Tesla clinical scanner (Aera, Siemens, Ehrlangen, Germany) using a sixteen-channel body phased array coil. For each patient, two repeated measurements of quantitative PDFF were made to assess repeatability(precision) in the same day. For volumetric MRI fat fraction imaging, three-dimensional volume interpolated breath-hold examination sequence was used. Imaging parameters for the MRI sequence are listed in Table 2. Reconstructed fat fraction map images (in line complex-based PDFF maps) were displayed and edited in DICOM format. A senior radiologist recorded fat-fraction from the nine ROIs in each liver segment, avoiding surface, blood vessels, liver lesion. An average fat-fraction (weighted according to size of ROI) across the entire liver was reported. Average ROI size was 252 (6.8 cm2) pixels. ROI in pancreas were divided into head, neck, uncinate process, proximal body, mid body, distal body and tail.
Shear wave velocity was measured with ultrasound based ARFI as per American College of Radiology-Society of Radiologists in Ultrasound 2019 guideline for assessing liver stiffness (graded as no fibrosis, mild, moderate and severe, reported in m/sec). Readings were obtained in right anterior segment V/VIII, right posterior segment VI/VII, segment IV and left lateral segment after taking 10 valid measurements at a depth of 2.5 - 5.5cm on Siemens Acuson 2000 ultrasound unit. The acceptable interquartile range was less than 30%.
Statistical Analyses: For normally distributed data, related samples paired t test, and unrelated samples, student t test, was used. In non-normal distribution, unrelated, Mann Whitney U test and related Wilcoxon sign rank test was used. For comparison between more than 2 groups, further choice of test was decided by distribution of data. In normally distributed unrelated data, one-way ANOVA was used, and for related Two-way ANOVA was used. For non-normally distributed, unrelated data, Kruskal Wallis test was used, and for related data, Friedman test was used.
Results
A total of 62 subjects were included in the final analysis. Among them, twenty-five were with DM and 37 were without diabetes mellitus (Control-Non DM group).LFC assessed by MRI PDFF, showed significant difference between both the groups in mean and across all individual segments of liver. The mean LFC in DM group was 12.1 % (8-20) vs Non-DM 6.7% (4.2-10.7) (Figure 1). The overall prevalence of NAFLD was 72.5% (LFC on MRI PDFF>6%). In DM subgroup the NAFLD prevalence was 88.0% and in Non-DM group NAFLD prevalence was 62.1% (p=0.041).There was a significant association with presence of DM and having NAFLD.
No significant difference was found in PFC in both groups. No difference was observed in PFC, either mean or in individual segment, on basis of presence or absence of NAFLD. The mean PFC in NAFLD subjects was 7.5% and in Non NAFLD was 6.5% (Figure 2).
Based on ARFI 71% had - mild to moderate fibrosis among DM group (p value 0.001) (Figure 3). Mean ARFI (m/sec) value in NAFLD subjects was significantly higher [ 1.410(1.25-1.54)] than in Non NAFLD subjects [0.990(.97-1.14)].
Discussion and Conclusion
Overall, this study clearly shows the utility of MRI PDFF as a screening tool in quantification of liver fat content/ NAFLD. It also re-emphasises the importance of screening of individuals with diabetes for NAFLD.Liver fat content measured by MRI PDFF is significantly higher in subjects with diabetes mellitus as compared to those without diabetes mellitus.Pancreatic fat content in our study population was 7.0%. Presence of T2DM, did not seem to influence pancreatic fat content as detected by MRI PDFF. Prevalence of NAFLD in our study population (urban, north Indian), based on MRI PDFF findings, was high- 72.6%.However due to low numbers this is not a representation of entire population-further studies are recommended.Acknowledgements
No acknowledgement found.References
- European Association for the Study of the Liver (EASL), European Association for the Study of Diabetes (EASD), European Association for the Study of Obesity (EASO). EASL-EASD-EASO Clinical Practice Guidelines for the management of non-alcoholic fatty liver disease. J Hepatol. 2016;64(6):1388–402.
- National Guideline Centre (UK). Non-Alcoholic Fatty Liver Disease: Assessment and Management [Internet]. London: National Institute for Health and Care Excellence (UK); 2016 [cited 2020 Jul 30]. (National Institute for Health and Care Excellence: Guidance). Available from: http://www.ncbi.nlm.nih.gov/books/NBK374135/
- Ballestri S, Zona S, Targher G, Romagnoli D, Baldelli E, Nascimbeni F, et al. Nonalcoholic fatty liver disease is associated with an almost twofold increased risk of incident type 2 diabetes and metabolic syndrome. Evidence from a systematic review and meta-analysis. J Gastroenterol Hepatol. 2016 May;31(5):936–44.
- Reeder SB, Sirlin C. Quantification of Liver Fat with Magnetic Resonance Imaging. Magn Reson Imaging Clin N Am. 2010 Aug 1;18(3):337–57.
- Bonekamp S, Tang A, Mashhood A, Wolfson T, Changchien C, Middleton MS, et al. Spatial Distribution of MRI-Determined Hepatic Proton Density Fat Fraction in Adults with Nonalcoholic Fatty Liver Disease. J Magn Reson Imaging JMRI. 2014 Jun;39(6):1525–32.
- Caussy C, Reeder SB, Sirlin CB, Loomba R. Noninvasive, Quantitative Assessment of Liver Fat by MRI-PDFF as an Endpoint in NASH Trials. Hepatol Baltim Md. 2018;68(2):763–72.
Figures
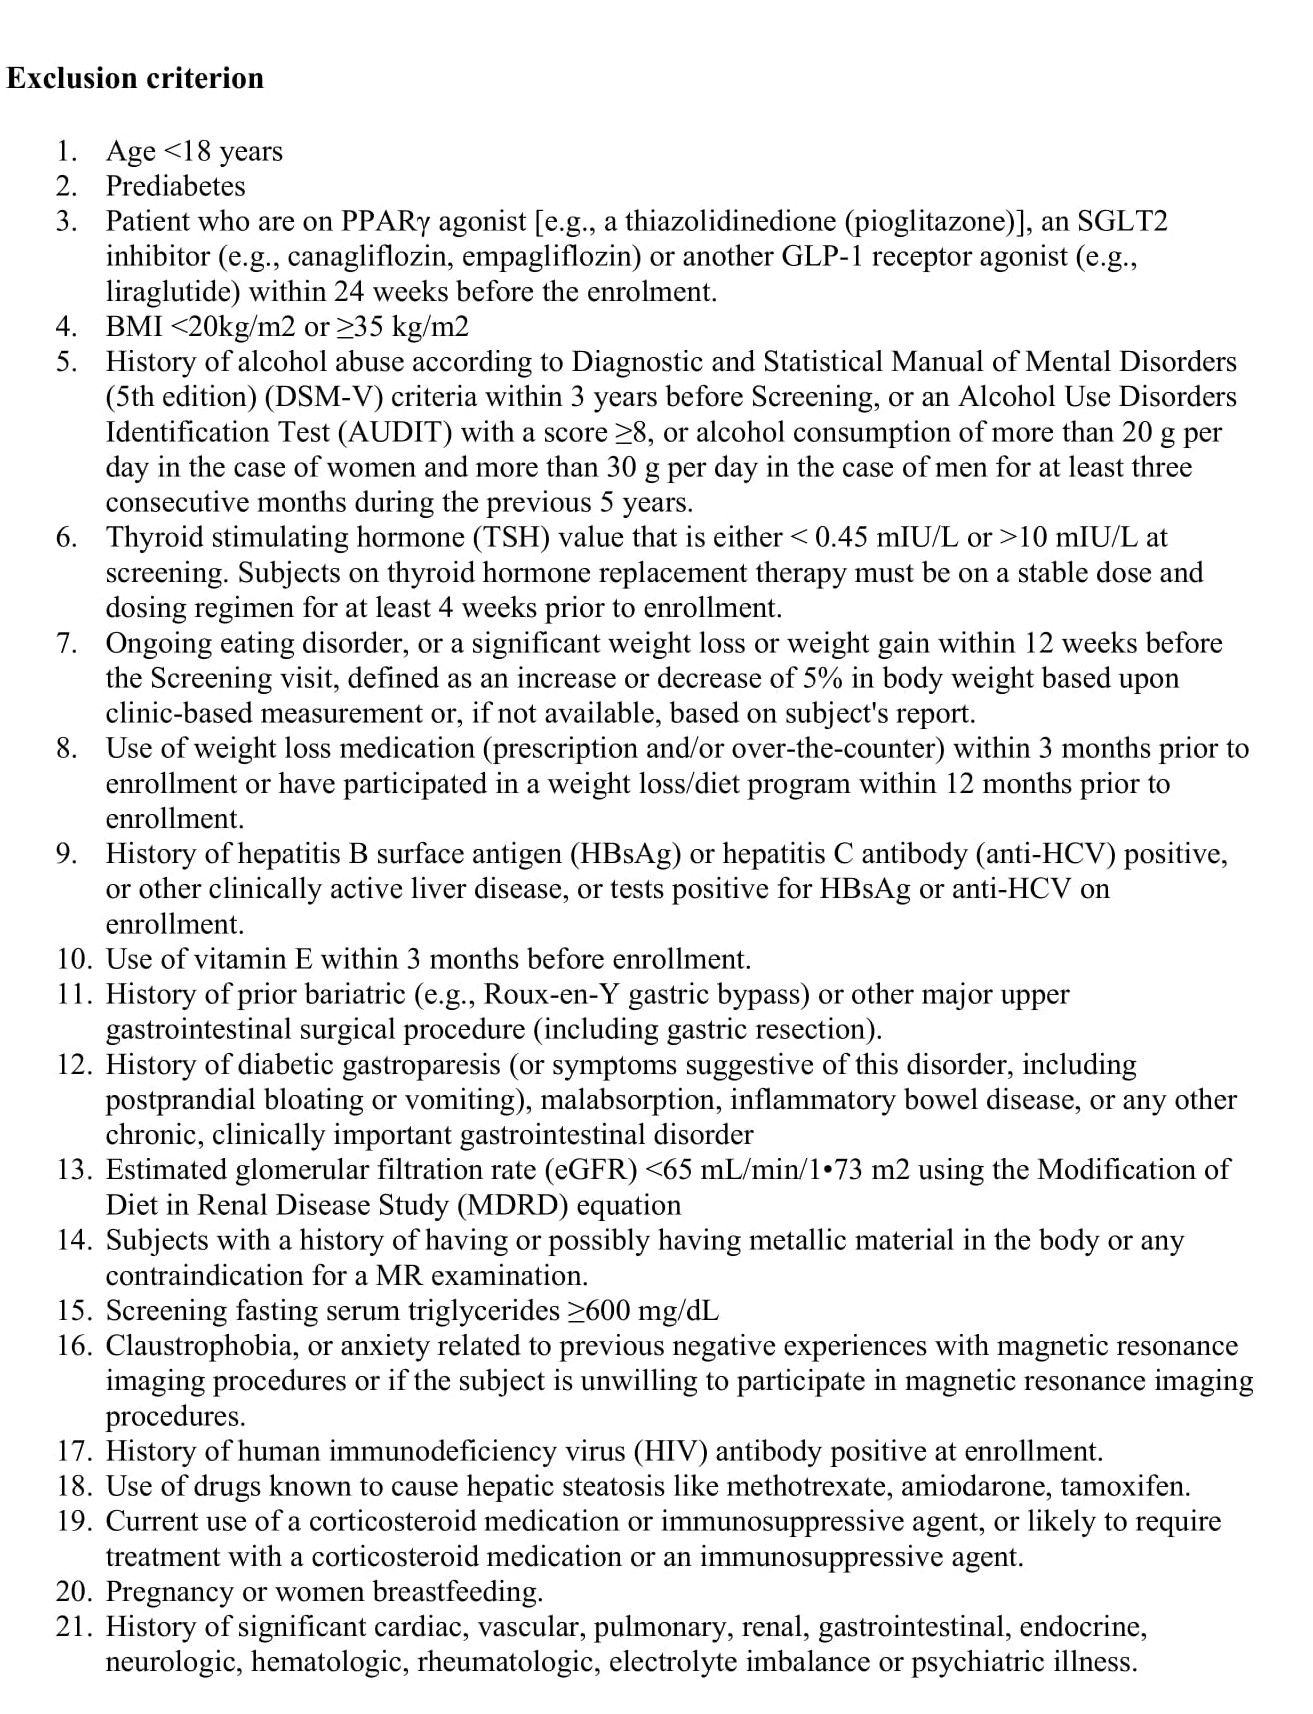
Table 1 showing exclusion criteria
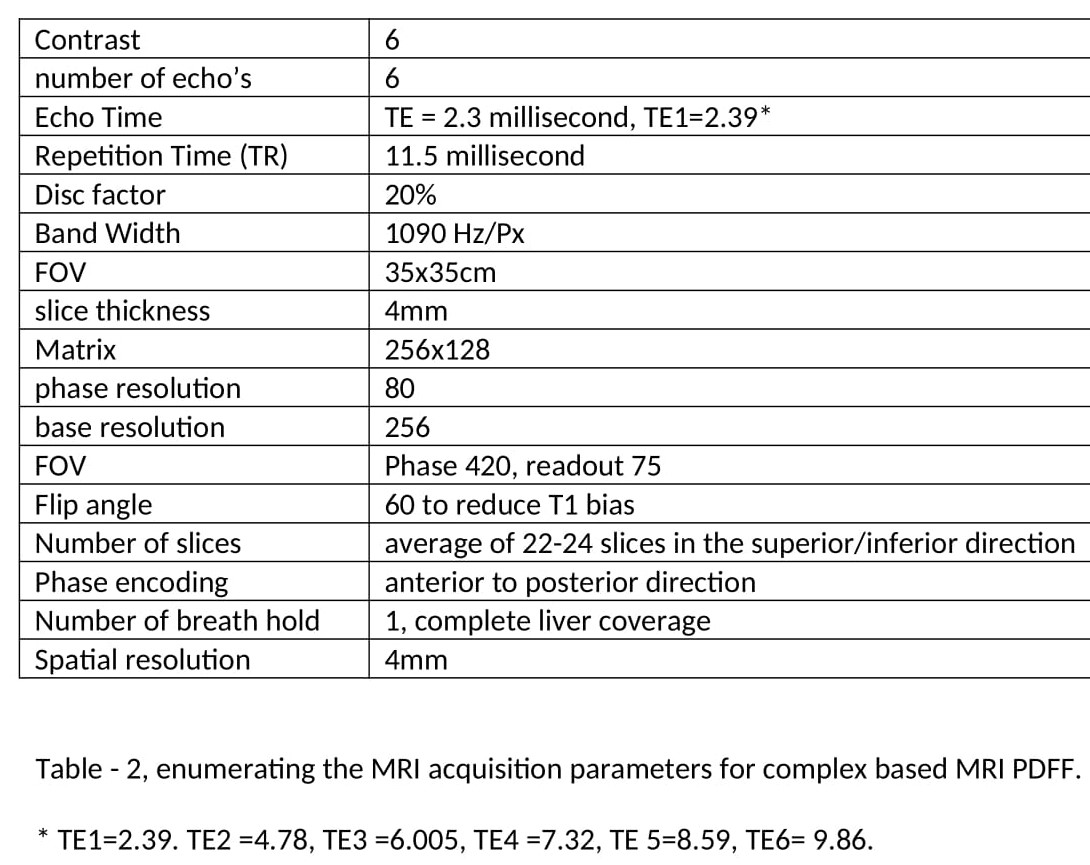
Table 2 showing MRI parameters
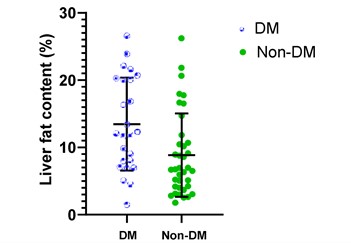
Figure 1: Comparison of LFC assessed by MRI PDFF values among DM and
Non-DM. The mean LFC in DM group was 12.1 % (8-20) vs
Non-DM 6.7% (4.2-10.7).
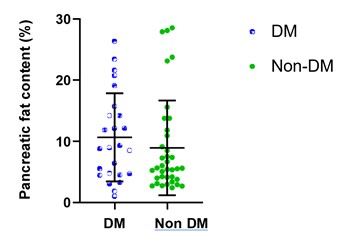
Figure 2: Comparison of PFC assessed by MRI PDFF values among DM and Non- DM. The mean PFC in NAFLD subjects was 7.5% and in
Non NAFLD was 6.5%.
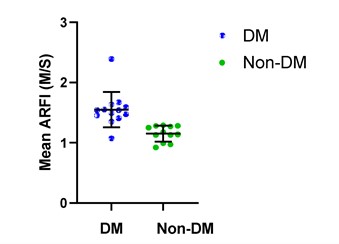
Figure 3: Comparison of ARFI values between DM and Non-DM group.71% had - mild to moderate fibrosis grading
among DM group.