0252
Deep learning based fully automatic analysis of gastric motility from contrasty-enhanced MRI1Biomedical Engineering, University of Michigan, Ann Arbor, MI, United States, 2Electrical Engineering and Computer Science, University of Michigan, Ann Arbor, MI, United States, 3Biomedical Engineering, Electrical Engineering and Computer Science, University of Michigan, Ann Arbor, MI, United States
Synopsis
Contrast-enhanced gastrointestinal MRI serves as a non-invasive tool for studying and assessing gastric functions. Previous studies generally have their home-brewed semi-automatic algorithm for assessing gastric motility. This process is time-consuming and susceptible to errors. Here, we used deep learning to establish a fully automatic pipeline for assessing gastric motility with contrast-enhanced gastrointestinal MRI in rats. We cross-validated our analysis against simultaneously recorded electrogastrogram indicating gastric myoelectrical activity. Results from this analysis are consistent with electrogastrogram in terms of time, frequency, and power, and in addition, shed light on more detailed spatial characteristics of gastric motility.
Purpose
Contrast-enhanced gastrointestinal (GI) MRI serves as a non-invasive tool for studying and assessing gastric functions. Previous studies generally have their home-brewed semi-automatic algorithm for assessing gastric motility [1]. This process is time-consuming and susceptible to errors. Here, we used deep learning to establish a fully automatic pipeline for assessing gastric motility with contrast-enhanced GI MRI in rats. We cross-validated our analysis against simultaneously recorded electrogastrogram (EGG) indicating gastric myoelectrical activity. Given the high spatial resolution of the GI MR images compared with EGG, our proposed pipeline could provide further spatial characteristics of the propagating contractile wave along the greater and lesser curvatures, which is potentially beneficial for gastric dysfunction diagnosis.Method
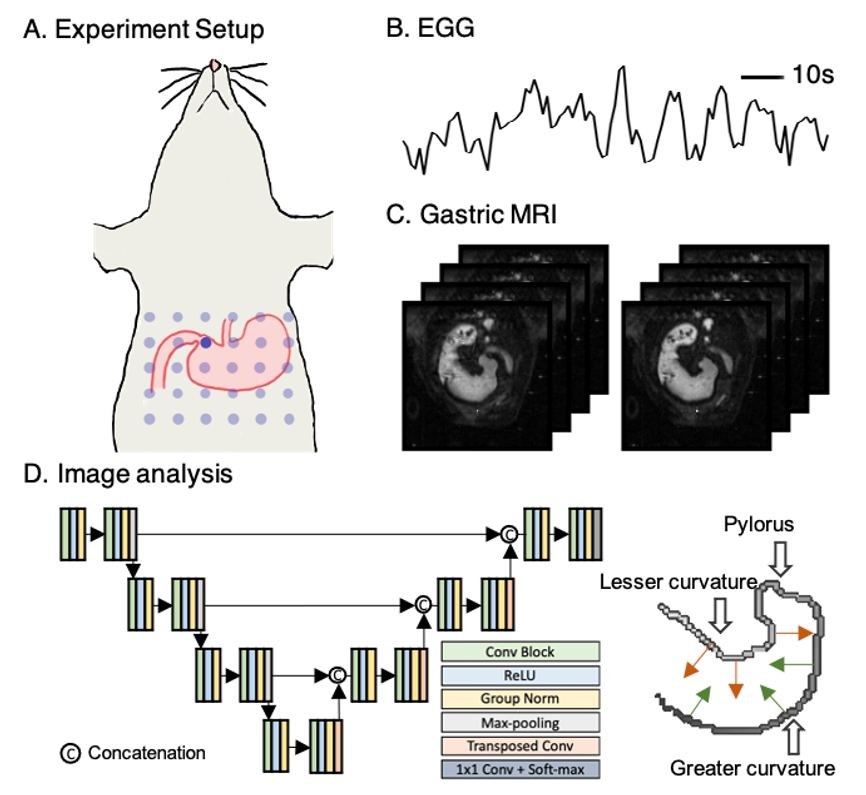
We performed simultaneous MRI acquisition and EGG recording (Fig. 1ABC) on six Sprague Dawley rats for six sessions each. The rat was trained for seven days before the experiment to consume diet gel voluntarily. On the day of the experiment, the rat was fed with 5 g Gd-DPTA labeled diet gel. It was then anesthetized with continuous dexmedetomidine (SC-infusion, 0.015 mg/Kg/h) and isoflurane (0.1-0.5% mixed in O2). We attached a 30-channel EGG electrode array on the rat’s abdominal skin surface (Fig. 1A) and recorded EGG signals using an electrophysiological recording system (Tucker Davis Technologies Inc.). Simultaneously, we scanned the rat’s abdominal region with a Fast Low Angle Shot gradient echo sequence (FLASH, TR/TE = 11.78/1.09 ms, FA = 25, 4 oblique slices covering the antrum and the corpus, slice thickness = 1.5 mm, FOV = 6060 mm2, in-plane resolution = 0.46 x 0.46 mm2) in a 7-Tesla small-animal MRI system (BioSpec 70/30, Brucker). We enabled the respiration gating to minimize the respiration induced motion artifacts.In the off-line analysis, for GI MR images, we developed an analysis pipeline (Fig. 1D). We used a 2D U-net [2] with additional group normalization layers to automatically segment images. We trained the 2D U-net using an independent MRI dataset acquired from 48 rats. The training images covered the entire stomach with 30 slices and had been manually labeled. We incorporated online data augmentation by randomly adjusting the intensity, contrast, and orientation of the MR images to further boost the number of training samples. We then applied the trained network directly without any fine-tuning to segment the newly acquired GI MR images. We applied minor post-processing to further improve segmentation accuracy. Given the extracted stomach labels from the MR images, we estimated the time-evolving displacement of the stomach contour perpendicular to the long axis as a measure of gastric motility along the greater (displacements shown in green arrows in Fig. 1D) or lesser curvature (displacements shown in red arrows in Fig. 1D) of the stomach.
To evaluate our method, we compared the frequency and power of the estimated displacements with corresponding EGG features within and across animals. For comparing power, we extracted the temporal fluctuations of the power from the estimated displacements and EGG using wavelet analysis. The mutual information matrix was calculated to confirm the correspondence between the two. We further derived additional spatial features of the gastric motility unique to MRI, by analyzing the space-evolving displacements along the greater and lesser curvatures. We estimated the propagating peristaltic wavelength using spatial frequency analysis. The dominant spatial frequency was identified across all time points as the peristaltic wavelength. We also characterized the propagation velocity of the peristaltic pattern by tracking the time spent for each peristaltic wave propagating from the proximal corpus to the pyloric sphincter.
Results
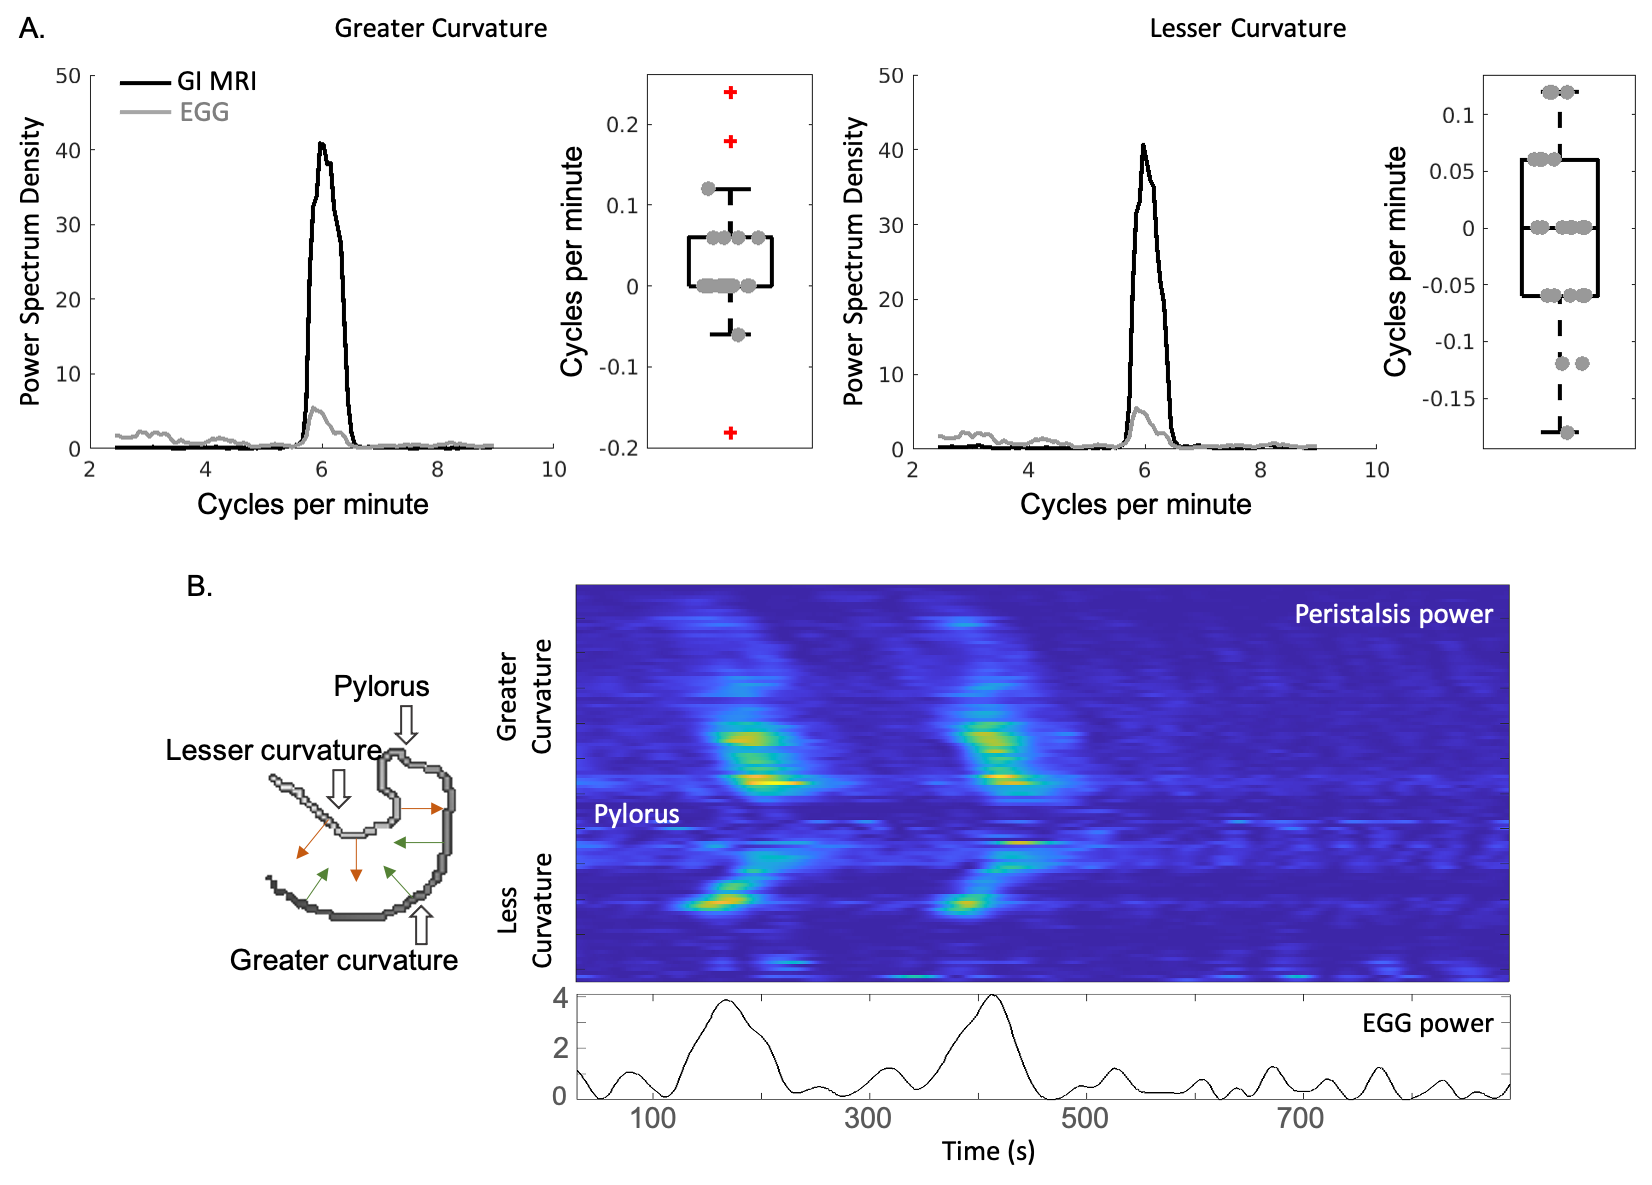
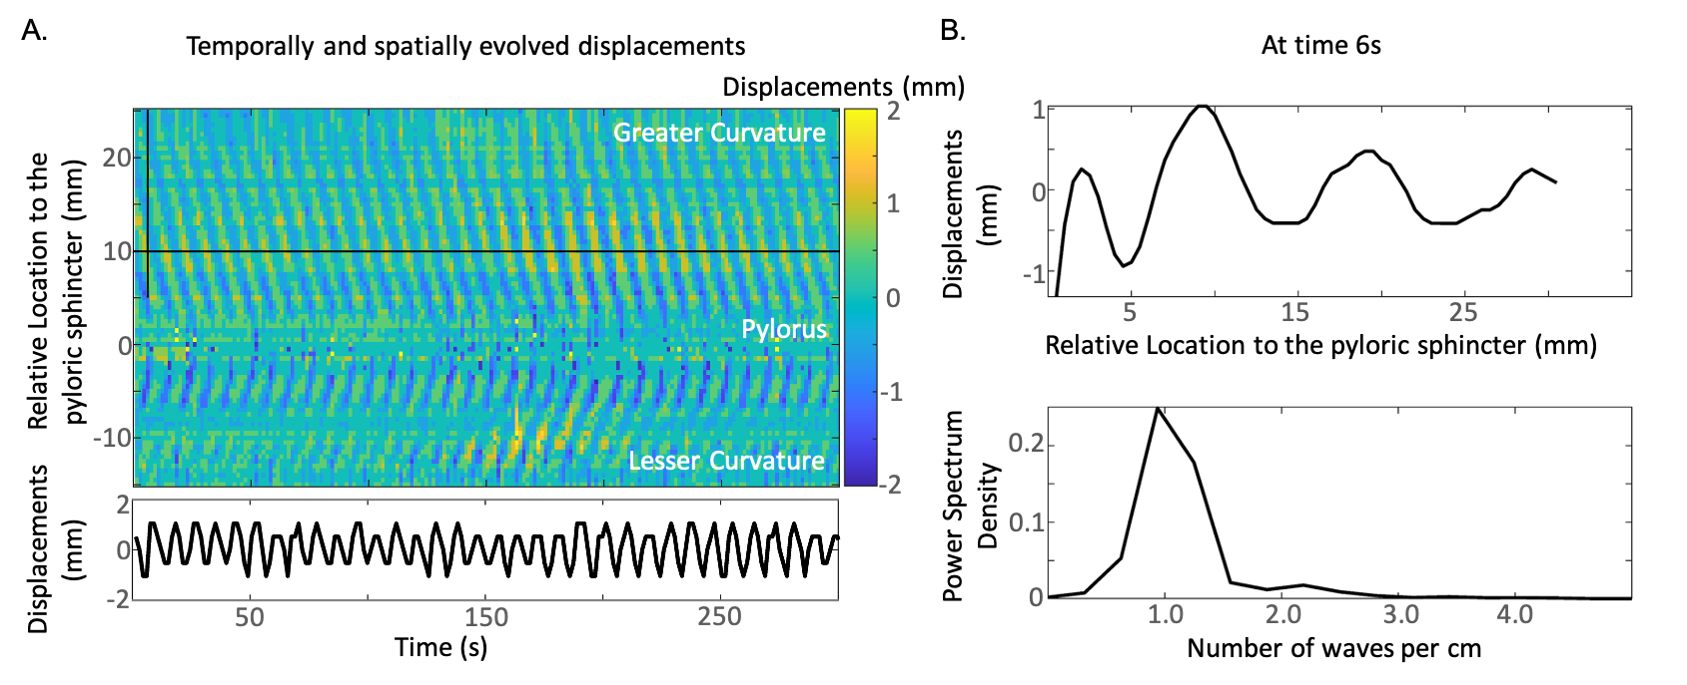
We segmented the stomach from GI MR images using the neural network, as described in the method section. By visual inspection, the accurate segmentation enables multiple secondary analyses. First, we extracted frequency and power from the pre-processed EGG and estimated displacements to validate their correspondence along the greater and lesser curvatures. The difference of dominant frequencies between EGG and peristaltic displacements was 0.0235 ± 0.0804 Cycles/minute (CPM) along the greater curvature, and -0.0052 ± 0.0787 CPM along the lesser curvature (Fig. 2A), suggesting a strong correspondence. We then targeted on the frequency within the range of 4-7 CPM and checked the time-evolving power. We got high mutual information between the power of the narrow-band EGG and of displacements estimated from MRI (Fig. 2B, z-score 0.633 ± 0.081 along the greater curvature and z-score 0.569 ± 0.068 along the lesser curvature). The analyses for frequency and power confirmed the reliability of our proposed analysis pipeline in assessing gastric motility. In addition, we identified a spatially propagating sinusoid-like peristaltic pattern along the greater and lesser curvatures from the estimated displacements (Fig. 3B). Using the spatial frequency analysis, we estimated the peristaltic wavelength as about 1.12 ± 0.40 cm along the greater curvature and 1.00 ±0.36 cm along the lesser curvature. The estimated propagation velocity of the peristalsis wave fell in the range of 1.1-1.3 mm/s along the greater and lesser curvatures.Conclusions
We have established a deep learning-based pipeline for fully automatic analysis of GI MRI to characterize gastric motility. Results from this analysis are consistent with EGG in terms of time, frequency, and power, and in addition, shed light on more detailed spatial characteristics of gastric motility.Acknowledgements
References
[1] Lu, K.-H., Cao, J., Oleson, S., Powley, T. L., & Liu, Z. Contrast-Enhanced Magnetic Resonance Imaging of Gastric Emptying and Motility in Rats. IEEE Transactions on Biomedical Engineering, 2017, 64(11), 2546–2554.
[2] Ronneberger, O., Fischer, P., & Brox, T. U-net: Convolutional networks for biomedical image segmentation. Lecture Notes in Computer Science, 2015, 9351, 234–241.
Figures