0251
Phase synchronization of resting-state brain networks with the intrinsic electrical rhythm of the stomach1F.M. Kirby Research Center for Functional Brain Imaging, Kennedy Krieger Institute, Baltimore, MD, United States, 2International Center for Spinal Cord Injury, Kennedy Krieger Institute, Baltimore, MD, United States, 3Department of Radiology, Johns Hopkins Medicine, Baltimore, MD, United States, 4Department of Biostatistics, Johns Hopkins Bloomberg School of Public Health, Baltimore, MD, United States, 5Department of Psychiatry and Behavioral Sciences, Johns Hopkins Medicine, Baltimore, MD, United States, 6Department of Electrical and Computer Engineering, Johns Hopkins University, Baltimore, MD, United States
Synopsis
Combining concurrent cutaneous electrogastrography (EGG) with resting-state fMRI (rsfMRI), we estimated resting-state brain networks from the rsfMRI data using independent component analysis, then used the amplitude-weighted Phase-Locking Value to assess whether those networks were synchronized with the intrinsic gastric rhythm estimated from the EGG data. We found 18 resting-state brain networks, of which 11 were found to be partially but significantly phase synchronized with the gastric rhythm. Disruptions to the gut-brain axis are thought to be involved in various disorders; manifestation of the infra-slow rhythm of the stomach in brain rsfMRI data could be useful for studies in clinical populations.
Introduction
We recently combined concurrent cutaneous electrogastrography (EGG) with resting-state fMRI (rsfMRI), in a highly-sampled individual experimental design, and found that three resting-state brain networks were phase-locked with the gastric basal electrical rhythm 1. The present contribution is a re-analysis of those data using the amplitude-weighted Phase-Locking Value (awPLV), a measure introduced by Kovach 2 in order to address shortcomings of the Phase-Locking Value (PLV) 3,4. Using awPLV, we find that a majority of resting-state brain networks were significantly synchronized with the intrinsic rhythm of the stomach.Methods
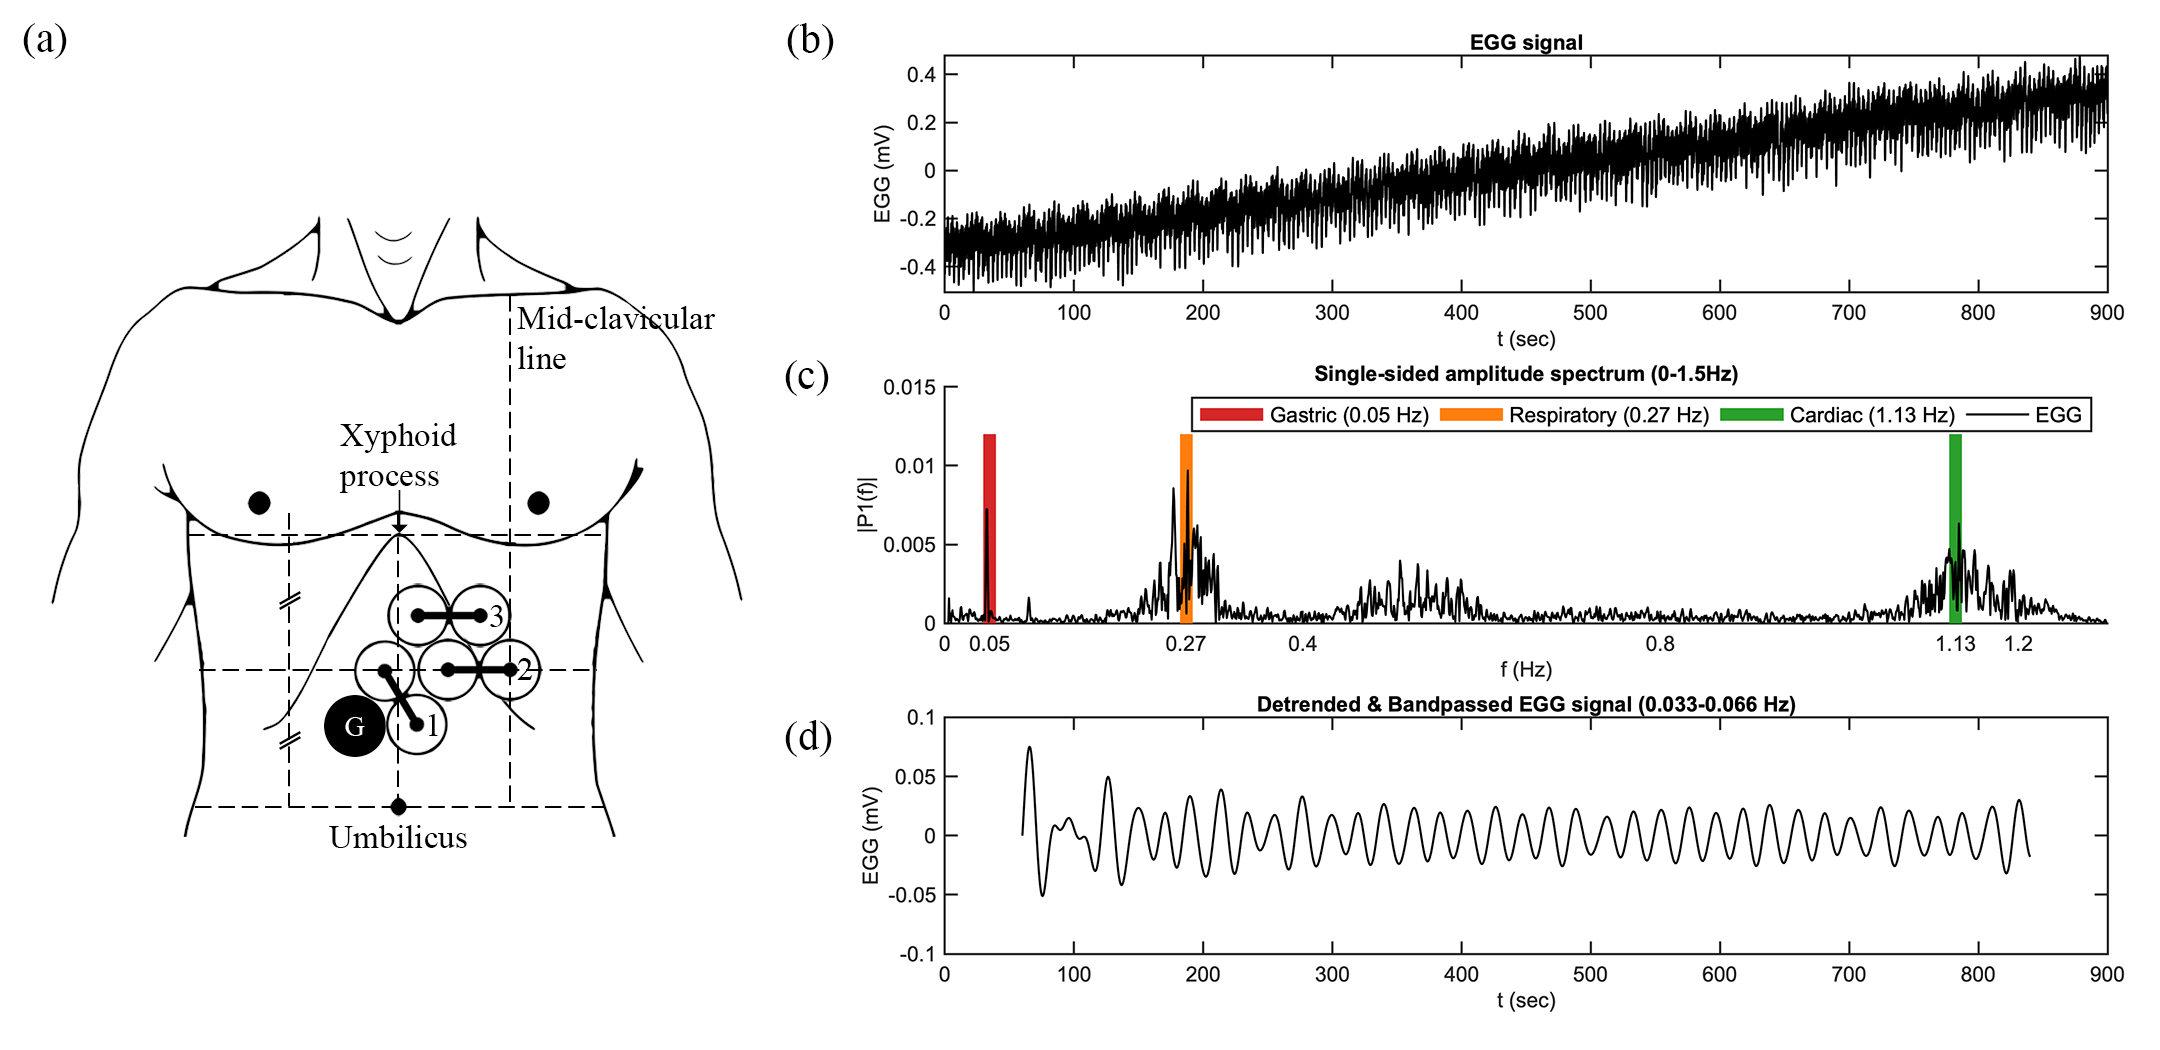
As described previously 1, an individual participant underwent 22 scanning sessions at 3.0 Tesla. In each session, two 15-minute runs of concurrent EGG and rsfMRI data were acquired; the participant remained in the scanner between runs. MRI was performed using a 3 Tesla Philips dStream Ingenia Elition scanner. A multi-slice SENSE-EPI pulse sequence was used for rsfMRI. The gastric rhythm was monitored using MRI compatible EGG equipment (BIOPAC MP160 system; BIOPAC Systems Inc, USA). Placement of cutaneous electrodes and representative data are shown in Figure 1; detailed methods may be found in our prior report 1. EGG data from three sessions had weak gastric signals and were excluded; the other 19 sessions yielded a total of 9.5 hours of data. The rsfMRI data were analyzed using group ICA 5; RSN time courses were estimated for each run 6. EGG data were preprocessed as described previously 1; data from the EGG channel with the highest gastric spectral power were bandpass filtered to isolate the signal related to the gastric basal rhythm.To estimate phase synchronization between the gastric and RSN time courses (filtered using the same bandpass filter as the EGG data), the Hilbert transform was used to estimate the analytic phase of each signal, and, for each run, awPLV was computed between EGG and RSN time courses. The awPLV is defined 2 as: $$awPLV_{xy}=|\sum_{t=1}^Tw(t)e^{i\triangle\phi_{xy}(t)}|$$ Where the phase difference is $$$\triangle \phi_{xy}(t)=\phi_{x}(t)-\phi_{y}(t)$$$ and the weights are given in terms of the signal envelope amplitudes: $$w(t)=\frac{A_{x}(t)A_{y}(t)}{\sum_{\tau=1}^T A_{x}(\tau)A_{y}(\tau)}$$ In order to assess statistical significance, for each RSN, awPLV was calculated for all pairs of “mismatched” data (EGG and rsfMRI data acquired on different days), to generate a null distribution of gastric/brain synchronization. We then tested whether, for each RSN, empirical awPLV differed from chance-level awPLV, using a Wilcoxon rank test. To correct for multiple comparisons, the p-values for the 18 RSNs were adjusted using the Benjamini-Hochburg procedure with a false discovery rate (FDR) of 0.05, in order to judge whether RSNs were significantly phase synchronized with the gastric rhythm.
Results
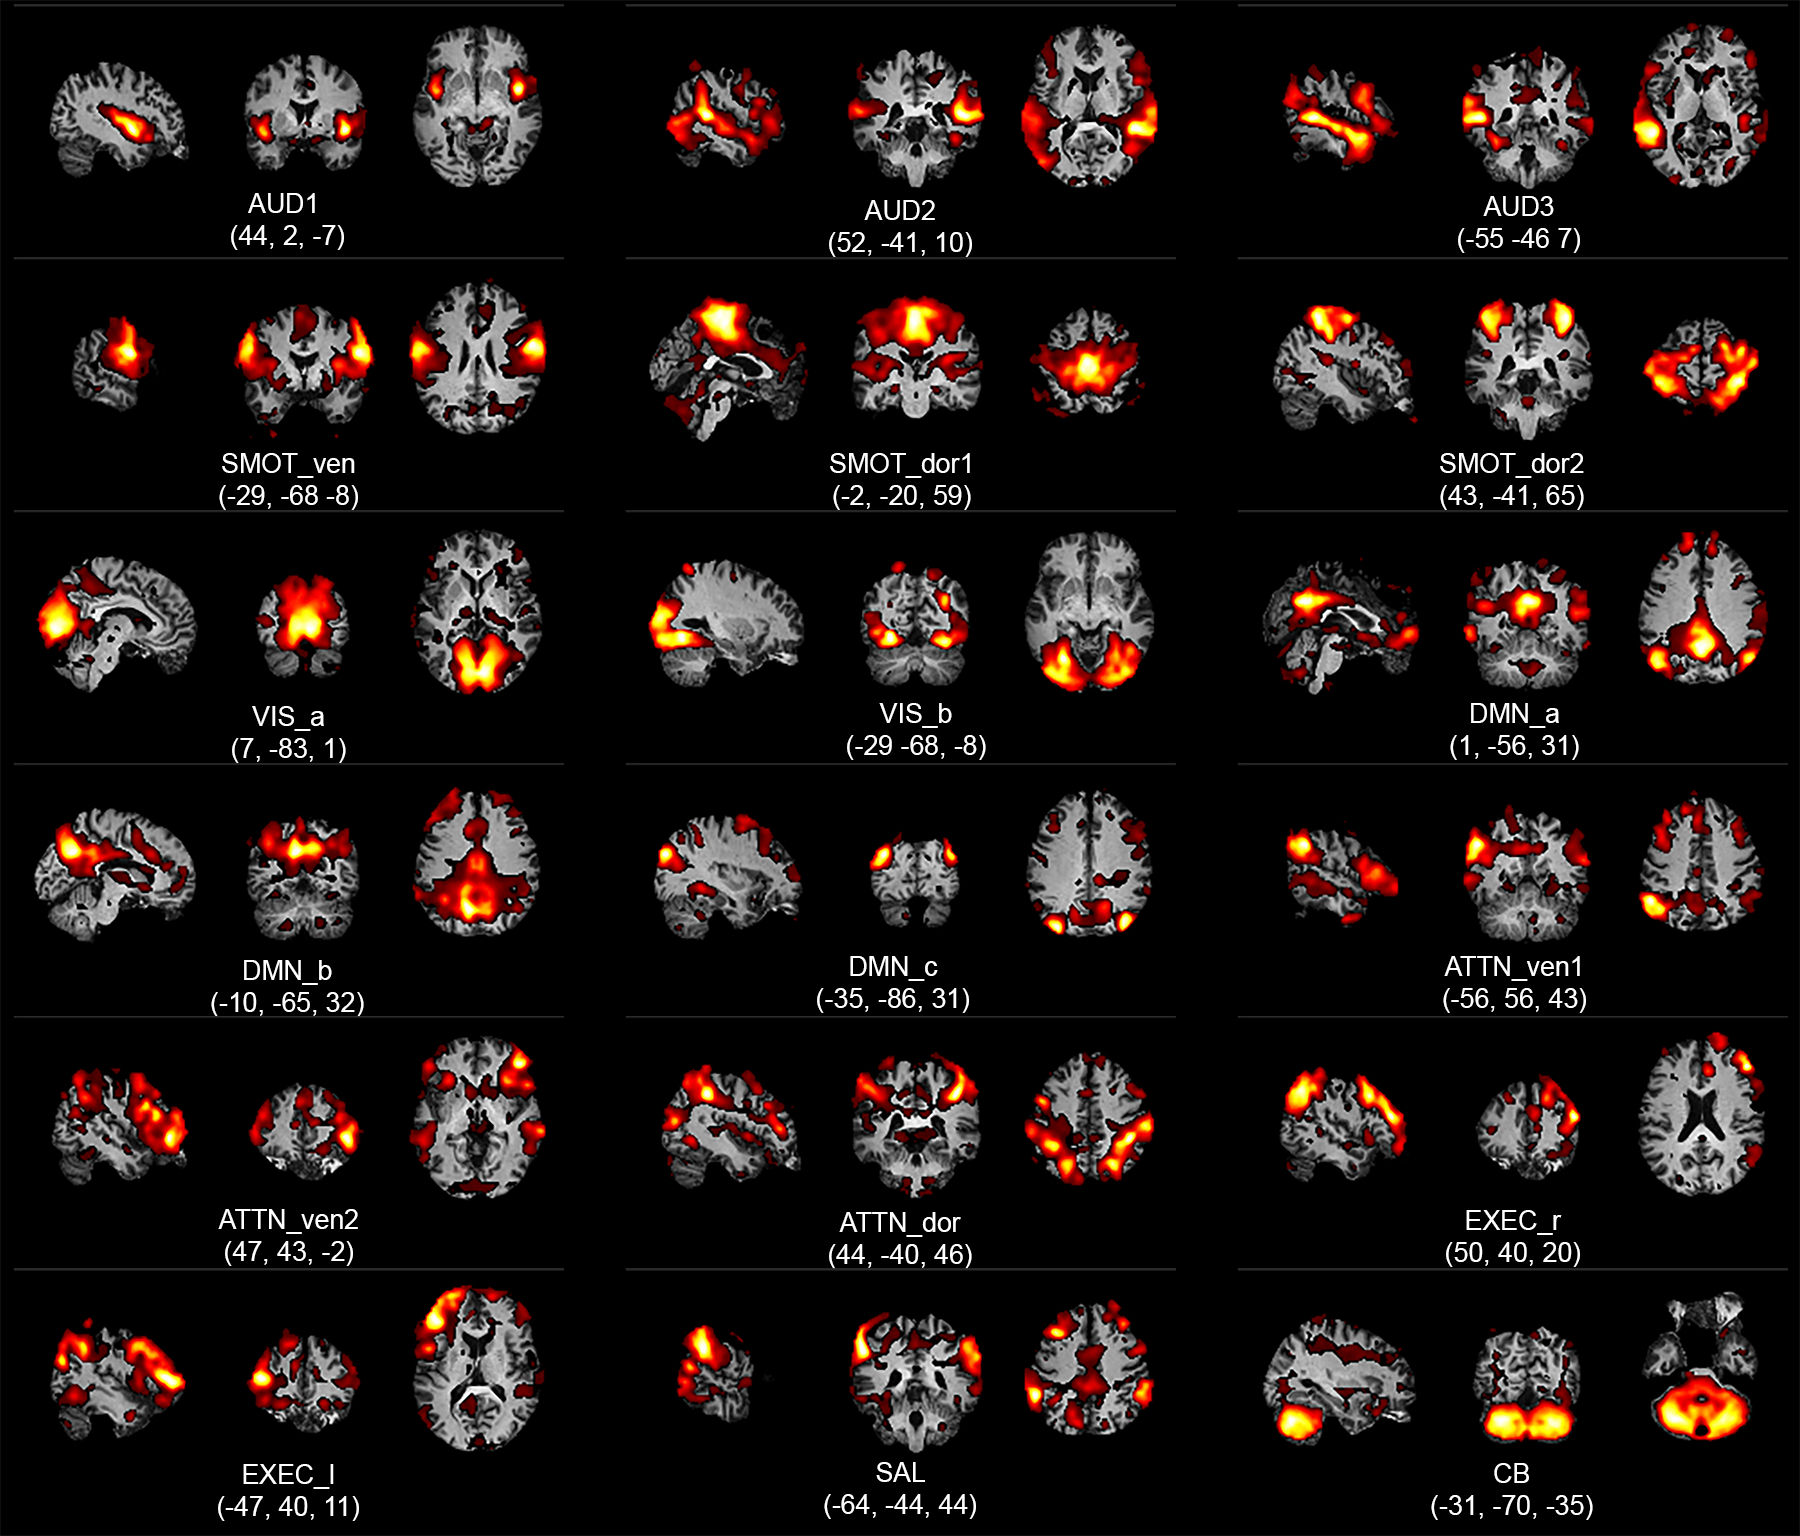
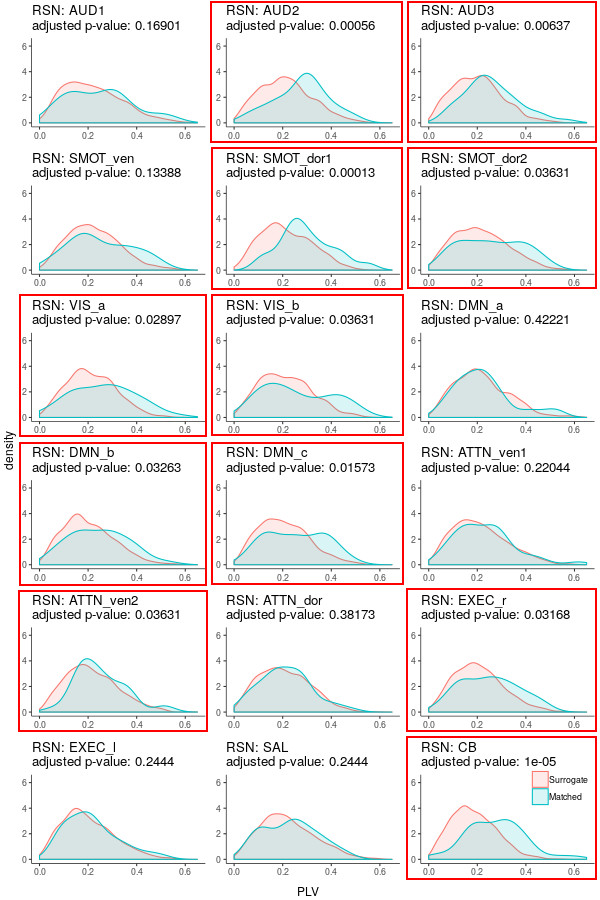
Group ICA yielded 18 RSNs, as described in our prior report 1 and shown in Figure 2. The subject’s gastric rhythm was normogastric, at 0.048 ± 0.001 Hz. Using FDR-corrected Wilcoxon rank tests, 11 of the 18 RSNs were found to be phase synchronized with the gastric basal electrical rhythm, as shown in Figure 3.Discussion
In their pioneering study, Rebollo, et al., used concurrent EGG and rsfMRI and found that twelve brain regions had activity that was significantly phase-locked with the gastric rhythm 7. So, we asked whether any brain networks estimated using the well-established ICA approach might be synchronized with the infra-slow rhythm of the stomach. To address that question, we used a highly-sampled individual study design 8,9. Accordingly, a major limitation of this work is that it reports on data acquired in just one research participant, and so further study is needed to ascertain whether the results reported herein are typical.The awPLV was introduced by Kovach 2 to address limitations of the PLV measure 3,4. The rationale is that when averaging phase-locking over a run, contributions from each time point should be weighted so as to reduce contributions from times when the signal envelope amplitude is small, and the signal-to noise of the phase estimate is therefore low. In the present contribution, using awPLV, 11 brain networks, which constitute a majority of the 18 networks estimated from the rsfMRI data, were found to be phase-synchronized with the gastric rhythm. These results imply communication between the enteric nervous system and several brain circuits not typically considered responsive to gastric state. Future work will interrogate hunger and satiety in healthy and disease states to probe these interactions and yield insight into their function.
A limitation of this study is that such data cannot be used to infer directionality or causality. Simply from EGG and rsfMRI data alone, we cannot tell whether the stomach is driving the brain, or whether the brain is driving the stomach. However, the role of myenteric interstitial cells of Cajal as the intrinsic generators or “pacemakers” of the gastric rhythm appears firmly established 10-13. Further discussion of the bidirectional relationship between the gastric rhythm and brain activity may be found in our prior report 1.
Conclusion
Combining concurrent cutaneous electrogastrography (EGG) with resting-state fMRI in a highly-sampled individual experimental design, the amplitude-weighted Phase-Locking Value was used to assess phase synchronization between the gastric basal electrical rhythm and brain networks estimated using ICA. A majority of resting-state brain networks were found to be partially but significantly synchronized with the intrinsic rhythm of the stomach.Acknowledgements
Support for this study was provided by the USA National Institutes of Health, under grants NIH 5R21NS104644-02 (A.S.C.); NIH R01EB016061 (M.A.L.); NIH 1R21EB030009-01 (J.J.P.); NIH 1P50HD103538-01 (B.L. Schlaggar); NIH 5P41EB015909-19 (P.C.M. van Zijl); NIH 1S10OD021648 (P.C.M. van Zijl). The funders had no role in study design, data collection and analysis, decision to publish, or preparation of this report.References
1. Choe AS, Tang B, Smith KR, et al. Phase-locking of resting-state brain networks with the gastric basal electrical rhythm. BioRxiv, 2020; <https://doi.org/10.1101/2020.10.06.328054>.
2. Kovach, CK. A biased look at phase locking: Brief critical review and proposed remedy. IEEE Transactions on Signal Processing, 2017;65(17):4468-80.
3. Lachaux JP, Rodriguez E, Martinerie J, Varela FJ. Measuring phase synchrony in brain signals. Human Brain Mapping, 1999;8(4):194–208.
4. Aydore S, Pantazis D, and Leahy RM. A note on the phase locking value and its properties. Neuroimage, 2013;74:231–44.
5. Calhoun VD, Adali T, Pearlson GD, Pekar JJ. A method for making group inferences from functional MRI data using independent component analysis. Human Brain Mapping, 2001;14(3):140-51.
6. Erhardt DB, Rachakonda S, Bedrick EJ, et al. Comparison of multi‐subject ICA methods for analysis of fMRI data. Human Brain Mapping, 2011;32(12): 2075–95.
7. Rebollo I, Devauchelle AD, Beranger B, Tallon-Baudry C. Stomach-brain synchrony reveals a novel, delayed-connectivity resting-state network in humans. Elife, 2018;7:e33321.
8. Laumann TO, Gordon EM, Adeyemo B, et al. Functional system and areal organization of a highly sampled individual human brain. Neuron, 2015;87(3):657–70.
9. Choe AS, Jones CK, Joel SE, et al. Reproducibility and temporal structure in weekly resting-state fmri over a period of 3.5 years. PLoS One, 2015;10(10):e0140134.
10. Bozler E. The action potentials of the stomach. American Journal of Physiology, 1945;144(5):693–700.
11. Suzuki N, Prosser CL, Dahms V. Boundary cells between longitudinal and circular layers: essential for electrical slow waves in cat intestine. American Journal of Physiology, 1985;250(3 Pt 1):G287–94.
12. Sanders KM, Koh SD, Ward SM. Interstitial cells of Cajal as pacemakers in the gastrointestinal tract. Annual Review of Physiology, 2006;68:307–43.
13. Huizinga JD. Physiology of the Gastrointestinal Tract (sixth edition), book chapter: The physiology and pathophysiology of interstitial cells of Cajal: Pace-making, innervation, and stretch sensation. Academic Press, 2018;305-35
Figures