0246
Evaluation of an Iron-Oxide Nanoparticle Contrast Agent for Vascular Suppression in Magnetic Resonance Neurography1Radiology and Imaging, Hospital for Special Surgery, New York, NY, United States, 2Weill Cornell Medicine, New York, NY, United States
Synopsis
In this study, we investigated the use of ferumoxytol, an iron-oxide nanoparticle, for vascular signal suppression in 3 Tesla magnetic resonance neurography of the brachial plexus. A 3D, T2-weighted STIR sequence was prospectively acquired of 19 normal brachial plexi in 10 volunteers (1 unilateral; 9 bilateral) before and after ferumoxytol infusion. Independent assessment of anonymized exams by two radiologists demonstrated overall improved vascular suppression as well as improved visualization of the suprascapular nerve with increased diagnostic confidence. Improvements in nerve-, fat-, and blood-to-muscle contrast were supported by signal simulations.
Introduction
Magnetic resonance neurography (MRN) can be challenging to interpret due to the presence of confounding blood vessels that run alongside and have comparable relaxation parameters to small-caliber (<1mm diameter) nerves. Non-contrast vascular suppression sequences, including those employing a motion-sensitive driven equilibrium technique, are ineffective in suppressing signal from small, slow-flowing veins.1-7 Intravenous gadolinium may effectively suppress blood signal due to its high transverse relaxation rate (r2), but concerns around possible gadolinium deposition remain.3,8 Ferumoxytol (Feraheme®, AMAG Pharmaceuticals), an iron oxide agent administered intravenously for the treatment of anemia, has been shown to suppress slow-flow venous signal in MR lymphangiography but has not been evaluated for MRN. Furthermore, the closer ratio of transverse-to-longitudinal relaxivity (r2:r1) of ferumoxytol relative to gadolinium agents may be advantageous in suppressing vascular signal in T2-weighted MRN.9-10 This study’s aim was to evaluate the efficacy of ferumoxytol for brachial plexus MRN. We hypothesized ferumoxytol would provide improved vascular suppression and image quality, including nerve-to-background contrast ratios, compared to gadolinium assessed via simulations and compared to non-contrast techniques in vivo.Methods
This study was approved by our institutional review board. Written informed consent was obtained from all participants.Signal Simulations:
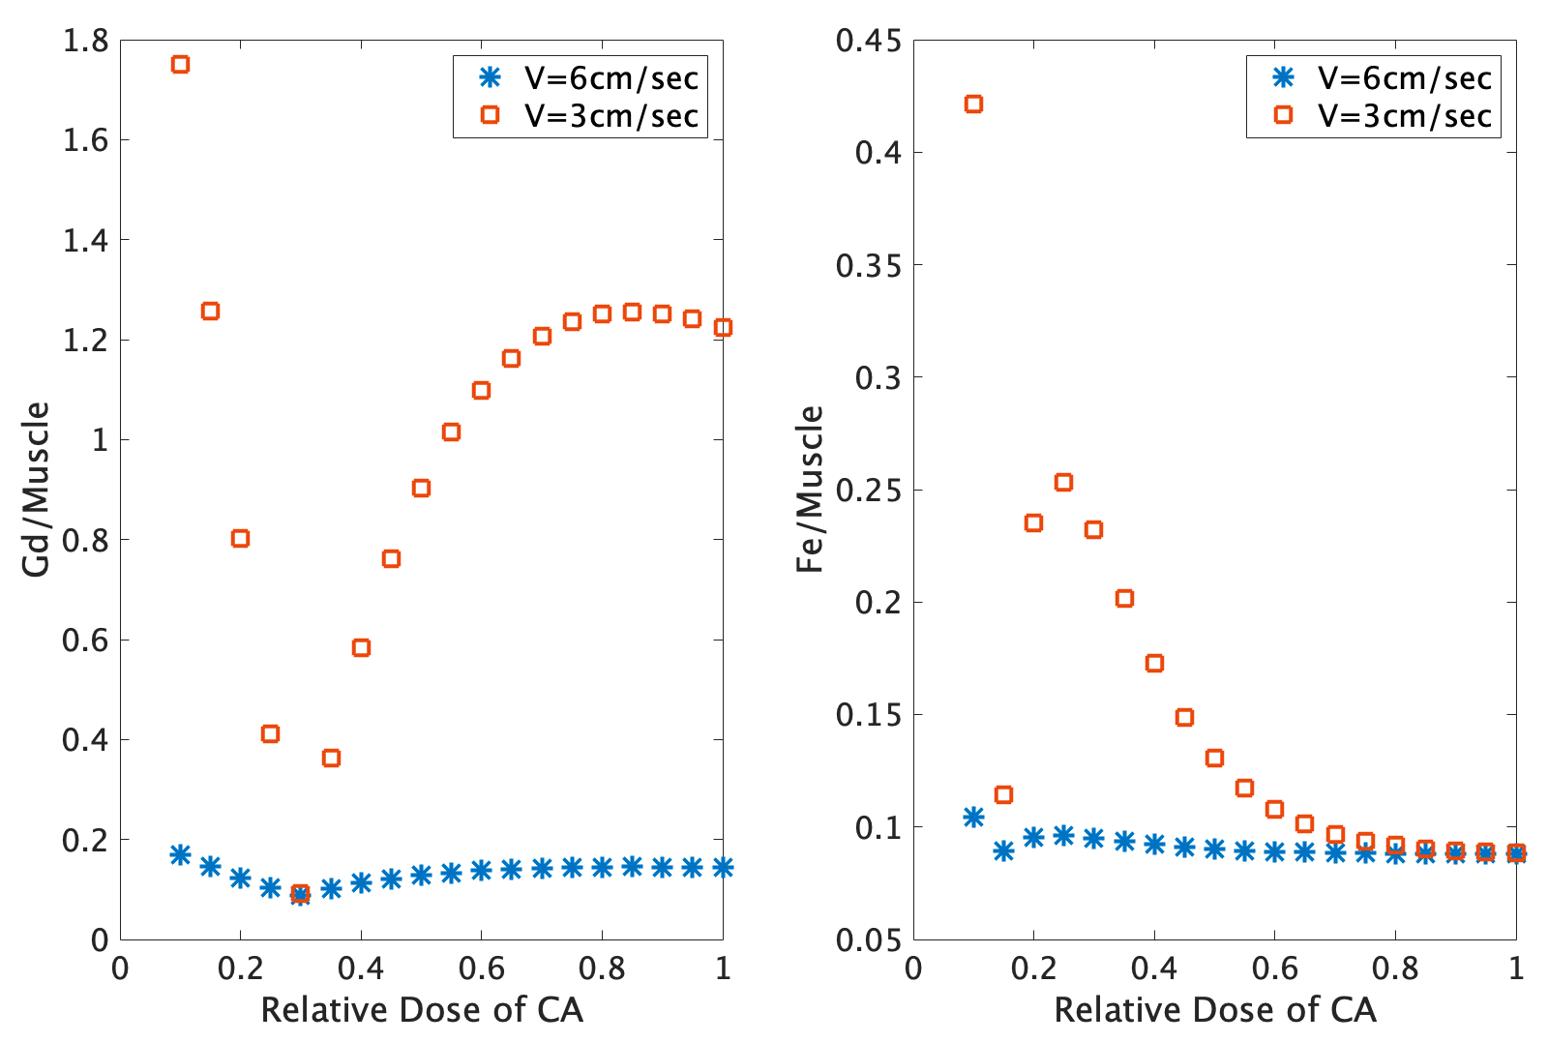
Signal simulations were performed to determine the effects of ferumoxytol dosage on nerve-, fat- and blood-to-muscle contrast. Vessel signals were computed without and with infusion assuming a steady-state concentration between 20% to 100% of the single-dose of ferumoxytol and a gadolinium-based agent (Gadovist™, 0.1 ml/kg) for comparison, using published relaxivity values at 3T.9-10
In Vivo Imaging:
Ten volunteers (10F; mean age 41 years, range 20-51) with chronic anemia who routinely received ferumoxytol infusions at a nearby clinic were prospectively enrolled from March-December 2019. Patients were excluded who received previous ferumoxytol therapy within 3 weeks of participation or had history of peripheral neuropathy. Each patient was imaged before and within 2 hours following ferumoxytol infusion (510 mg iron in 200 mg normal saline), giving 19 total brachial plexus exams (10 right/9 left). 3D STIR-T2w-FSE sequences were obtained at 3T using a combination of two 16-channel flexible coils (Neocoil LLC) or 32 elements of a 64-channel bilateral coil.11
Two musculoskeletal radiologists, blinded to technique, qualitatively evaluated sequences at random on a PACS workstation (Sectra IDS7) for 1) degree of vascular signal suppression, 2) visualization of proximal and distal segments of the suprascapular, axillary, and long thoracic nerves, and 3) diagnostic confidence in evaluating each segment. Fat-, muscle- and vessel-to-nerve contrast-to-noise ratios (CNR) were calculated using manually drawn regions of interest.
Statistical Analysis:
Median post-pre score differences (Δ) were estimated. Pre and post qualitative assessments and quantitative normalized CNRs were compared using an exact Wilcoxon signed-rank test and paired t-test, respectively. Inter-observer agreements were evaluated using Gwet’s agreement coefficient.
Results
Signal Simulations:At full contrast-agent dose, longitudinal relaxation times (T1) for blood were decreased by gadolinium and ferumoxytol from 1400 ms to 140 ms and 70 ms, respectively. The respective T2 for blood decreased from 250 ms to 74 ms and 10 ms, respectively. At a slow-flow velocity of 3 cm/s, ferumoxytol-infused blood had higher signal intensity than gadolinium-infused blood at a 30% relative dose (Figure 1).
In Vivo Imaging:
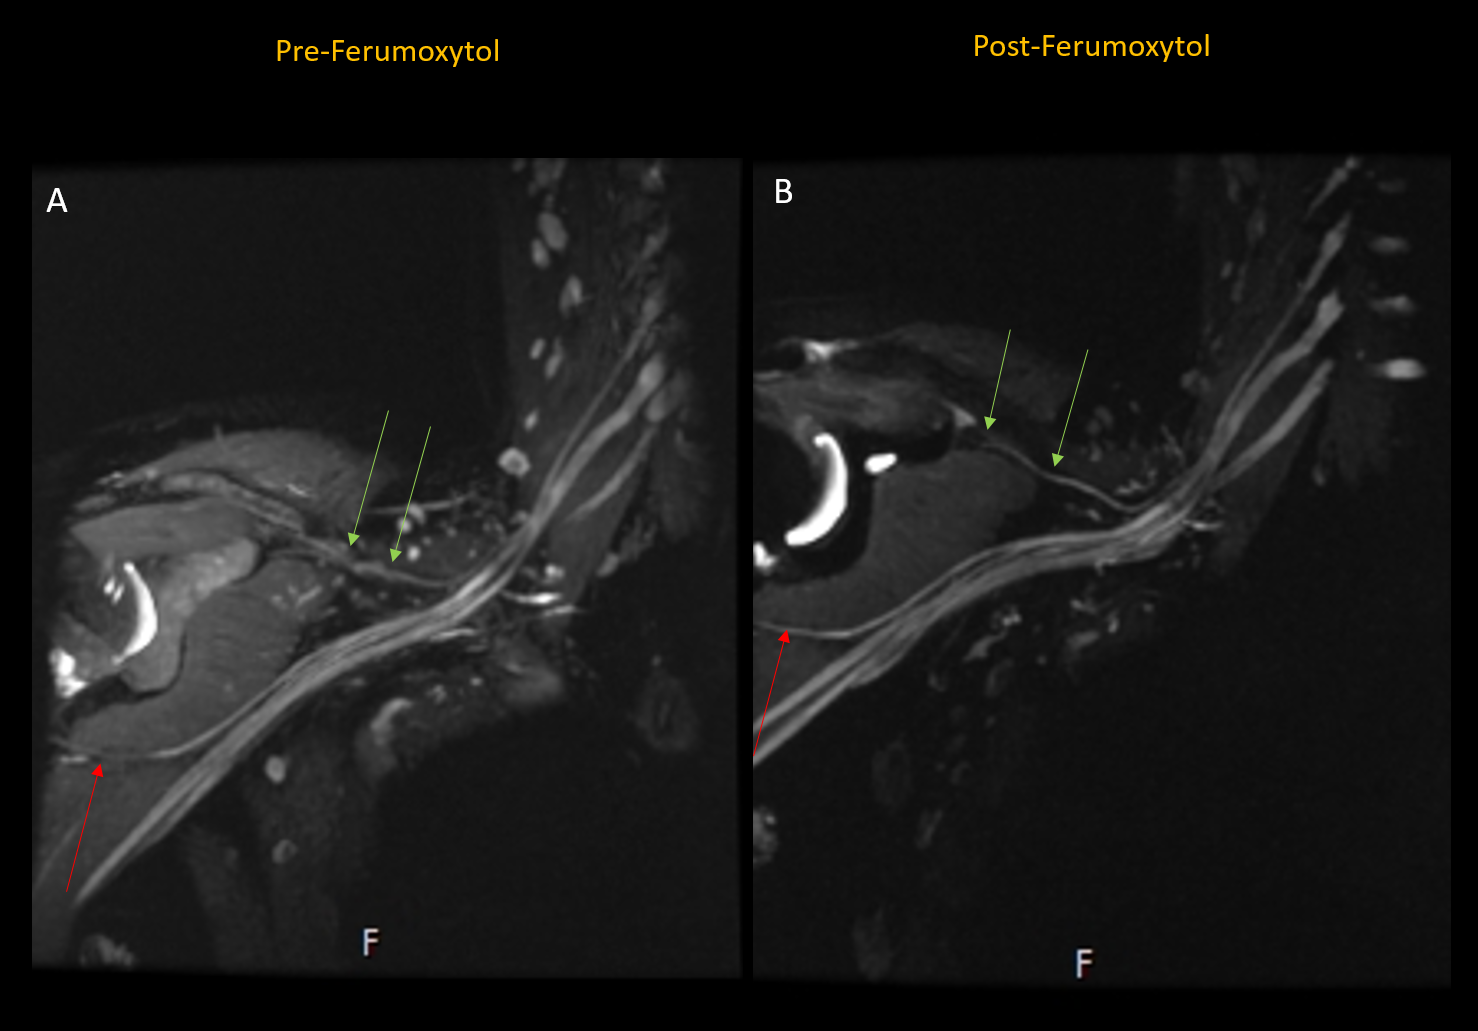
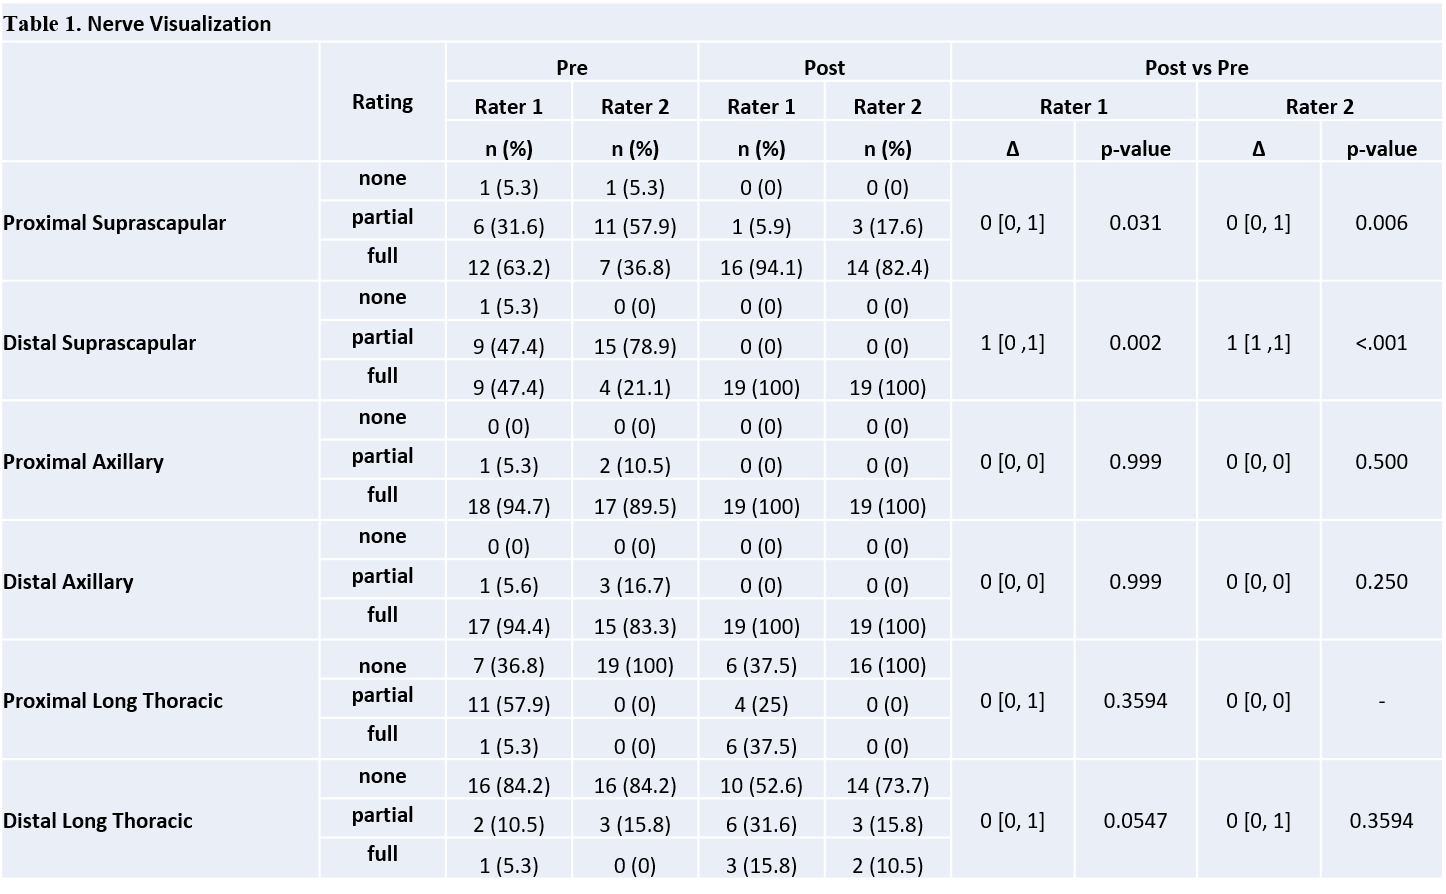
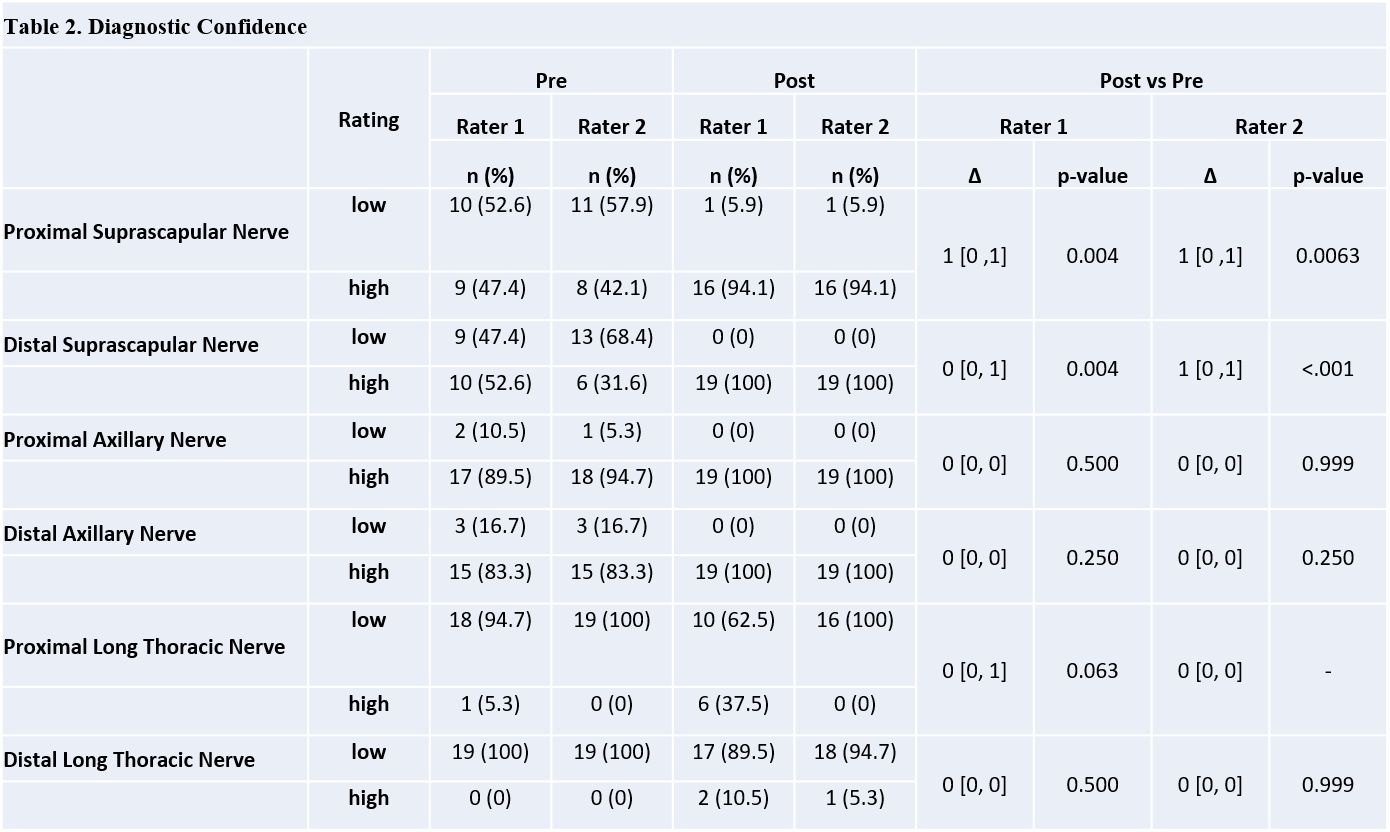
Vascular signal suppression improved following ferumoxytol administration (Rater 1 Δ=1, p<.001/Rater 2 Δ=2, p<.001) (Figure 2). The post-ferumoxytol STIR technique significantly improved nerve visualization for both raters (Rater 1 Δ=0, p=0.031/Rater 2 Δ=0, p=0.006) and distal suprascapular nerve diagnostic confidence for Rater 2 (Rater 1 Δ=0, p=0.004/Rater 2 Δ=1, p<0.001) (Tables 1-2). Proximal suprascapular nerve visualization was similar after ferumoxytol administration (Rater 1 Δ=0, p=0.031/Rater 2 Δ=0, p=0.006), but with improved diagnostic confidence (Rater 1 Δ=1, p=0.004/Rater 2 Δ=1, p=0.0063). Visualization and diagnostic confidence of axillary and long thoracic nerves was not significantly improves post ferumoxytol (p>0.05).
Pre- and post-ferumoxytol STIR demonstrated moderate to near-perfect inter-rater agreement for nerve visualization (pre-ferumoxytol=0.57-0.95/post-ferumoxytol=0.65-1.0) and diagnostic confidence (pre-ferumoxytol=0.59-1.0/post-ferumoxytol=0.82-1.0) in evaluating all nerve segments, with the exception of the proximal long thoracic nerve post ferumoxytol (nerve visualization=0.17/diagnostic confidence=0.46).
Quantitatively, post-ferumoxytol STIR demonstrated a 20% improvement in mean muscle CNR (p=0.001). A 52% improvement in the mean vessel CNR was also observed, but this did not reach significance (p=0.058).
Discussion
Post-ferumoxytol STIR imaging demonstrated improved vascular suppression along with a 20% improvement in nerve-to-muscle CNR, which may reflect the suppressed signal of intramuscular vasculature. Nerve-to-vessel CNR increased on post-ferumoxytol imaging by 52%, although this difference was not statistically significant (p=0.058).Post-ferumoxytol STIR also led to improved visualization and diagnostic confidence in evaluating the distal suprascapular nerve. The fact that nerve visualization and diagnostic confidence of the axillary nerve did not improve significantly on post-ferumoxytol exams may reflect sufficient visualization of the nerve using non-contrast techniques. Visualization and diagnostic confidence also did not improve for the long thoracic nerve proximal and distal segments, but this may be due to the nerve’s very small size and circuitous course likely requiring higher spatial resolution (in additional to vascular suppression) for adequate visualization.
Conclusion
This study demonstrated the ferumoxytol, a novel contrast agent, for improved vascular suppression in MRN. Future directions include comparing the efficacy of ferumoxytol and gadolinium-based agents and further evaluating the safety and appropriate dosage of ferumoxytol for imaging applications.Acknowledgements
Funding for this project was provided by a seed grant from the International Skeletal Society. The authors thank Maggie Fung, Jaemin Shin and Yan Wen from GE Healthcare for their technical support.References
1. Yoneyama M, Takahara T, Kwee TC, et al. Rapid High Resolution MR Neurography with a Diffusion-weighted Pre-pulse. Magn Reson Med Sci. 2013;12:111–119.
2. Hockings PD, Roberts T, Galloway GJ, Reid DG, Harris DA, Vidgeon-Hart M, Groot PH, Suckling KE, Benson GM. Repeated three-dimensional magnetic resonance imaging of atherosclerosis development in innominate arteries of low-density lipoprotein receptor-knockout mice. Circulation. 2002 Sep 24;106(13):1716-21.
3. McDonald RJ, McDonald JS, Kallmes DF, Jentoft ME, Paolini MA, Murray DL, Williamson EE, Eckel LJ. Gadolinium Deposition in Human Brain Tissues after Contrast-enhanced MR Imaging in Adult Patients without Intracranial Abnormalities. Radiology. 2017 Nov;285(2):546-554.
4. Xu X, Geng H, Zhang Q, Yu J, Chu Y, Dong G, Wu J. Investigation of 3D reduced field of view carotid atherosclerotic plaque imaging. Magn Reson Imaging. 2018 Jun;49:10-15.
5. Lindenholz A, van der Kolk AG, Zwanenburg JJM, Hendrikse J. The Use and Pitfalls of Intracranial Vessel Wall Imaging: How We Do It. Radiology. 2018 Jan;286(1):12-28.
6. Brown R, Nguyen TD, Spincemaille P, Cham MD, Choi G, Winchester PA, Prince MR, Wang Y. Effect of blood flow on double inversion recovery vessel wall MRI of the peripheral arteries: quantitation with T2 mapping and comparison with flow-insensitive T2-prepared inversion recovery imaging. Magn Reson Med. 2010 Mar;63(3):736-44.
7. Abdel-Aty H, Simonetti O, Friedrich MG. T2-weighted cardiovascular magnetic resonance imaging. J Magn Reson Imaging. 2007 Sep;26(3):452-9.
8. Sneag DB, Daniels SP, Geannette C, Queler SC, Lin BQ, de Silva C, Tan ET. Post-Contrast 3D Inversion Recovery Magnetic Resonance Neurography for Evaluation of Branch Nerves of the Brachial Plexus. Eur J Radiol. 2020 Nov;132:109304.
9. Knobloch G, Colgan T, Wiens CN, Wang X, Schubert T, Hernando D, Sharma SD, Reeder SB. Relaxivity of Ferumoxytol at 1.5 T and 3.0 T. Invest Radiol. 2018 May;53(5):257-263.
10. Rohrer M, Bauer H, Mintorovitch J, Requardt M, Weinmann HJ. Comparison of magnetic properties of MRI contrast media solutions at different magnetic field strengths. Invest Radiol. 2005 Nov;40(11):715-24.
11. Sneag DB, Queler S. Technological Advancements in Magnetic Resonance Neurography. Curr Neurol Neurosci Rep. 2019 Aug 24;19(10):75.
Figures