0245
Improved T2' Mapping in Simultaneous Neurometabolic and Oxygenation Imaging Experiments1School of Biomedical Engineering, Shanghai Jiao Tong University, Shanghai, China, 2Beckman Institute for Advanced Science and Technology, University of Illinois at Urbana-Champaign, Urbana, IL, United States, 3Department of Electrical and Computer Engineering, University of Illinois at Urbana-Champaign, Urbana, IL, United States
Synopsis
Simultaneous MRSI and T2* mapping has been demonstrated recently using SPICE. With a T2 map, T2' values could be calculated, which reflects tissue oxygenation. However, the accuracy of T2* and T2 measurements suffers from system imperfections. In this work, we improved T2' mapping by overcoming signal dephasing in T2* mapping and estimation bias in T2 mapping. The signal dephasing in T2* caused by B0 inhomogeneity was corrected utilizing high-resolution field map and pre-learned subspaces, and the estimation bias in T2 caused by B1+ inhomogeneity was corrected with a dictionary-based estimation. The proposed method provided improved T2' mapping in SPICE experiments.
Introduction
Imaging of brain neurometabolism and oxygenation is of great significance for tissue characterization in a variety of brain diseases such as stroke and brain tumor.1 Recently, simultaneous 3D MRSI and T2* mapping has been achieved using SPICE (SPectroscopic Imaging by exploiting spatiospectral CorrElation).2,3 Quantitative T2' map that reflects tissue oxygenation could be calculated from the T2* map and a T2 map acquired from a spin-echo scan, thus making SPICE potentially applicable for concurrent neurometabolism and oxygenation imaging.However, both T2* and T2 measurements suffer from system imperfections such as B0 and B1 inhomogeneities in practice. More specifically, the presence of B0 field inhomogeneity introduces signal dephasing and distortion, thus leading to faster T2* decay in regions with large susceptibility.4,5 The B1+ inhomogeneity causes unideal magnetization refocusing, which makes the spin echo chain deviate from the desired exponential T2 decay.6 Therefore, the effects of field inhomogeneities on T2* and T2 mappings need to be corrected for accurate and reliable T2' measurements.
In this work, we propose to correct the B0 field effects on T2* mapping using a method leveraging both high-resolution B0 field map and pre-learned subspaces, and correct the B1+ inhomogeneity effects on T2 mapping using the dictionary-based estimation built on Bloch simulations.7 The results show that the proposed method could provide improved T2' mapping and achieve reliable simultaneous brain oxygenation and neurometabolic imaging for normal and pathological human brain tissues in SPICE experiments.
Methods
To correct the signal dephasing in T2* maps, the field-corrected water spatiotemporal functions were reconstructed using a high-resolution B0 field map and a pre-learned subspace. More specifically, based on the partial separability model,8 the field-corrected spatiotemporal functions of water signals could be represented using a low-dimensional subspace, so the measured signals can be expressed as:$$d(k,t) = Ω_{k,t}(F((\sum_{l=1}^{L}c_1(x)φ_1(t))e^{i2πB_0(x)t})) + η(k,t),$$
where $$$d$$$ is the measured limited k-space data, $$$Ω_{k,t}$$$ the sampling operator, $$$F$$$ the Fourier operator, $$$\{φ_1(t)\}$$$ the subspace basis and $$$\{c_1(x)\}$$$ the corresponding subspace coefficients.
In this work, the basis functions $$$\{φ_1(t)\}$$$ were learned from the high-resolution training data where the B0 field inhomogeneity was effectively corrected. To generate the high-resolution field map, a low-resolution field map was first estimated from the measured water signals and then super-resolution was performed via local polynomial approximation.9 With the learned signal subspace and high-resolution field map, the reconstruction was performed via solving the following optimization problem:
$$\boldsymbol{\widehat{c}} = arg{\mathop \min_\boldsymbol{c}}\|\boldsymbol{d}-Ω_{k,t}FB_H \boldsymbol{Φc}\|_2^2 + λ\|W∇\boldsymbol{c}\|_2^2,$$
where $$$\boldsymbol{d}$$$, $$$\boldsymbol{Φ}$$$, $$$\boldsymbol{c}$$$ are the vector/matrix form of $$$d(k,t)$$$, $$$\{φ_1(t)\}$$$ and $$$\{c_1(x)\}$$$, $$$B_H$$$, $$$∇$$$, $$$W$$$ the operators representing high-resolution field map, total variation, and edge-preserving weights derived from the tissue field, respectively. With $$$\boldsymbol{\widehat{c}}$$$ determined, the field-corrected signals was synthesized as $$$\hat{ρ} = \boldsymbol{Φ\hat{a}}$$$, from which we derived the field-corrected T2* map.
To correct the bias of T2 estimation induced by the B1+ inhomogeneities, a dictionary method based on Bloch simulation was used.7 The dictionary was built covering a range of T2 values (1 to 1000 ms), T1 values (500 to 5000 ms) and flip angles (120 to 180 degrees). The T2 value of each spatial voxel was estimated by searching the dictionary to find the closest simulated curve to the measured spin-echo curve in the L2-distance sense. Then, the T2' map was generated using the improved T2* and T2 maps. The neurometabolite maps were obtained using the standard processing pipeline of SPICE.3,10
In vivo experiments were carried out on a 3T Siemens Skyra MR scanner with local Institutional Review Board approved. The acquisition protocols included SPICE (1.2 x 1.2 x 1.9 mm3 for T2*, 2.0 x 3.0 x 3.0 mm3 for MRSI, FOV = 240 x 240 x 72 mm3, FA = 27°, TE = 1.6 ms, TR = 160 ms) and multi-echo spin echo sequence (0.4 x 0.4 x 5.0 mm3, FOV = 230 x 230 x 126 mm3, FA = 180° , TE = 10.5, 21.0, 31.5, 42.0, 52.5, 63.0 ms, TR = 2000 ms).
Results and Discussion
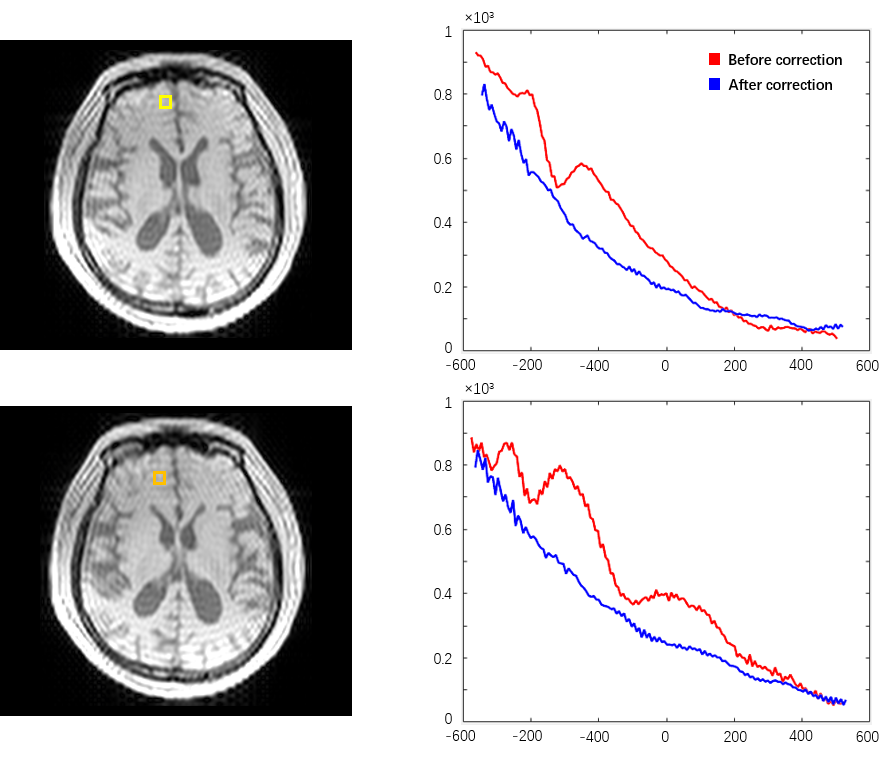
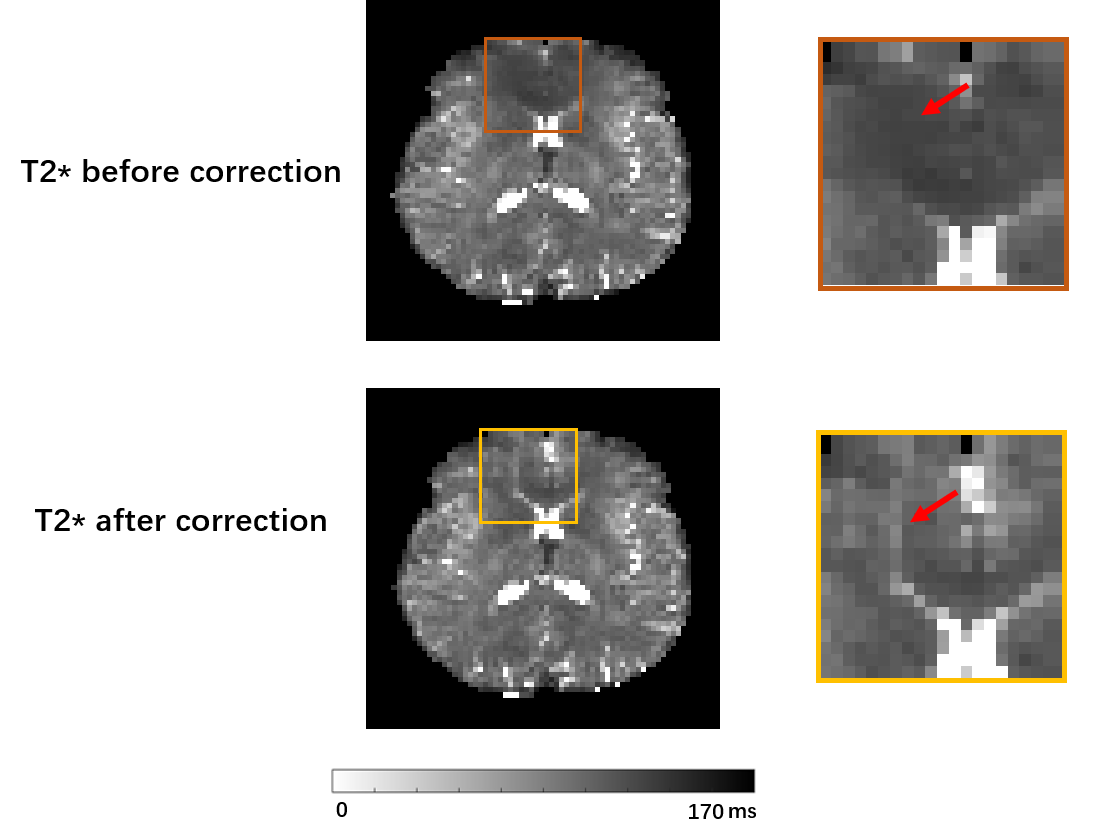
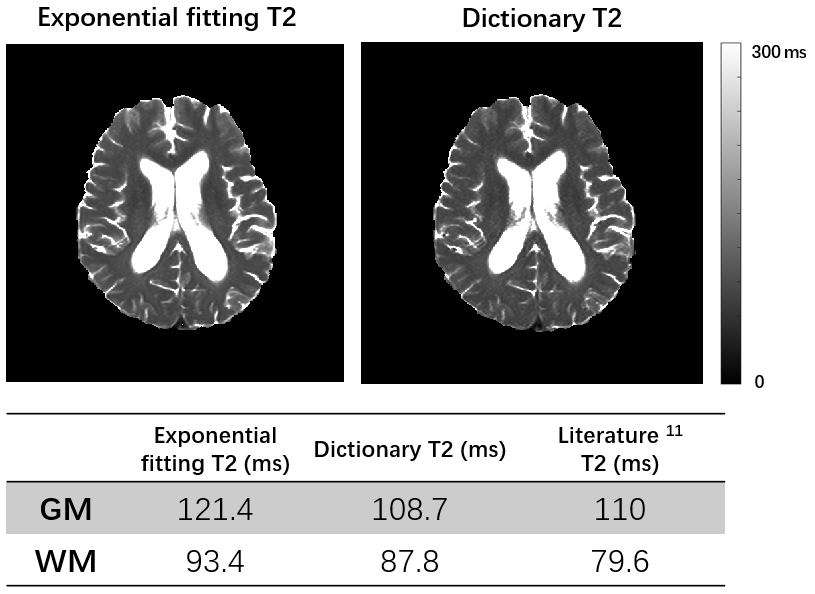
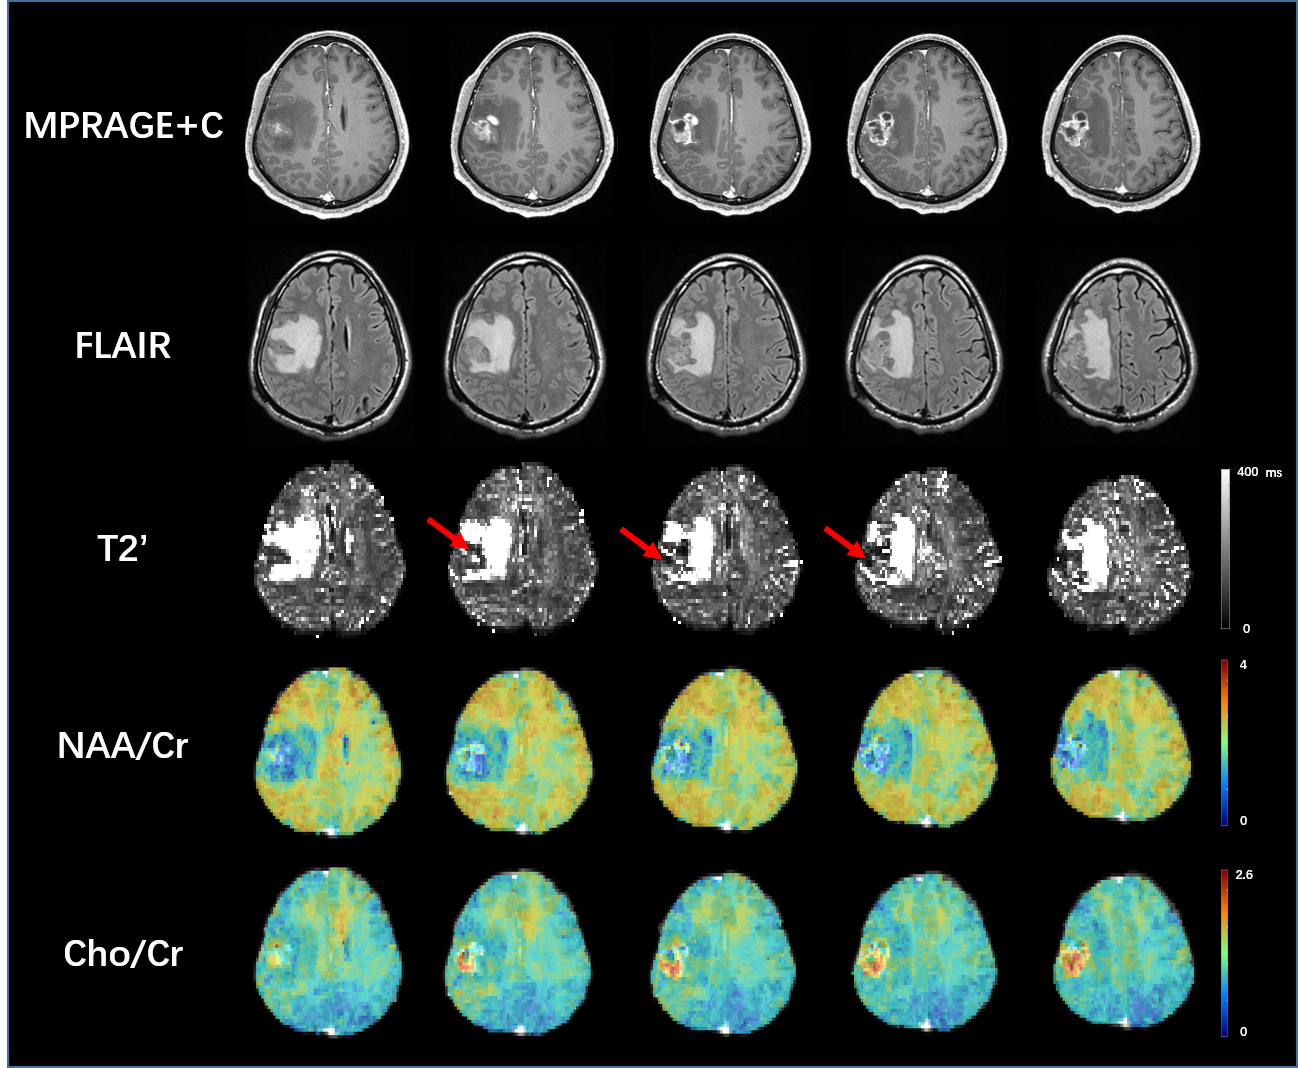
Fig 1 shows the localized FID signals from the regions with large B0 field inhomogeneities. The original FID signals suffered from noticeable distortions which could affect T2* estimation, while the FID signals reconstructed using the proposed method showed much improved signal decay. Fig 2 shows the T2* maps estimated from the original data and from the reconstructed data with field effects corrected. As can been see, noticeable signal loss from dephasing existed in the original T2* map near the sinus region. In contrast, the T2* map obtained by the proposed method had much reduced image distortions. Fig 3. shows the improved performance of T2 quantification using dictionary-based approach over exponential fitting when comparing mean tissue T2 values to reference.11 The potential applications of the proposed simultaneous brain oxygenation and neurometabolic imaging in clinical settings are demonstrated in Fig 4. Simultaneous increased T2' values along with reduced NAA to creatine ratio and elevated choline to creatine ratio were shown in the tumor region of a glioma patient, in line with the literature.12,13Conclusions
The proposed method achieved improved T2' mapping in simultaneous neurometabolic and oxygenation imaging experiments using SPICE. It will have many potential applications in a variety of brain diseases studies.Acknowledgements
Y. L. is funded by National Science Foundation of China (No.61671292 and 81871083) and Shanghai Jiao Tong University Scientific and Technological Innovation Funds (2019QYA12).References
1. Dani K, Warach S. Metabolic imaging of ischemic stroke: the present and future. American Journal of Neuroradiology. 2014;35:S37-S43.
2. Lam F, Liang Z P. A subspace approach to high-resolution spectroscopic imaging. Magn Reson Med. 2014;71(4):1349-1357.
3. Lam F, Ma C, Clifford B, et al. High-resolution 1H-MRSI of the brain using SPICE: data acquisition and image reconstruction. Magn Reson Med. 2016;76(4):1059-1070.
4. Hernando D, Vigen K K, Shimakawa A, et al. R2* mapping in the presence of macroscopic B0 field variations. Magn Reson Med. 2012;68(3):830-840.
5. Yang X, Sammet S, Schmalbrock P, et al. Postprocessing correction for distortions in T2* decay caused by quadratic cross-slice B0 inhomogeneity. Magn Reson Med. 2010;63(5):1258-1268.
6. Hennig J. Multiecho imaging sequences with low refocusing flip angles. J of Magn Reson. 1988;78(3):397-407.
7. Ben-Eliezer N, Sodickson D K, Block K T. Rapid and accurate T2 mapping from multi-spin-echo data using Bloch-simulation-based reconstruction. Magn Reson Med. 2015;73(2):809-817.
8. Liang Z-P. Spatiotemporal imaging with partially separable functions. 2007 4th IEEE International Symposium on Biomedical Imaging: From Nano to Macro. IEEE, 2007:988-991.
9. Liang Z P, Haacke E M, Thomas C W. High-resolution inversion of finite Fourier transform data through a localised polynomial approximation. Inverse Problems. 1989;5(5):831.
10. Li Y, Lam F, Clifford B, et al. A subspace approach to spectral quantification for MR spectroscopic imaging. IEEE Trans Biomed Eng. 2017;64(10):2486-2489.
11. Wansapura JP, Holland SK, Dunn RS, et al. NMR relaxation times in the human brain at 3.0 tesla. J of Magn Reson Imaging.1999;9(4):531-538.
12. Christen T, Lemasson B, Pannetier N, et al. Is T2* enough to assess oxygenation? Quantitative blood oxygen level–dependent analysis in brain tumor. Radiology.2012;262(2):495-502.
13. Fan G, Sun B, Wu Z, et al. In vivo single-voxel proton MR spectroscopy in the differentiation of high-grade gliomas and solitary metastases. Clinical radiology.2004;59(1):77-85.
Figures