0244
The combination of ITSS and R2* in quantitatively and automatically evaluating histological grade of HCC using ESWAN: A feasibility study1The First Affiliated Hospital of Dalian Medical University, Dalian, China, 2Dalian University of Technology, Dalian, China
Synopsis
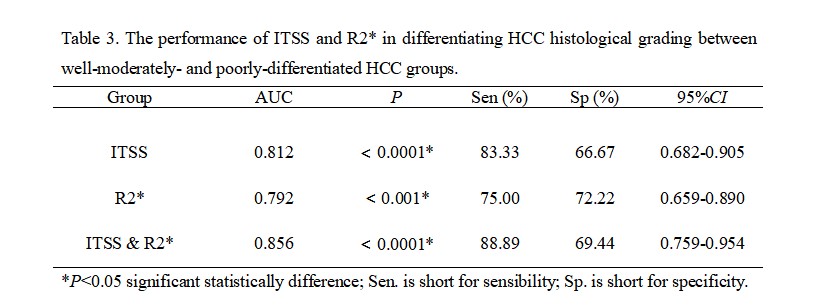
The aim of this study was to investigate the feasibility of intratumoral susceptibility signal intensities (ITSS) combined with R2* values obtained from T2 star-weighted angiography (ESWAN) in quantitatively and automatically evaluating histological grading of hepatocellular carcinoma (HCC). The results showed that the combination of quantitative ITSS and R2* was feasible to evaluate the histological grading of HCC performance (AUC = 0.856, P < 0.0001, sensitivity of 88.89%, specificity of 69.44%) automatically.
Introduction
Angiogenesis, as a consequence of hypoxia, is considered one of the key features of tumor progression, meanwhile, vessel density and vascular endothelial growth factor are of prognostic value, and these values increase with increasing tumor grade [1]. The higher the degree of malignancy of a tumor, the more complicated its internal structure, and the display of these complicated components contributes to the pathological grade of tumors [2]. ESWAN, a newly developed magnetic reseonance technology, is based on susceptibility weighted imaging (SWI), which is a promising technique for depicting hemorrhage, calcification and increased vascularity, which may manifest tumor histological grading [3]. R2* value might provide a method of evaluating tumor oxygenation [4], and has been used preliminarily in predicting pathological grade of HCC [5]. We hypothesize that it’s feasible to evaluate histological grade of HCC quantitatively and automatically by ITSS combined with R2* value.Methods
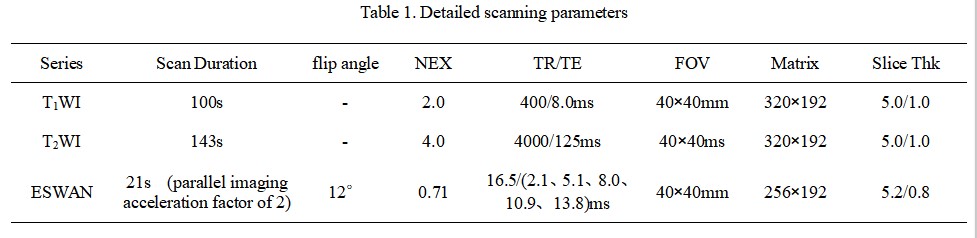
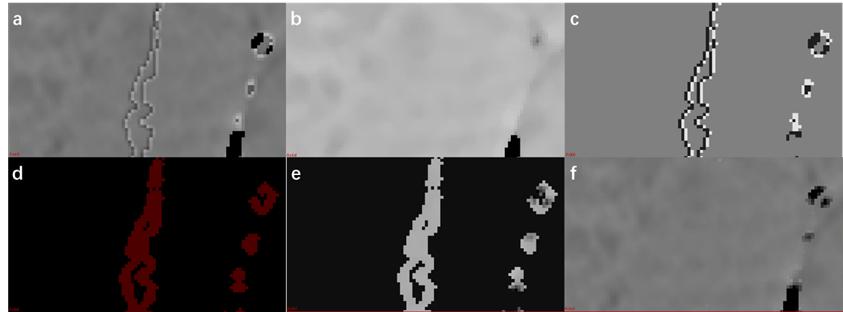
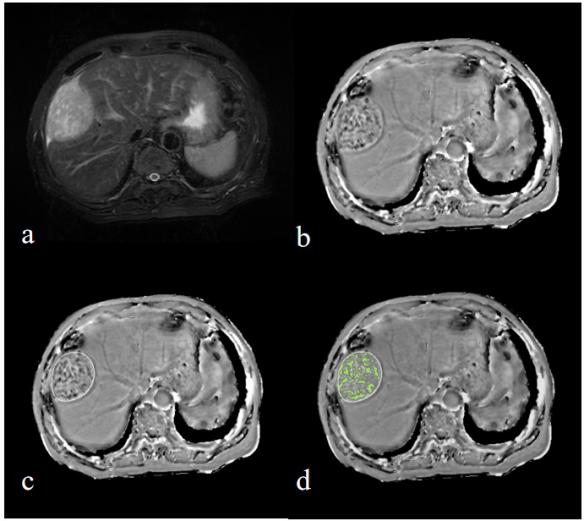
From December 2018 to November 2020, 54 patients in our hospital who were pathologically confirmed as HCC, including well-moderately differentiated HCC group (n = 36, 28 male, 8 female, (60.56 ± 8.96) years old), and poorly-differentiated HCC group (n = 18, 13 male, 5 female, (55.61 ± 10.68) years old). All patients underwent abdominal MR examinations with 1.5 T MR scanner (Signa HDxt, GE Medical Systems, USA), including T1WI, T2WI and 3D gradient echo (GRE) ESWAN sequence. Detailed MR scanning parameters are shown in Table 1. All images on ESWAN sequence were transferred to the GE AW 4.6 workstation for post-processing in Functool software, and R2* maps and phase maps were generated. Phase maps were exported as DICOM format. Due to the acquisition, there are banding artifacts in the phase image as shown in Figure 1 (a). The workflow shown in Figure 1 is first used to remove artifacts from the input phase map. The workflow is as follows: (i) First, the abnormal pixels with high gray value and low gray value in the phase map are detected; (ii) Then, the artifact region is determined according to the feature of adjacent pixels of high pixel value and low pixel value; (iii) Finally, the pixel values in artifact region are recalculated according to the gray values of the surrounding non-artifact pixels. Phase maps after using batch program to remove artifacts were exported as NII format, and transmitted to AnatomySketch (AS) software, which is programmed using C++ based on Qt and VTK libraries (Dalian University of Technology). Referencing to T2WI images, regions of interest (ROI) were delineated around the edge of the tumor on phase maps, excluding tumor pseudocapsule (Figure 2). ROI can be obtained without layer-by-layer annotation through the interpolation and annotation tools of AS. Then, the AS software can automatically calculate the ITSS ratio of the phase maps. ITSS ratio was defined as the ratio of ITSS to the lesion involving area on tumor maximal axial section [6]. Three ROIs were drawn on tumor maximal axial section (avoiding cystic and necrotic regions) on three continuous section in R2* maps. The sizes of ROIs were defined depending on the shape and size of tumor [7], at least one third of the tumor parenchyma. All statistic analyses were analyzed by SPSS 25.0 software. Normal distribution was tested by Shapiro-Wilks test. ITSS and R2* values between well-moderately and poorly differentiated HCC were compared using Mann-Whitney U test. Spearman’s rank correlation test was performed to analyze the correlation between ITSS value and R2* value and HCC histological grade. Receiver operating characteristic (ROC) analysis was performed to evaluate the combined diagnostic performance. Delong's test was used to compare the areas under ITSS and R2* ROC curves.Results
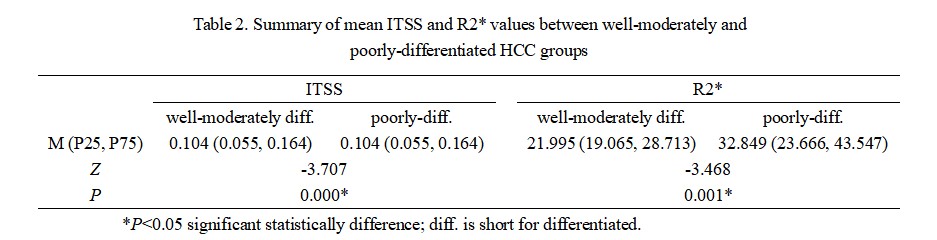
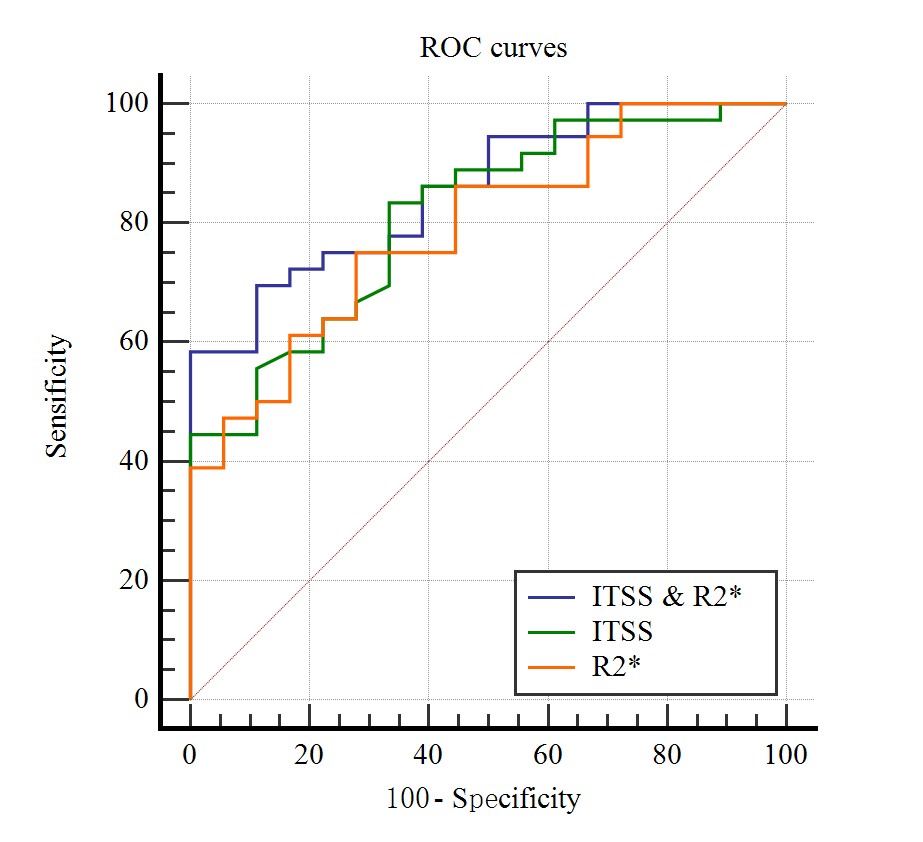
Either ITSS or R2* values of poorly-differentiated HCCs was higher than that of well-moderately differentiated HCC. There were significant difference of ITSS and R2* values between well-moderately and poorly-differentiated group (P = 0.000, P = 0.001) (Table 2). Spearman’s rank correlation coefficient of ITSS and R2* values and HCC histological grade was 0.509 and 0.476, respectively (P = 0.0001, P = 0.0003). The AUC of the combination of ITSS and R2* was 0.856, sensitivity of 88.89%, specificity of 69.44% (Table 3). The combined AUC was higher than any single method, while there was not statistically significant different (P > 0.05) (Figure 3).Discussion and Conclusion
This study showed that quantitative ITSS combined with R2* values had good performance in evaluating HCC histological grade (AUC = 0.856, P <0.0001). Histological grade in HCC plays a crucial role in prognosis prediction. Early HCC is completely curable, while poorly differentiated HCC is associated with the worst recurrence-free and overall survival rates [8]. Semi-quantitative measurement of ITSS on SWI has been reported as a promising parameter for both tumor grade evaluation and central nervous system tumor differentiation [3]. The R2* value has a direct relation to the tissue deoxygenated hemoglobin concentration and can be used to quantitatively assess changes of oxygen content in local tissue [9]. A high R2* value indicates a lower oxygen, an increase in deoxygenated hemoglobin, and a decrease in MR signal [9]. We proposed that ITSS combined with R2* values obtained from ESWAN could be a promising imaging biomaker that allow evaluating histological grade of HCC quantitatively and automatically.Acknowledgements
Thanks sincerely to my dear tutor and all my group parterns.References
[1] Bhattacharjee, R., Gupta, R. K., Patir, R., et al. Quantitative vs. semiquantitative assessment of intratumoral susceptibility signals in patients with different grades of glioma. Journal of magnetic resonance imaging, 2019;51(1), 225-233.
[2] Xin, J. Y., Gao, S. S., Liu, J. G., et al. The value of ESWAN in diagnosis and differential diagnosis of prostate cancer: Preliminary study. Magnetic resonance imaging, 2017;12(44), 26-31.
[3] Yang, X., Zhu, J., Dai, Y., et al. Multi-parametric effect in predicting tumor histological grade by using susceptibility weighted magnetic resonance imaging in tongue squamous cell carcinoma. BMC medical imaging, 2019;19(1), 24.
[4] Li, X. S., Fan, H. X., Fang, H., et al. Value of R2* obtained from T2*-weighted imaging in predicting the prognosis of advanced cervical squamous carcinoma treated with concurrent chemoradiotherapy. Journal of magnetic resonance imaging, 2015;42(3), 681-688.
[5] Tian, S. F., Liu, A. L., Guo, W. Y., et al. Feasibility of R2* value in predicting pathological grade of hepatocellular carcinoma. [In Chinese]. Chinese Journal of Medical Imaging Technology, 2016,11:1693-1696.
[6] Park, S. M., Kim, H. S., Jahng, G. H., et al. Combination of high-resolution susceptibility-weighted imaging and the apparent diffusion coefficient: added value to brain tumour imaging and clinical feasibility of non-contrast MRI at 3T. The British journal of radiology, 2010;83(990): 466-475.
[7] Li, B., Xu, A., Huang, Y., et al. Oxygen-Challenge Blood Oxygen Level-Dependent Magnetic Resonance Imaging for Evaluation of Early Change of Hepatocellular Carcinoma to Chemoembolization: A Feasibility Study. [published online ahead of print, 2020 Jul 31]. Acad Radiol. 2020;S1076-6332(20)30371-8.
[8] Wang, F., Numata, K., Nakano, M., et al. Diagnostic Value of Imaging Methods in the Histological Four Grading of Hepatocellular Carcinoma[J]. Diagnostics, 2020, 10(5).
[9] Han, X., Sun M. Y., Wang, M. Y., et al. The enhanced T2*-star weighted angiography (ESWAN) value for differentiating borderline from malignant epithelial ovarian tumors[J]. European Journal of Radiology, 2019, 118:187-193.
Figures