0242
Deuterium metabolic imaging (DMI) of Water, Glucose and Lactate using spectroscopic multi-echo bSSFP: A higher Signal to Noise Approach1Radiology and Biomed Eng., Yale University, New Haven, CT, United States, 2Weizmann Institute of Science, Rehovot, Israel
Synopsis
Deuterium metabolic imaging (DMI) maps the individual in vivo fate of 2H-enriched metabolites. Upon injecting 2H6,6’-glucose, DMI images a 2H-water peak, and a small but diagnostic 2H3,3’-lactate signature, highlighting tumors and their aberrant metabolism. DMI faces major sensitivity challenges, that can be alleviated by a multi-echo balanced SSFP approach. When suitably tuned, multi-echo bSSFP yields good spectral isolation of all metabolites, and thanks to the relatively large T2/T1 ratios of deuterated compounds, several-fold increases in SNR vs. chemical shift imaging are then obtained. This is demonstrated in phantoms, and in in vivo mice studies of orthotopic pancreatic tumors.
Introduction
Deuterium metabolic imaging (DMI) is an emerging method 1-3 for mapping in vivo and non-invasively the uptake of deuterated metabolites, and their marking of metabolism. So far DMI employed T1-weighted chemical shift imaging (CSI) sequences to differentiate the spatial distribution of the individual compounds, and image them vs time. However, even when leveraging 2H’s short T1s, DMI’s SNR is limited. Ongoing studies have shown that abnormal tumor metabolism4 might be highlighted by following the small but diagnostic 2H3,3’-lactate signature arising ca. one hour after the injection of 2H6,6’-glucose. We hypothesized that a multi-echo balanced steady state free precession (ME-bSSFP) approach5 would increase this the sensitivity of this diagnosis several-fold vis-à-vis CSI, while achieving good spectral isolation of metabolites. Supporting this is the relatively high T2/T1 ratios of the metabolites observed in vivo, increasing bSSFP’s SNR which scales as √(T2/T1).6 Furthermore, a ME approach coupled to the IDEAL reconstruction7, could enable bSSFP’s Dixon-like isolation of the various chemical shifts of interest. ME-bSSFP has in fact been applied to hyperpolarized 13C spectroscopy8-10, with a goal to leverage it for increasing the scanning speed rather than the SNR. This study shows both theoretically and experimentally, that substantial increases in SNR, resulting in better 2H spectral images, can be achieved by 2H ME-bSSFP.Methods
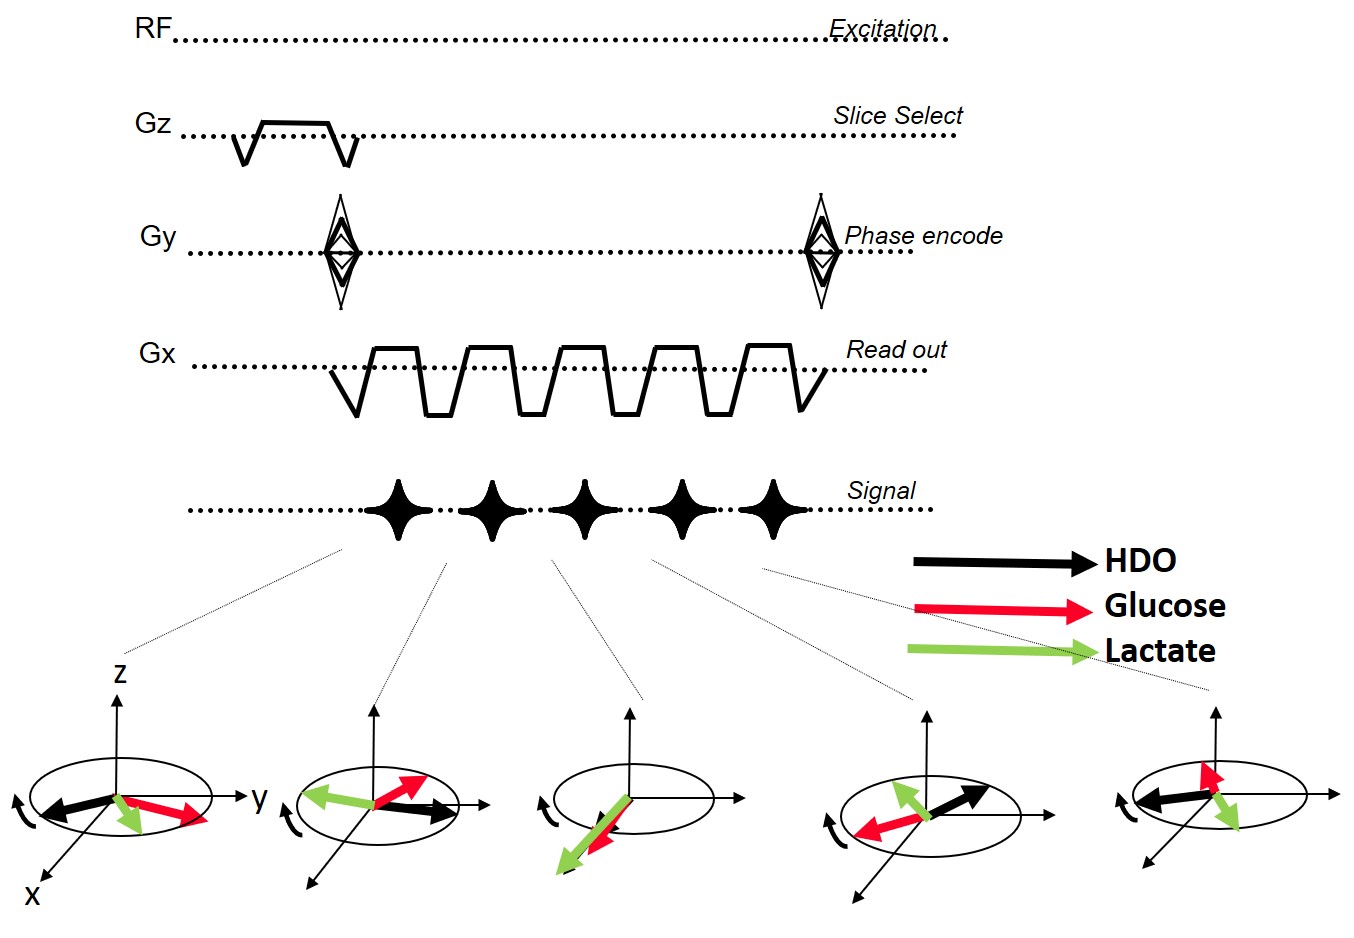
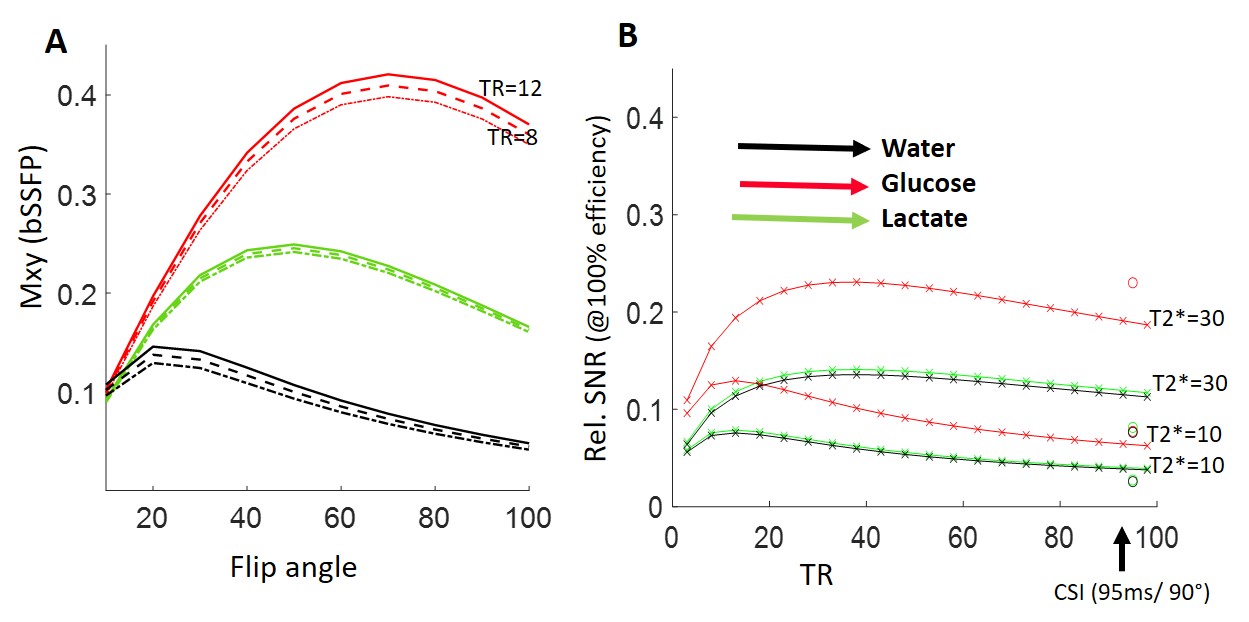
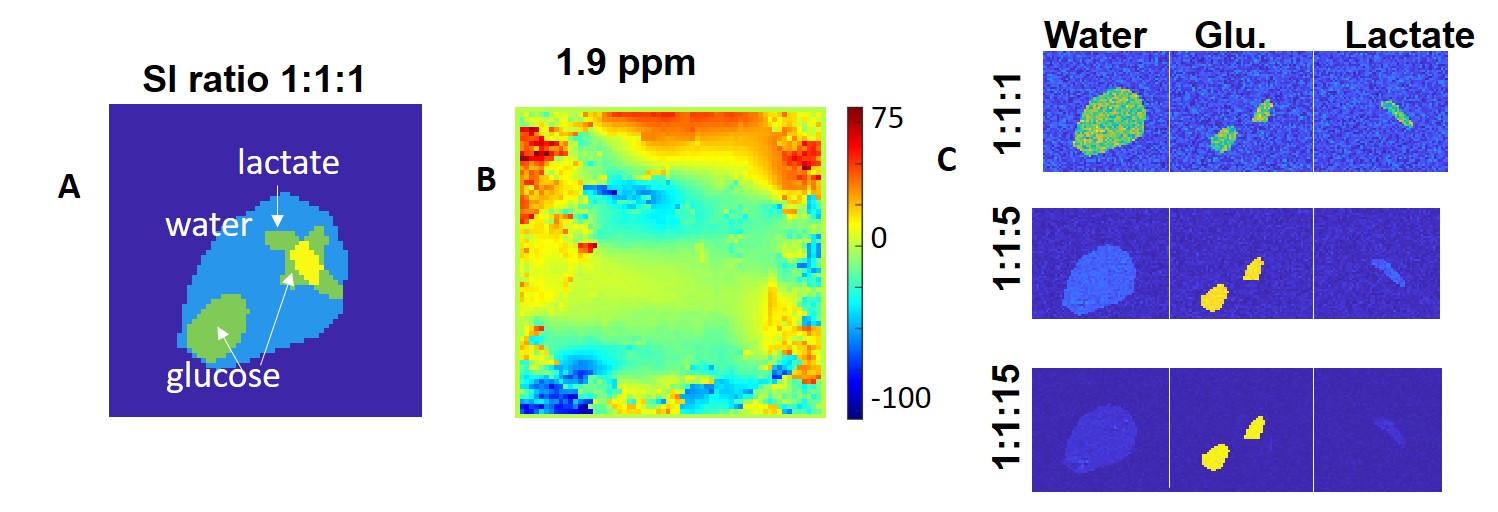
Simulations were run to optimize the SNR of bSSFP and CSI, based on T2/T1 values observed for 2H6,6’-glucose (30ms/60ms), for 2H3,3’-lactate (60ms/292ms) and for 2H-water (12ms/290ms) (1). The SNR simulations included standard signal dependency of bSSFP and GRE on T1/T2 and T2*6,11 and assumed equal scan times, and voxel sizes. Calculations were also done to explore ME-bSSFP’s ability to isolate these spatially overlapping metabolites, given their respective chemical shifts (3.7ppm, 1.3ppm and 4.8ppm) at a 2H Larmor frequency of 99.34 MHz (15.2T). These spectral selectivity simulations included realistic field-inhomogeneity maps, multiple signal ratios for the metabolites, and added Gaussian noise. Simulations also helped us to determine a repetition time TR and carrier frequency combination, so that all of the metabolites were located outside of the bSSFP “dark bands”8.Experiments: 2H ME-bSSFP and CSI sequences were written in Paravision 6 (Figure 1), and suitably tuned experiments were implemented at 15.2 T on a Bruker scanner utilizing a double-resonance 1H/2H setup based on surface coils. These results were compared to optimized CSI sequences, both in deuterated phantoms and in vivo. Scan time was 10 minutes for all experiments. CSI reconstruction used standard methods (spatial and spectral filtering, zero-filling, 3D FFT12). ME-bSSFP reconstruction was performed using 2D FFT, then IDEAL processing using the ISMRM fat-water toolbox, and Hierarchical IDEAL13. Phantoms: Agar-based samples containing the targeted metabolites were made, and the spectral isolation provided by optimized ME-bSSFP was evaluated. SNRs of CSI and ME-bSSFP at equal spatial resolution (1x1x8mm3 with a 32x32 matrix) were compared.
Animals: A KPC mouse tumor model of pancreatic adenocarcinoma (PDAC) was investigated, with 2H experiments performed on IACUC-approved studies of ten mice at various stages of tumor growth. To compare SNR performance, 32x32 CSI were acquired, in consecutive randomized order, with 32x32 ME-bSSFP. SNRs were measured in matched ROIs. However, as lactate was not visible on CSI at this resolution except in one case, 8x8 CSI (5x5x8mm3) data sets were also acquired and the spatial/temporal patterns of the metabolites compared.
Results
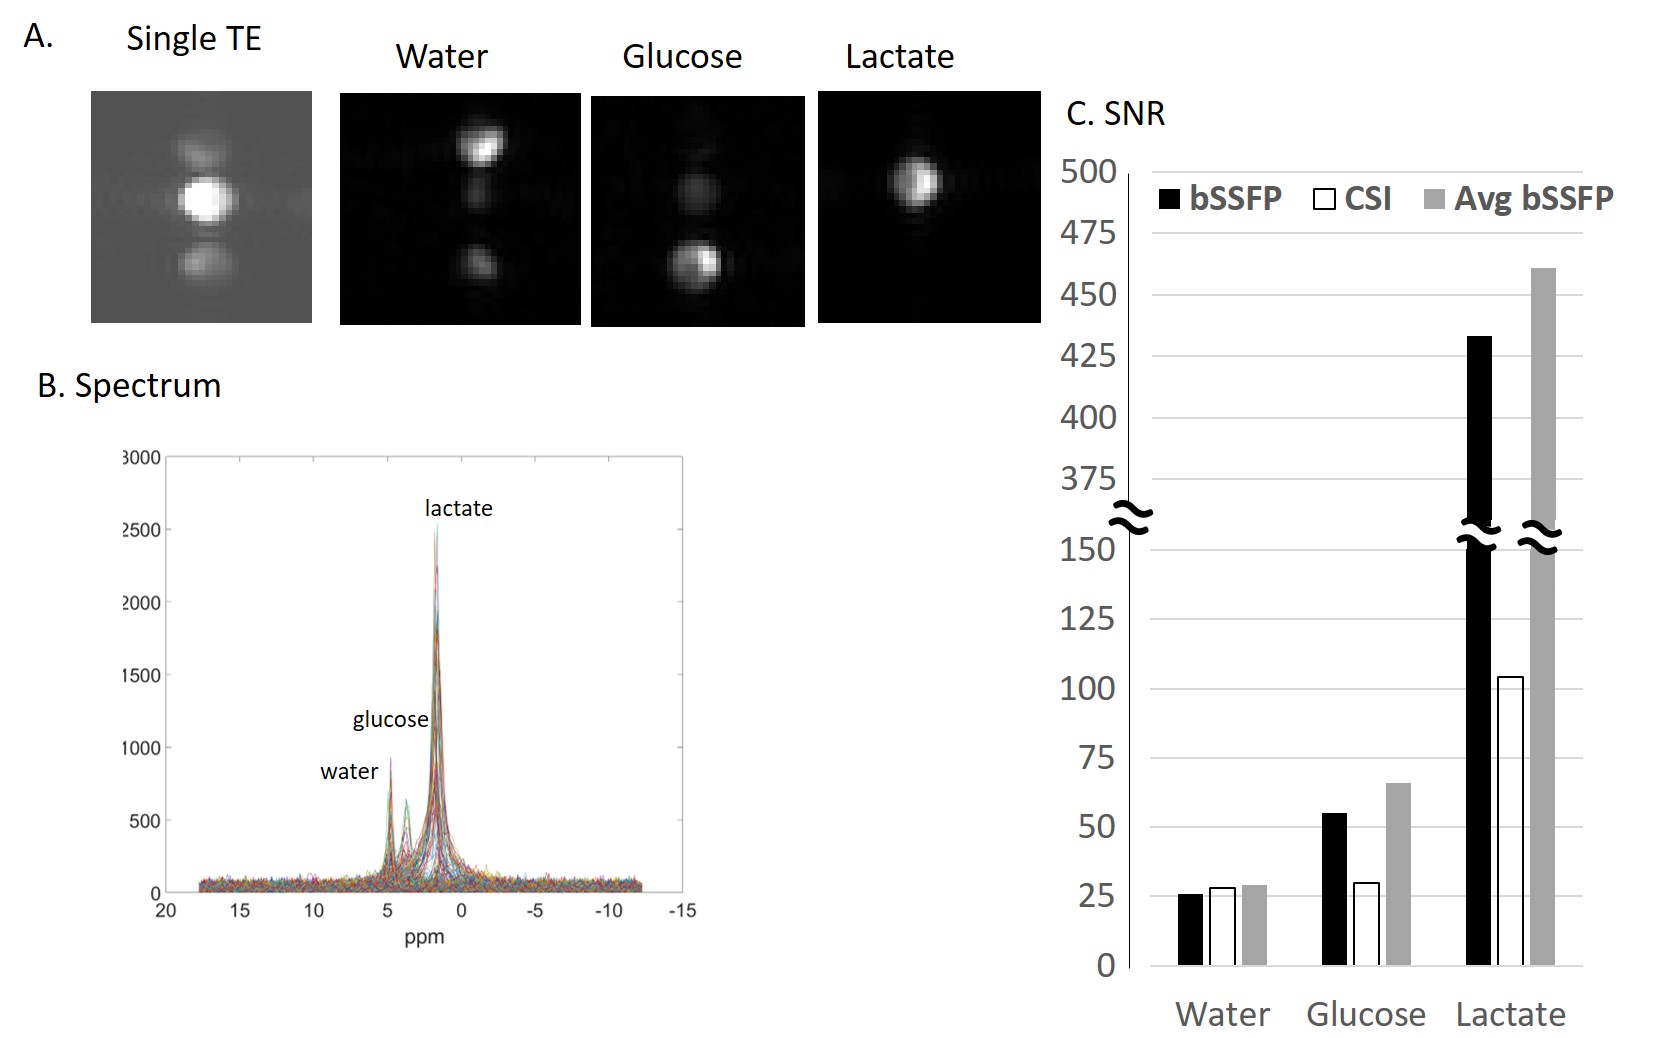
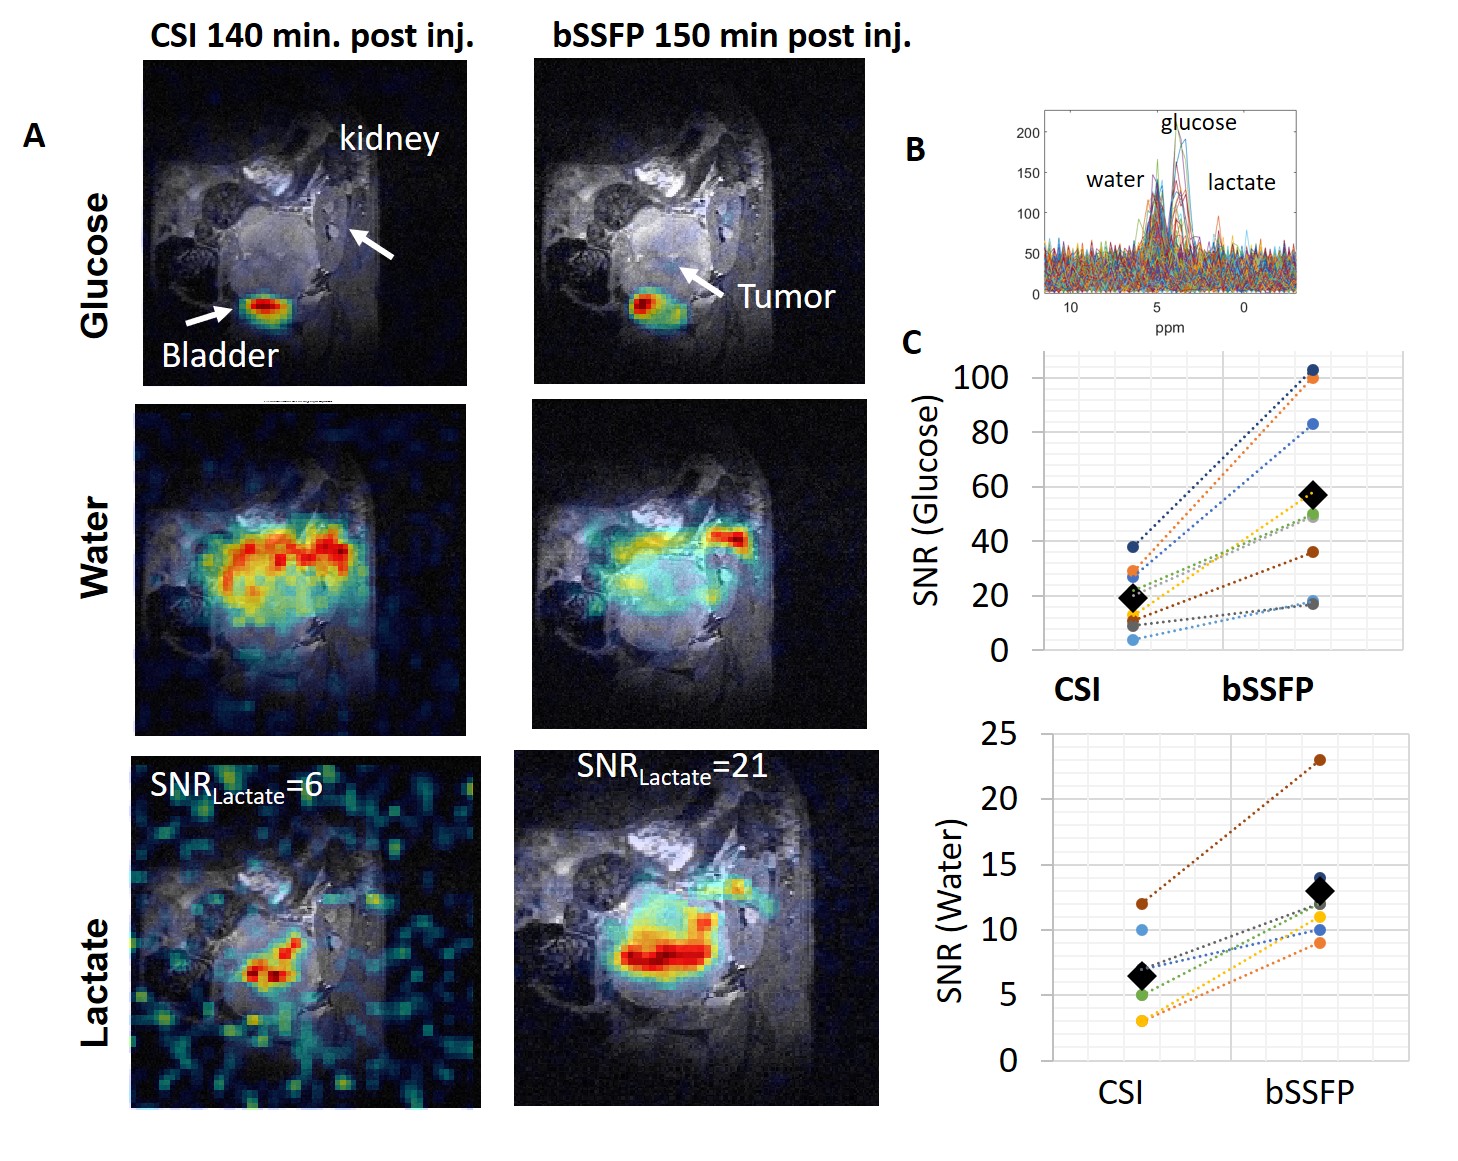
Simulations showed that for the targeted 2H compounds bSSFP could provide several-fold increases in SNR (Figure 2), depending on T2*. Suitable settings of the ME-bSSFP sequence –5 TEs, ΔTE=2.2ms, TR=12.2ms, θ=60° and a carrier frequency placed at 2.6ppm to avoid dark bands– also provided well isolated metabolites after IDEAL reconstruction even with limited homogeneities and SNR (Figure 3; smaller echo-spacings were found useful to deal with larger field inhomogeneities). Phantom experiments executed under such conditions showed a four-fold increase in lactate’s ME-bSSFP image, two-fold for the glucose, and a minor improvement for water, vis-à-vis an optimized CSI collected with TR/θ=95ms/90° (Figure 4). Figure 5 compares CSI and ME-bSSFP images from an animal with a large tumor collected ≈2 hrs after injection of glucose, at equal spatial resolution. The spatial locations of glucose, water and lactate agree well, as they did in all in vivo studies (which typically compared 8x8 CSI to 32x32 ME-bSSFP scans). At equal spatial resolution and scan time, glucose’s in vivo ME-bSSFP SNR was 3-fold greater CSI (57±30 vs. 19±10, p<0.001), and water’s SNR was doubled (Figure 5B). Lactate’s SNR could not be compared, as lactate was usually invisible on 32x32 CSI studies. The sole exception to this is shown in Figure 5A, for which ME-bSSFP’s SNR was 3-fold higher.Discussion
Simulations, phantoms and in vivo results indicate that, for DMI at 15.2T, ME-bSSFP provides substantial boosts in SNR per unit time compared to CSI. This can be translated into higher resolution, faster imaging, or greater sensitivity to map lactate’s production. Given the quadrupolar nature of 2H’s relaxation and the flexibility afforded by the TE choices the translation of this method to lower field strengths seems very feasible, greatly facilitating the power of DMI to image non-invasively the Warburg effect.Acknowledgements
This work was supported by the Kimmel and by the Clore Institutes for Magnetic Resonance (Weizmann Institute), by the Israel Science Foundation (grant 965/18), the Thompson Family Foundation, and the Israel Cancer Research Foundation. DCP acknowledges the Benoziyo Endowment Fund for the Advancement of Science, for a Visiting Faculty Fellowship to the Weizmann Institute, and thanks Yale Radiology for sabbatical time.References
1. De Feyter HM, Behar KL, Corbin ZA, Fulbright RK, Brown PB, McIntyre S, Nixon TW, Rothman DL, de Graaf RA. Deuterium metabolic imaging (DMI) for MRI-based 3D mapping of metabolism in vivo. Sci Adv 2018;4(8):eaat7314.
2. de Graaf RA, Hendriks AD, Klomp DWJ, Kumaragamage C, Welting D, Arteaga de Castro CS, Brown PB, McIntyre S, Nixon TW, Prompers JJ, De Feyter HM. On the magnetic field dependence of deuterium metabolic imaging. NMR Biomed 2020;33(3):e4235.
3. Kreis F, Wright AJ, Hesse F, Fala M, Hu DE, Brindle KM. Measuring Tumor Glycolytic Flux in Vivo by Using Fast Deuterium MRI. Radiology 2020;294(2):289-296.
4. Warburg O, Wind F, Negelein E. The Metabolism of Tumors in the Body. J Gen Physiol 1927;8(6):519-530.
5. Herzka DA, Kellman P, Aletras AH, Guttman MA, McVeigh ER. Multishot EPI-SSFP in the heart. Magn Reson Med 2002;47(4):655-664.
6. Bieri O, Scheffler K. Fundamentals of balanced steady state free precession MRI. J Magn Reson Imaging 2013;38(1):2-11.
7. Reeder SB, Pineda AR, Wen Z, Shimakawa A, Yu H, Brittain JH, Gold GE, Beaulieu CH, Pelc NJ. Iterative decomposition of water and fat with echo asymmetry and least-squares estimation (IDEAL): application with fast spin-echo imaging. Magn Reson Med 2005;54(3):636-644.
8. Leupold J, Mansson S, Petersson JS, Hennig J, Wieben O. Fast multiecho balanced SSFP metabolite mapping of (1)H and hyperpolarized (13)C compounds. MAGMA 2009;22(4):251-256.
9. Leupold J, Wieben O, Mansson S, Speck O, Scheffler K, Petersson JS, Hennig J. Fast chemical shift mapping with multiecho balanced SSFP. MAGMA 2006;19(5):267-273. 10. Perman WH, Bhattacharya P, Leupold J, Lin AP, Harris KC, Norton VA, Hovener JB, Ross BD. Fast volumetric spatial-spectral MR imaging of hyperpolarized 13C-labeled compounds using multiple echo 3D bSSFP. Magn Reson Imaging 2010;28(4):459-465.
11. Ernst RR, Anderson WA. Application of Fourier Transform Spectroscopy to Magnetic Resonance. Rev Sci Instrum 1966;37(1):93-+.
12 Markovic S, Fages A, Roussel T, Hadas R, Brandis A, Neeman M, Frydman L. Placental physiology monitored by hyperpolarized dynamic (13)C magnetic resonance. Proc Natl Acad Sci U S A 2018;115(10):E2429-E2436.
13. Tsao J, Jiang Y. Hierarchical IDEAL: fast, robust, and multiresolution separation of multiple chemical species from multiple echo times. Magn Reson Med 2013;70(1):155-159.
Figures