0241
Heavily T2-weighted Imaging with Phase-Based RF Modulated GRE Imaging
Soudabeh Kargar1, Daiki Tamada1, Ruvini Navaratna1, Jayse Merle Weaver1, and Scott B Reeder1
1Radiology, University of Wisconsin - Madison, Madison, WI, United States
1Radiology, University of Wisconsin - Madison, Madison, WI, United States
Synopsis
Heavily T2-weighted imaging is used for a variety of fluid sensitive imaging such as MRCP. However, these fast spin-echo-based methods suffer from long acquisition duration. In this work we apply a novel strategy using RF phase modulated gradient echo (GRE) with small RF phase increments to encode T2 information into the phase of the signal. In this work, we optimize this strategy for long T2 species to achieve heavily T2-weighted imaging, including the introduction of a novel cross-product strategy to highlight signal in tissues with long T2 and suppress signal in tissues with shorter T2 values.
Introduction
Fluid sensitive imaging applications such as magnetic resonance cholangiopancreatography (MRCP) or imaging of the cerebrospinal fluid (CSF) rely on heavily T2 weighted imaging. These methods rely on heavily weighted 2D and 3D fast spin-echo (FSE)-based strategies, which suffer from relatively long acquisition duration.Recently, a novel strategy using RF phase modulated gradient echo (GRE) with small RF phase increments to encode T2 information into the phase of the signal has been described [1]. In this work, we optimize this strategy for long T2 species for heavily T2-weighted imaging, including the introduction of a novel cross-product strategy to highlight signal in tissues with long T2 and suppress signal in tissues with shorter T2 values.
Theory
This work extends on a recently reported phase-based T2 mapping gradient echo method that relies on the use of small RF phase increments to encode T2 information [1]. Here, we optimize this strategy for imaging of long T2 species, and also propose a novel cross-product strategy to generate heavily T2 weighted images. In this method, we account for background phase by acquiring a data with a quadratically incremented RF phase, ie: $$$ \Phi(n)=\Phi(n-1)+n\Delta\phi$$$, where $$$\Delta\phi$$$ is a small phase increment. A second acquisition is acquired with equal, but opposite phase increments and the phase difference image is used to remove background phase.Bloch equation simulations show that for very low phase increments and long T2 values (e.g. fluid), the encoded phase approaches 45 degrees, while the phase from tissue parenchyma (e.g. brain, liver) is very small. As shown in Fig. 1, after phase subtraction, the relative phase between fluid and background tissue parenchyma thus approaches 90 degrees, ie: in quadrature. We can exploit this phase behavior by taking the magnitude of the cross product of the two data sets defined in Eq.1:
$$ | \vec S_{Liver} \times \vec S_{Bile} |=|\vec S_{Liver}||\vec S_{Bile}|sin(\theta) \space \space \space Eq.1$$
where $$$\theta$$$ is the angle between vector $$$\vec S_{Liver}$$$ and $$$\vec S_{Bile}$$$. If $$$\theta$$$ is about 90 degrees, the $$$sin(\theta)$$$ will be close to 1 (long T2 species) while $$$sin(\theta)$$$ will be a small number when $$$\theta$$$ is small (short T2 species). This mathematical property can be useful if the two tissues of interest have relative phase shifts close to 90 and 0. The signals from two data sets are plotted in the complex plane in Fig. 2.
Methods
Using Bloch equation simulations, we show that for very long T2 (fluid) vs parenchyma the phase shift approaches 45 degrees, for specific flip angle $$$(\alpha)$$$, TR, and $$$\Delta\phi$$$. Thus, with acquisitions with equal/opposite phase, this will mean that the relative phase between fluid and parenchyma is about 90 degrees. An example of the scan parameters for bile fluid (T2= 675 msec in 3T) vs liver (T2= 35 msec in 3T) is flip angle of about 25° and $$$\Delta\phi$$$= 0.3°.Bloch Equation simulation was used to utilize the phase difference between bile and the liver and find the optimum parameters for the scan. In Fig. 1 the phase difference is plotted vs. a range of flip angle and phase increments. This is also shown in the 1D plots in Fig. 3 using the same Bloch Equation simulations.
A hydrogel-based set of 8 phantom vials were made to span the T1 and T2 of the bile and the liver (Liver: T1=809ms, T2=35ms, Bile: T1=1315ms, T2=675ms). MnCl2 and NiCl2 were added to adjust T2 and T1, respectively.
The vials were scanned with the proposed sequence with this parameters: TR/TE=5/1.5 ms, flip angle=25°, and RF phase increment $$$\Delta\phi$$$ = 0.3°.
The brains of healthy volunteers were also imaged after obtaining Institutional Review Board (IRB) approval and written informed consent.
Results
The reference T1 and T2 were measured using the Inversion Recovery (IR) and Spin Echo (SE) sequences and the values are (T1/T2 [ms]): Top row: 902/97ms, 1338/86ms, 817/36ms, 191/16ms, Bottom row: 1578/681ms, 1585/583ms, 1187/369ms, 1163/285ms.Phase difference images, the magnitude image, and the cross product image are shown in Fig. 4.
In Fig. 5, heavily T2-weighted fluid sensitive imaging of the brain shows good suppression of white and gray matter, with bright CSF in the subarachnoid space. The phase difference is shown in Fig. 5A and the magnitude of the RF phase modulated GRE image is shown in Fig. 5B, and the cross product image that appears as a heavily T2-weighted image is shown in Fig. 5C.
Discussion and Conclusion
In this work, we have optimized and validated an RF modulated phase-based GRE method for heavily T2 weighted imaging. We have performed Bloch equation simulations to optimize the choice of flip angle and RF phase increment, and to demonstrate the principle behind the cross-product strategy to calculate a T2 weighted image from the RF phase modulated GRE data. We validated these results in phantoms with long T2 values, and demonstrated the feasibility of the method in the brain of a healthy volunteer demonstrating the feasibility of this method to generate heavily T2 weighted fluid sensitive imaging.Additional work is needed to validate this strategy further in vivo, as well as applications such as heavily T2 weighted abdominal MRI.
Acknowledgements
No acknowledgement found.References
[1] Wang X, Hernando D, Reeder SB. Phase-based T2 mapping with gradient echo imaging. 2020 Magnetic Resonance in Medicine; 84:609–619.Figures
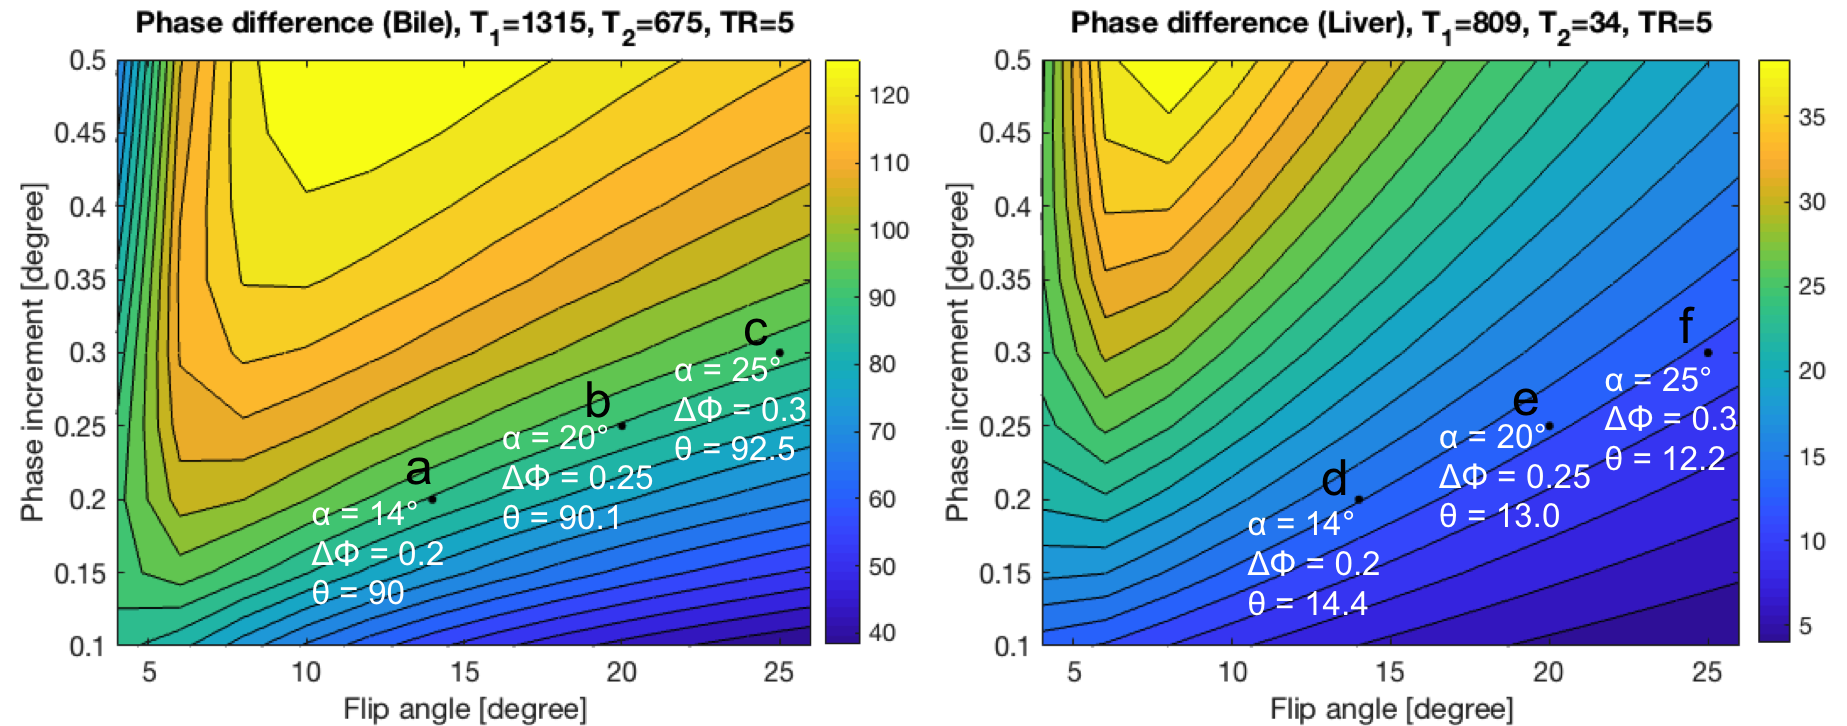
Fig. 1 The phase difference, θ, of two data sets $$$(-\Delta\phi$$$ and$$$+\Delta\phi)$$$ is plotted for a range of flip angle, α, (X-axis) and phase increment, ΔΦ, (Y-axis). The optimum flip angle and phase increment that creates a phase difference of about 90° for the bile is marked with three points (a,b,c). The equivalent points have smaller phase difference of ≈13° for the liver shown with points (d,e,f).
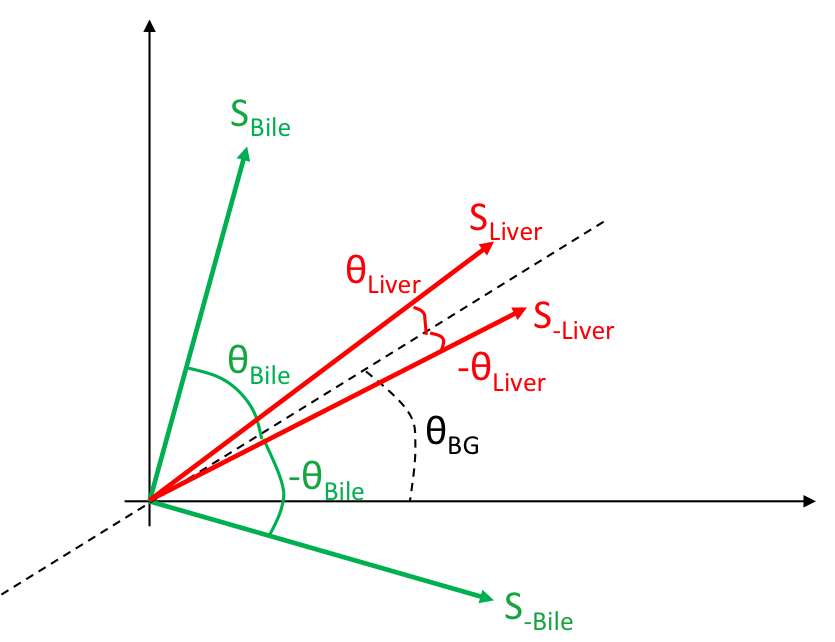
Fig. 2 The signal for two data sets $$$(-\Delta\phi$$$ and$$$+\Delta\phi)$$$ is shown in the complex plane for Bile ( in green) and Liver ( in red) tissue. $$$\theta_{BG}$$$ is the background phase. The cross product of the two vectors that have a smaller angle ( $$$S_{Liver}$$$ and $$$S_{-Liver}$$$) will be smaller than the bile $$$S_{Bile}$$$ and $$$S_{-Bile}$$$.
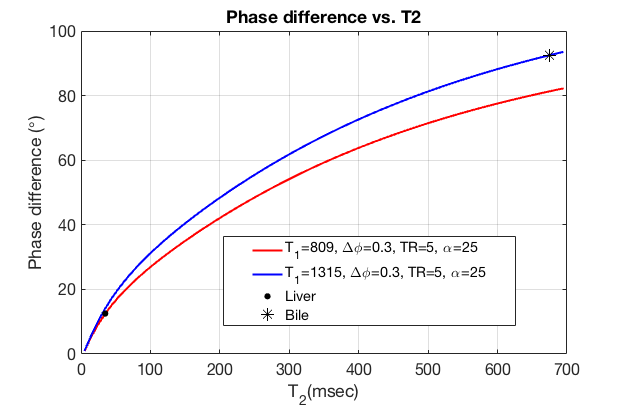
Fig. 3 Using Bloch equation simulations, the phase difference of two RF phase modulated GRE acquisitions demonstrates a large difference between the phase of short and long T2 species, such as liver (red) and bile (blue). For this simulation, we assume TR=5ms, an RF phase increment of ΔΦ=0.3°, Flip angle,α=25°, and T1 of bile (1315 ms) and liver (809 ms).
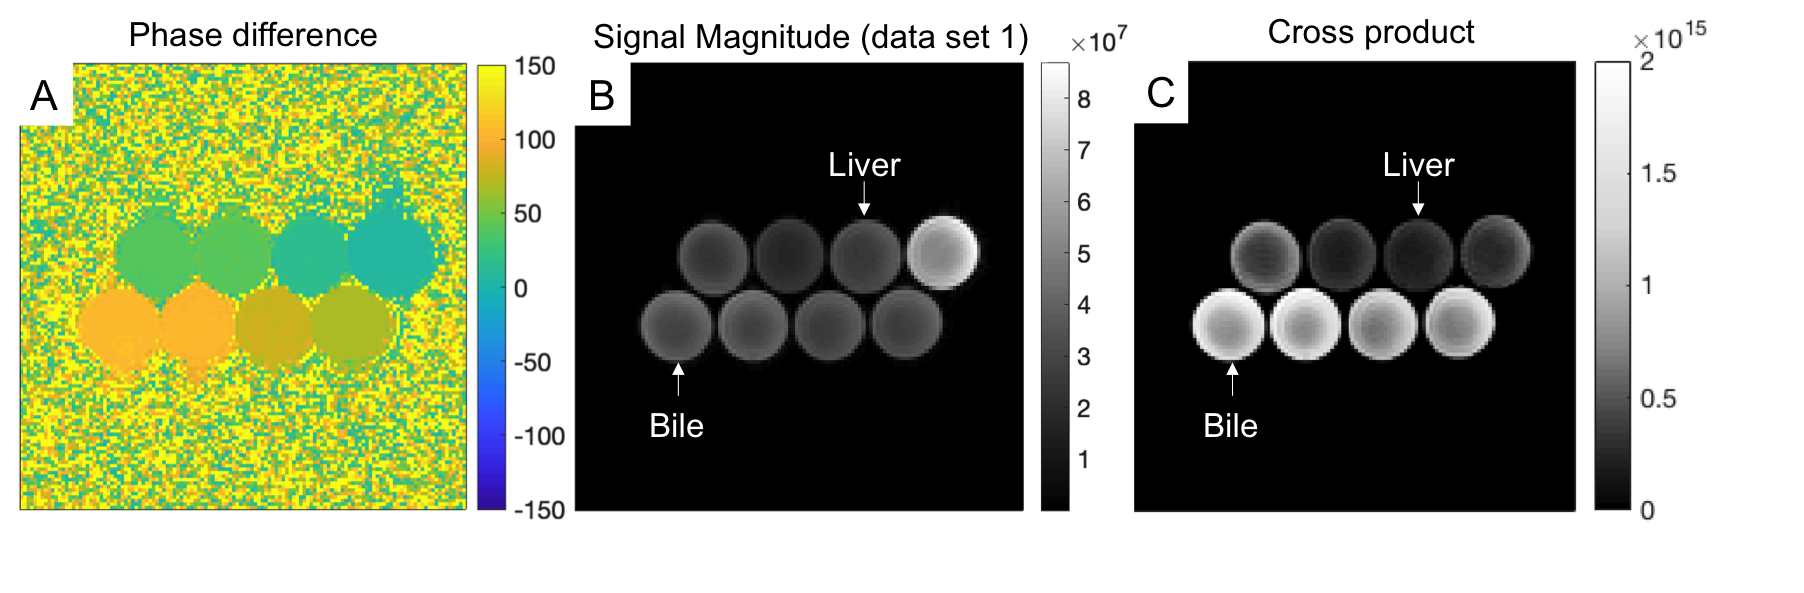
Fig. 4 The cross-product of two RF modulated GRE data sets, acquired with ±0.3° phase increment to maximize encoding of long T2 signals demonstrated the ability to suppress short T2 tissue (eg. liver) and highlight long T2 tissue (eg. bile). Shown are A) the phase difference image, B) the magnitude of the GRE signal for one of the data sets, and C) the cross product.
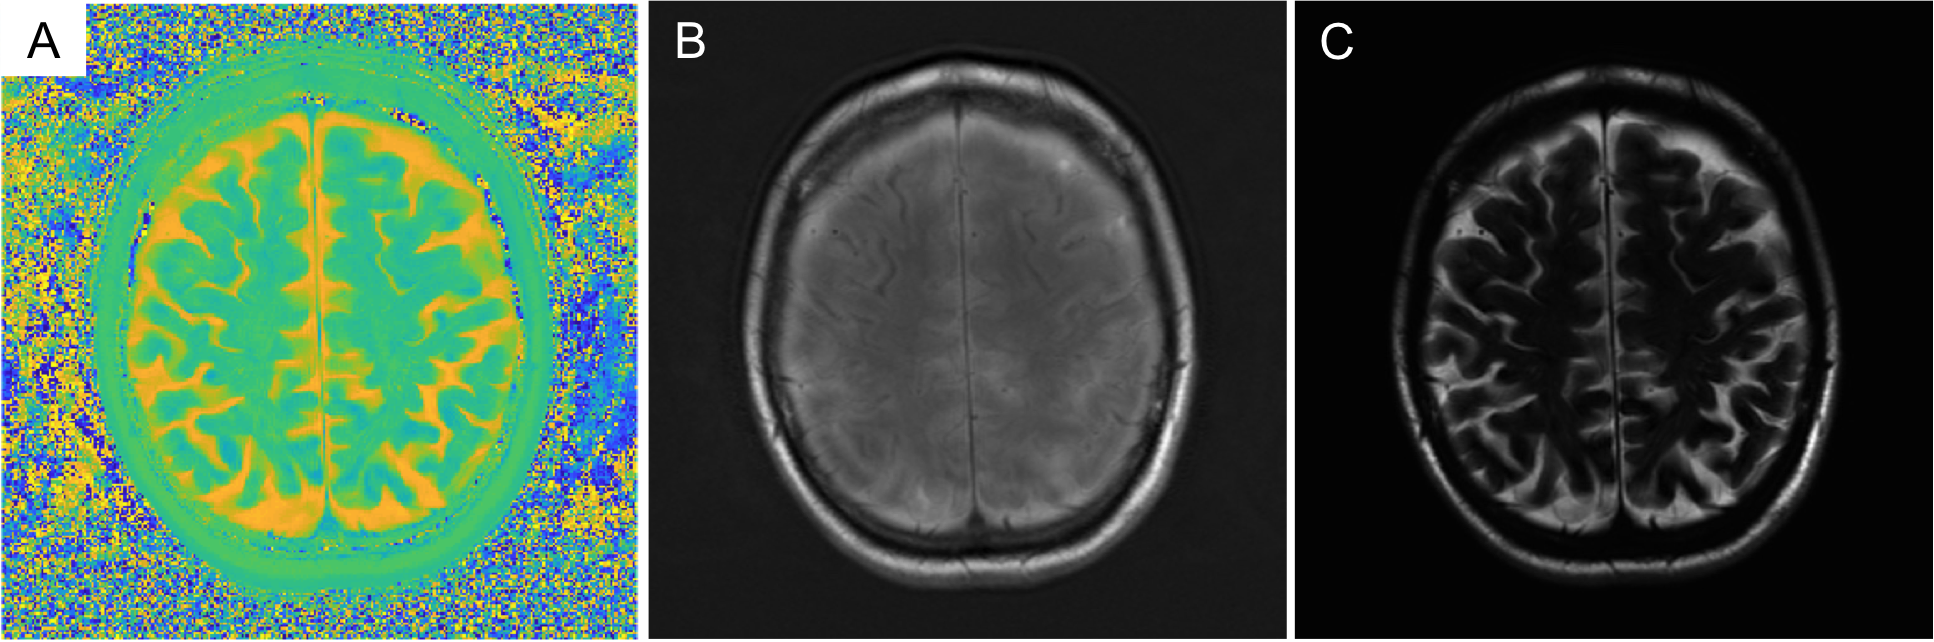
Fig. 5 Heavily T2-weighted fluid sensitive imaging of the brain shows good suppression of white and gray matter, with bright CSF in the subarachnoid space. Shown is A) the phase difference image, B) the magnitude of the RF phase modulated GRE image, and C) the cross product image that appears as a heavily T2-weighted image.