0239
Quantitative sodium and diffusion imaging of mild traumatic brain injury: regional analysis findings
Anna M Chen1, Teresa Gerhalter1, Seena Dehkharghani1,2, Rosemary Peralta1, Fatemeh Adlparvar1, James S Babb1, Tamara Bushnik3, Jonathan M Silver4, Brian S Im3, Stephen P Wall5, Ryan Brown1,6, Steven Baete1,6, Ivan I Kirov1,2,6, and Guillaume Madelin1
1Center for Biomedical Imaging, Department of Radiology, New York University Grossman School of Medicine, New York, NY, United States, 2Department of Neurology, New York University Grossman School of Medicine, New York, NY, United States, 3Department of Rehabilitation Medicine, New York University Grossman School of Medicine, New York, NY, United States, 4Department of Psychiatry, New York University Grossman School of Medicine, New York, NY, United States, 5Ronald O. Perelman Department of Emergency Medicine, New York University Grossman School of Medicine, New York, NY, United States, 6Center for Advanced Imaging Innovation and Research, Department of Radiology, New York University Grossman School of Medicine, New York, NY, United States
1Center for Biomedical Imaging, Department of Radiology, New York University Grossman School of Medicine, New York, NY, United States, 2Department of Neurology, New York University Grossman School of Medicine, New York, NY, United States, 3Department of Rehabilitation Medicine, New York University Grossman School of Medicine, New York, NY, United States, 4Department of Psychiatry, New York University Grossman School of Medicine, New York, NY, United States, 5Ronald O. Perelman Department of Emergency Medicine, New York University Grossman School of Medicine, New York, NY, United States, 6Center for Advanced Imaging Innovation and Research, Department of Radiology, New York University Grossman School of Medicine, New York, NY, United States
Synopsis
27 mTBI patients and 19 controls were scanned at 3T. Total sodium concentration (TSC), fractional anisotropy (FA) and apparent diffusion coefficient (ADC) were measured with voxel averaging in 12 grey and white matter regions-of-interest (ROIs). Patients had lower mean TSC than controls across all ROIs, however, statistical significance was only reached in the caudate. Statistically significant FA differences also occurred in only one region, frontal white matter (WM), while none were observed for ADC. TSC changes existed in mTBI and occurred with similar frequency as FA, but the FA finding had a higher effect size, and correlated with symptoms.
Introduction
Traumatic brain injury (TBI) is a prevalent cause of neurological disability1. Even mild TBI (mTBI) may produce a range of physical, psychiatric, and cognitive consequences2. Clinical management and prognosis of mTBI are hampered by the low sensitivity of conventional CT and MRI to occult but potentially clinically significant damage in mTBI3. Since the pathological cascade of tissue damage in mTBI is initiated by ionic dysregulation4,5, we used sodium (23Na) MRI to detect regional changes in brain sodium homeostasis6 with the addition of diffusion imaging to serve as “positive control”, given the novelty of 23Na MRI in TBI. Our initial hypotheses for this study were that total sodium concentration (TSC): (i) is higher in mTBI patients than in controls, as often observed in brain pathologies such as stroke, brain tumor, and multiple sclerosis6, and (ii) correlates with clinical presentation and neuropsychological function.Materials & Methods
Twenty-seven mTBI patients (20 female, 35.9±12.2 years) within two months after injury and nineteen age- and gender-matched healthy controls underwent scanning at 3T (MAGNETOM Prisma, Siemens). Imaging parameters are outlined in Table 1A. Proton (1H) imaging was performed with a 20-channel head coil with the following sequences: high-resolution MPRAGE, FLAIR, and SWI for anatomical localization and qualitative screening, and DTI (mono-polar gradient pulse EPI with nine b0 images, six diffusion directions at b=250 s/mm2, sixty diffusion directions at b=1000 and 2000 s/mm2, GRAPPA 2, Multiband acceleration 2). 23Na imaging was performed with an in-house 1H/23Na dual-tuned birdcage head coil. A low-resolution MPRAGE image was acquired with the 1H channel for co-registration. Spin-density weighted sodium images were acquired using an ultrashort-TE 3D non-Cartesian FLORET sequence8 (3 hubs at 45°, number of interleaves/hub=26), and reconstructed offline6,9. TSC maps of the brain were computed using the vitreous humour as an internal reference (TSC=140 mM10,11, no relaxation correction). DTI post-processing was performed offline using FSL12 and MRTrix3.013 software. Twelve region-of-interest (ROI) masks were extracted from the high-resolution MPRAGE image and used to obtain ROI voxel-averaged values of TSC, fractional anisotropy (FA), and apparent diffusion coefficient (ADC) (Fig. 1). All mTBI patients underwent clinical and neurocognitive testing with the Rivermead Post-Concussion Symptoms Questionnaire (RPQ)15 and the Brief Test of Adult Cognition by Telephone (BTACT)16. Patients and controls were compared using the exact Mann-Whitney (MW) test. Spearman rank correlations with and without adjustment for elapsed time from injury were used to assess the association between imaging measures and BTACT and RPQ. Statistical significance was defined as p<0.05.Results
Demographics and patient outcome measures are compiled in Table 1B. Examples of TSC, FA and ADC maps, alongside co-registered white matter (WM) masks, are shown in Fig. 2. Boxplots of TSC, ADC, and FA distributions in mTBI patients and controls are presented in Fig. 3. The only statistically significant difference in TSC was in the caudate, which showed lower TSC in mTBI patients compared to controls (p=0.05). Nevertheless, mTBI patients showed lower mean and median TSC values compared to controls across all ROIs. The Cohen’s d for these TSC differences between the two cohorts (across all ROIs) ranged from -0.02 to -0.59, with the largest effect sizes in the caudate and global cortical grey matter (GM) (Cohen’s d>|0.5|). ADC showed no statistical differences between groups. FA was normal across all regions in mTBI, except for the frontal WM, which showed lower FA (p=0.019), with a large effect size (Cohen’s d=-0.82). Correlations between TSC, FA, ADC and symptomatology (RPQ) and neuropsychological (BTACT) assessments are shown in Table 2. Correlations were found between genu of corpus callosum (CC) TSC and RPQ. Frontal WM FA, which was different between mTBI patients and controls, also correlated with the RPQ. FA in three other regions showed negative and positive correlations with BTACT and RPQ, with the strongest correlation between caudate FA and the BTACT word recall subtest (Direct, r=-0.52, p=0.007). ADC in two regions, genu of CC and cortical GM, showed correlations with BTACT subtests.Discussion & Conclusion
We evaluated the potential of 23Na MRI for providing quantitative regional information related to changes in ionic homeostasis in patients with mTBI. ROIs included cortical and deep GM to account for cognitive and somatic deficits, as well as regional and global WM for detecting the hallmark axonal injury and comparing with benchmark WM diffusion data. The main findings are that sodium imbalances: (i) were detected in vivo after mTBI; (ii) occurred at the same frequency as FA changes; (iii) are of lower, rather than higher TSC in mTBI; (iv) may require acquisitions or post-processing with higher sensitivity in order to increase the statistical power of trends suggesting overall lower TSC in mTBI. Our results suggest that TSC has the potential to have an impact in understanding disease mechanisms and contributing to clinical biomarkers. However, we note that the FA finding had a larger effect size, and FA showed a larger number of correlations with clinical presentation and neuropsychological function (Table 2). Finally, a possible explanation for the lower TSC in mTBI patients could be a cell swelling-induced increase in intracellular volume that offsets the effect of abnormal sodium influx during TBI5.Acknowledgements
This work was supported by grants R01EB028774, R01NS097494 and R01EB026456 from the National Institutes of Health (NIH).References
- Dewan MC, Rattani A, Gupta S, et al. Estimating the global incidence of traumatic brain injury. J Neurosurg. 2019;130(4):1080-1097. doi:10.3171/2017.10.JNS173522.
- Maas AIR, Menon DK, Adelson PD, et al. Traumatic brain injury: integrated approaches to improve prevention, clinical care, and research. Lancet Neurol. 2017;16(12):987-1048. doi:10.1016/S1474-4422(17)30371-X3.
- Blennow K, Brody DL, Kochanek PM, et al. Traumatic brain injuries. Nat Rev Dis Prim. 2016;2(1):16084. doi:10.1038/nrdp.2016.844.
- Povlishock JT, Katz DI. Update of Neuropathology and Neurological Recovery After Traumatic Brain Injury. J Head Trauma Rehabil. 2005;20(1):76-94. doi:10.1097/00001199-200501000-000085.
- Liang D, Bhatta S, Gerzanich V, Simard JM. Cytotoxic edema: mechanisms of pathological cell swelling. Neurosurg Focus. 2007;22(5):1-9. doi:10.3171/foc.2007.22.5.36.
- Madelin G, Regatte RR. Biomedical applications of sodium MRI in vivo. J Magn Reson Imaging. 2013;38(3):511-529. doi:10.1002/jmri.241687.
- Gerhalter T, Peralta R, Tordjman M et al. Quantitative 23Na MRI of mild traumatic brain injury: Initial findings. In: ISMRM. ; 2020:0921.8.
- Pipe JG, Zwart NR, Aboussouan EA, Robison RK, Devaraj A, Johnson KO. A new design and rationale for 3D orthogonally oversampled k-space trajectories. Magn Reson Med. 2011;66(5):1303-1311. doi:10.1002/mrm.229189.
- Gilles A, Nagel AM, Madelin G. Multipulse sodium magnetic resonance imaging for multicompartment quantification: Proof-of-concept. Sci Rep. 2017;7(1):17435. doi:10.1038/s41598-017-17582-w10.
- Boicelli C a, Giuliani a M. Sodium ion distribution in the vitreous body. MAGMA. 1996;4(3-4):241-245.11.
- Garner WH, Hilalt SK, Lees S, Spector A. Sodium-23 magnetic resonance imaging of the eye and lens. Proc Natl Acad Sci USA. 1986;83(March):1901-1905.12.
- Jenkinson M, Beckmann CF, Behrens TEJ, Woolrich MW, Smith SM. FSL. Neuroimage. 2012;62(2):782-790. doi:10.1016/j.neuroimage.2011.09.01513.
- Tournier J-D, Smith R, Raffelt D, et al. MRtrix3: A fast, flexible and open software framework for medical image processing and visualisation. Neuroimage. 2019;202(January):116137. doi:10.1016/j.neuroimage.2019.11613714.
- Wilson JT, Pettigrew LE, Teasdale GM. Structured interviews for the Glasgow Outcome Scale and the extended Glasgow Outcome Scale: guidelines for their use. J Neurotrauma. 1998;15(8):573-585. doi:10.1089/neu.1998.15.57315.
- King NS, Crawford S, Wenden FJ, Moss NEG, Wade DT. The Rivermead Post Concussion Symptoms Questionnaire: a measure of symptoms commonly experienced after head injury and its reliability. J Neurol. 1995;242(9):587-592. doi:10.1007/BF0086881116.
- Tun PA, Lachman ME. Telephone assessment of cognitive function in adulthood: The Brief Test of Adult Cognition by Telephone [3]. Age Ageing. 2006;35(6):629-632. doi:10.1093/ageing/afl09517.
- Eyres S, Carey A, Gilworth G, Neumann V, Tennant A. Construct validity and reliability of the Rivermead Post-Concussion Symptoms Questionnaire. Clin Rehabil. 2005;19(8):878-887. doi:10.1191/0269215505cr905oa18.
- Smith-Seemiller L, Fow NR, Kant R, Franzen MD. Presence of post-concussion syndrome symptoms in patients with chronic pain vs mild traumatic brain injury. Brain Inj. 2003;17(3):199-206. doi:10.1080/026990502100003082319.
- Ryff C, Almeida D, Ayanian J, et al. Midlife in the United States (MIDUS 3), 2013-2014.; 2013. doi:10.3886/ICPSR36346.v720.
- Fischl B. FreeSurfer. Neuroimage. 2012;62(2):774-781. doi:10.1016/j.neuroimage.2012.01.02121.
- Rusinek H, Glodzik L, Mikheev A, Zanotti A, Li Y, De Leon M. Fully automatic segmentation of white matter lesions: error analysis and validation of a new tool. In: Intern J Computer Assisted Radiology & Surgery. ; 2013:289-291.
Figures
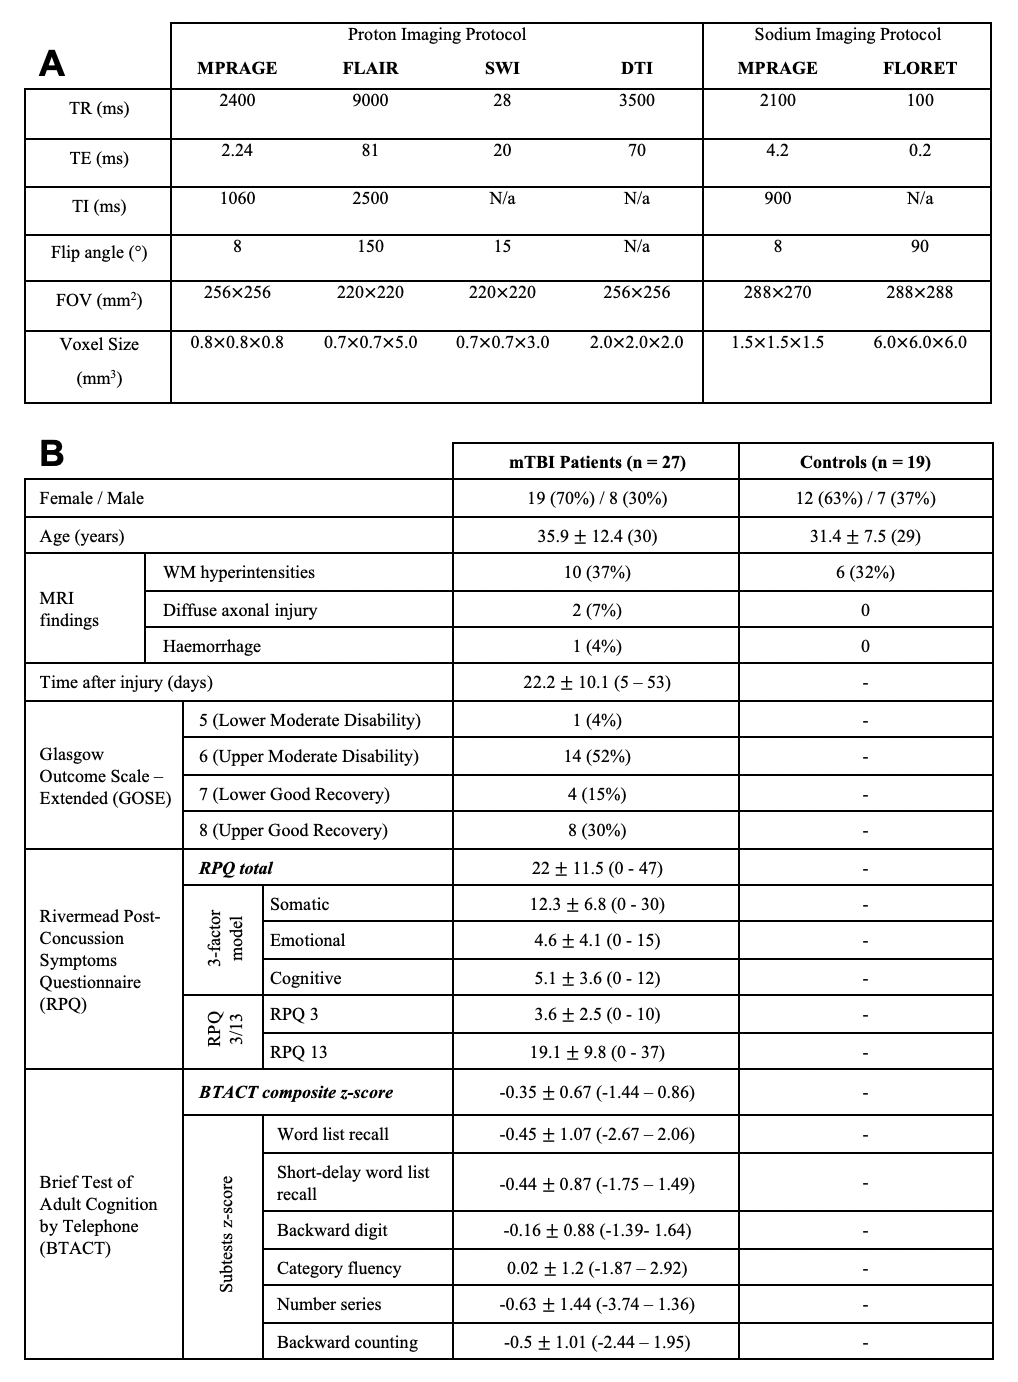
Table 1: Imaging parameters (A), demographics, and clinical characteristics of study population (B). Median value, range or percentage of population are presented in parentheses. The Rivermead Post-Concussion Symptoms Questionnaire (RPQ) was analyzed according to different classification methods: the RPQ total score15, the RPQ 3 and RPQ 1317, and the three-factor model18. The Brief Test of Adult Cognition by Telephone (BTACT) sub-test z-scores were derived from normative data19 and averaged to obtain a composite (total) z-score of cognitive function.
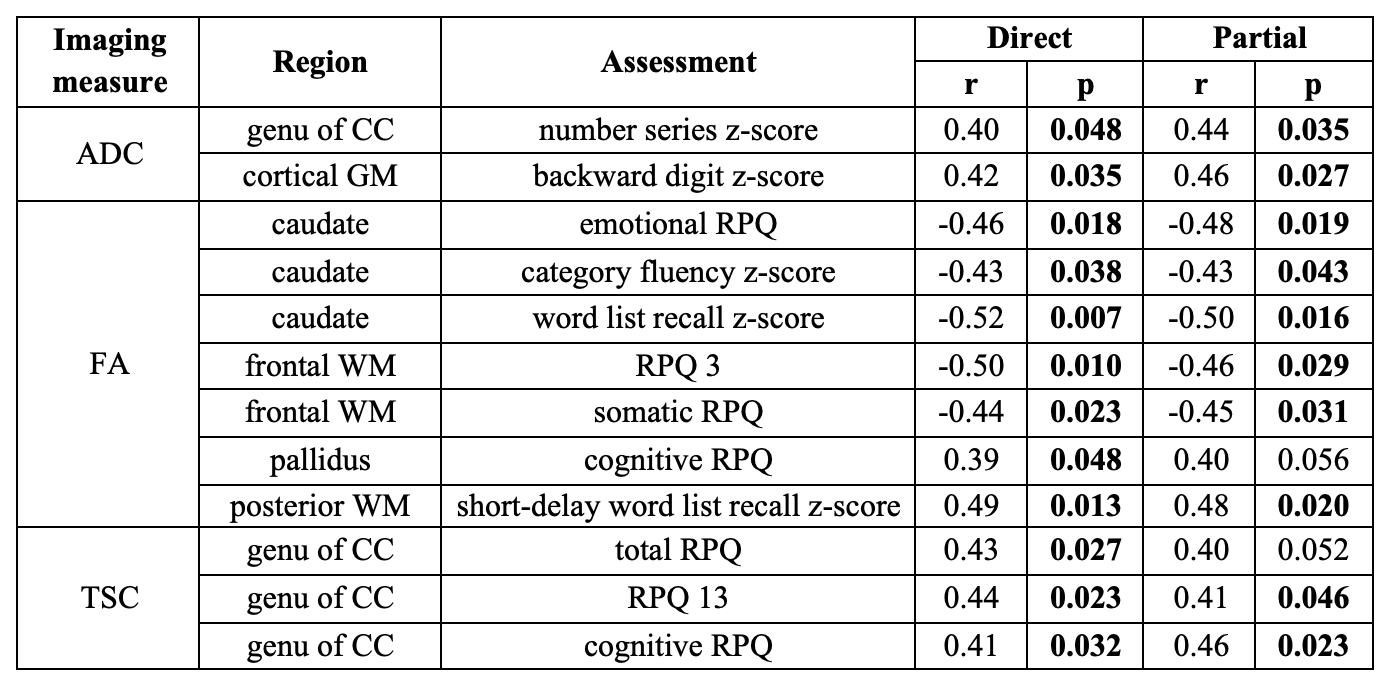
Table 2: Spearman correlations (r) and p values between MRI measures and patient outcome assessments. Imaging measures were associated with Brief Test of Adult Cognition by Telephone (BTACT) z-scores and Rivermead Post-Concussion Symptoms Questionnaire (RPQ) scores without (direct) and with (partial) adjustment for the elapsed time from injury to imaging. Shown are only those associations in which at least one of the direct and the partial correlations was statistically significant (bold). CC: corpus callosum.
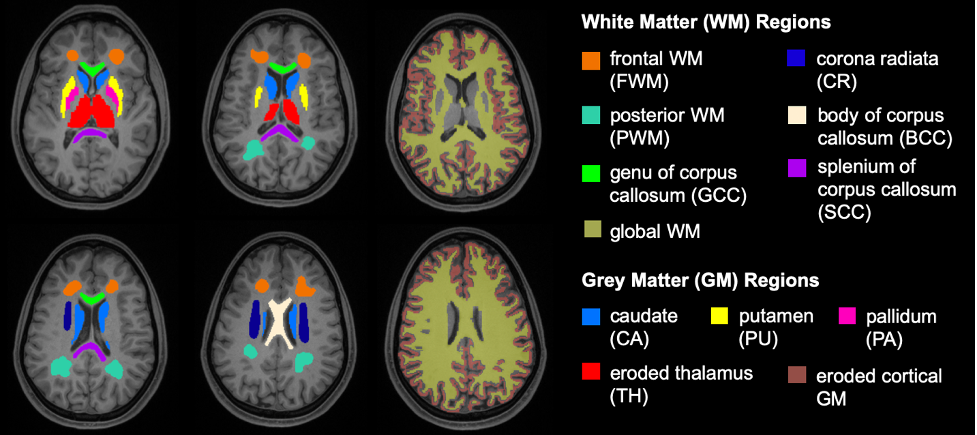
Figure 1: Regional analysis of grey and white matter. T1-weighted axial MPRAGE images overlaid with the 12 ROIs in which TSC, FA, and ADC were quantified. Four bilateral GM structures (thalamus, caudate, putamen, and pallidum), as well as the global WM and cortical GM, were automatically segmented using FreeSurfer version 6.0.020, and six bilateral WM regions were manually outlined using FireVoxel21 (frontal WM, posterior WM, corona radiata, and body, splenium, and genu of CC). The cortical GM and thalamus masks shown have been eroded by one voxel to decrease CSF partial volume.
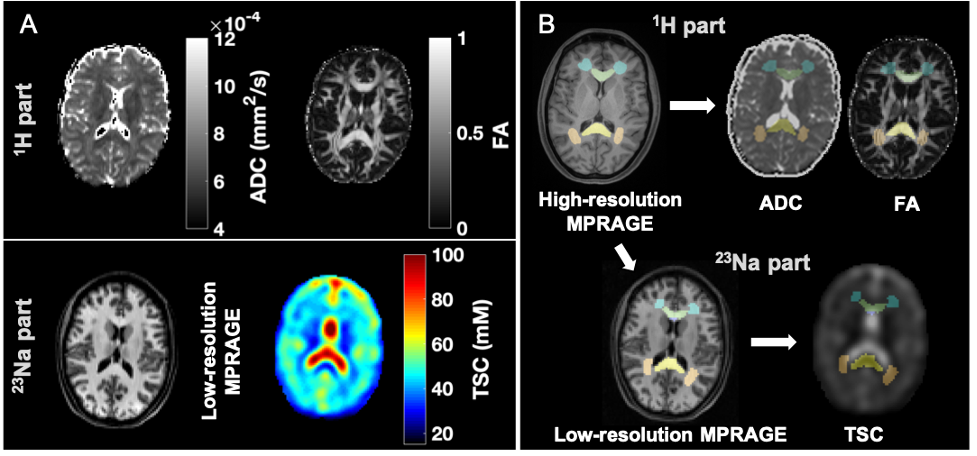
Figure 2: Example of multimodal image segmentation and registration. A) Top: During the 1H session, apparent diffusion coefficient (ADC) and fractional anisotropy (FA) maps were obtained. Bottom: During the 23Na session, total sodium concentration maps (TSC) and low-resolution MPRAGE images for registration were acquired. B) ROIs were obtained from the high-resolution MPRAGE, then registered to the TSC using the low-resolution MPRAGE and to the diffusion maps using the diffusion-b0 image.
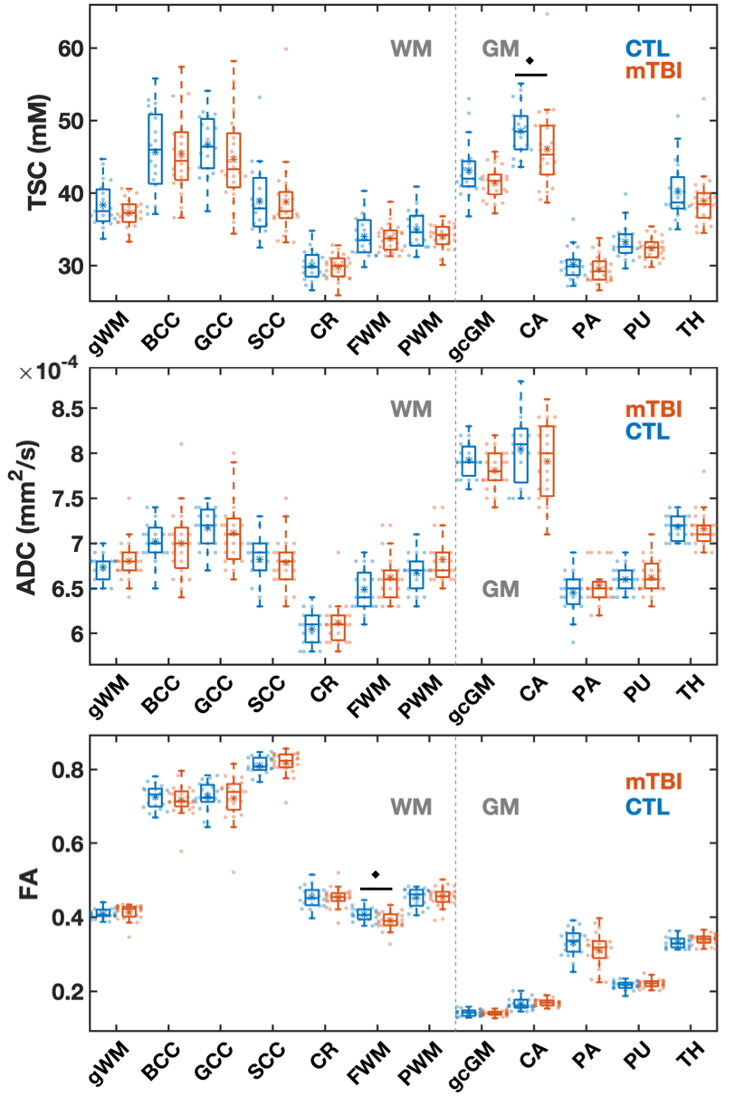
Figure 3: Boxplots of TSC, ADC, and FA distributions in mTBI and control (CTL) groups. Boxplots exclude the three oldest mTBI patients who lacked age-matched controls. FWM FA and caudate TSC were lower in mTBI patients compared to controls (MW, ♦: p<0.05). Note that nine out of 12 ROIs revealed lower median TSC values in mTBI patients compared to controls. gWM: global WM; CC: corpus callosum; BCC: body of CC; GCC: genu of CC; SCC: splenium of CC; CR: corona radiata; FWM: frontal WM; PWM: posterior WM; gcGM: global cortical GM; CA: caudate; PA: pallidus; PU: putamen; TH: thalamus.