0238
Quantitative Sodium MRI of the Human Kidney at 7T Applying Respiratory Sorting1Medical Physics in Radiology, German Cancer Research Center (DKFZ), Heidelberg, Germany, 2University Hospital Erlangen, Institute of Radiology, Friedrich‐Alexander‐Universität Erlangen‐Nürnberg (FAU), Erlangen, Germany
Synopsis
Sodium (23Na) plays an important role in many cellular processes, making it an interesting nuclei to investigate using MRI. Low in-vivo signals and short relaxation times require high magnetic field strengths, dedicated hardware and pulse sequences as well as correction methods to obtain reliable tissue sodium concentrations. Therefore we compare the influence of different correction methods on 23Na concentration investigations in the human kidney and validate our methods with phantom measurements. We employ retrospective respiratory self‐gating for the quantitative 23Na images as well as for the acquired B1+ maps to reduce the influence of image blurring due to motion artifacts.
Introduction
The kidneys play a vital role in maintaining and balancing the fluid and electrolyte homeostasis in the human body, for which the extracellular sodium (23Na) control in the kidneys is essential. The challenges of sodium MRI of the torso are not only those of sodium imaging in general such as relatively low in-vivo concentrations, very short transversal relaxation times and the low NMR sensitivity of the 23Na nucleus compared with hydrogen (1H), resulting in a relatively low signal-to-noise ratio (SNR) in 23Na MR images, but also blurring due to respiratory and cardiac motion. Nevertheless, sodium MRI of the kidney has the potential to become a non-invasive biomarker for renal tissue function and viability1. To achieve this, a reliable way for data acquisition as well as data post processing is needed to account for factors influencing the determined 23Na concentration. For this we compare the influence of different correction methods on 23Na concentration investigations in the human kidney and validate our methods with phantom measurements. We employ retrospective respiratory self‐gating for the quantitative 23Na images as well as for the acquired B1+ maps to reduce the influence of image blurring due to motion artifacts.Methods
Quantitative sodium abdominal images were acquired for a phantom filled with NaCl solution (35mM) and one healthy volunteers (female, age: 31years, weight: 80kg, measured head first supine with hands above the head) on a 7T whole-body MR system (MAGNETOM 7T, Siemens Healthcare GmbH, Erlangen, Germany) with an oval-shaped birdcage coil with a large field of view of (400mm)3, custom-made for torso examinations2. Density-adapted 3D radial sampling3 and a golden angle projection distribution4 were applied with the following parameters: flip angle α=61°, TE/TR=1ms/150ms, nominal spatial resolution (∆x)3=(5mm)3, pulse duration tP=1.8ms, readout time tRO=5ms, number of projections nProj=16300. For concentration determination four reference vials with NaCl solutions (20mM, 40mM, 60mM, 120mM) were positioned under the back of volunteer to minimize the influence of respiratory motion and to ensure a consistent placing across all measurements. For the phantom measurements the vial concentrations were also chosen to fit the range of investigated concentrations (20mM, 30mM, 40mM, 50mM). To generate B1+ maps, the dual-angle method5 was applied (α=45°/90°, TE/TR=1.55ms/150ms, (∆x)3=(10mm)3 , tP=3ms, tRO=10ms, nProj=8200). The resulting total acquisition time was about 80min.Since the used coil does not share the exact same hardware for transmitting and receiving, the principle of reciprocity cannot be applied2,6. Thus, B1- maps of the applied radiofrequency (RF) coil were simulated in a phantom model (εr'=54, σ=0.43Sm-1) and in a human voxel model7,8 using the electromagnetic field simulation software CST Studio Suite 2019 (Dassault Systèmes, Vélizy-Villacoublay, France).
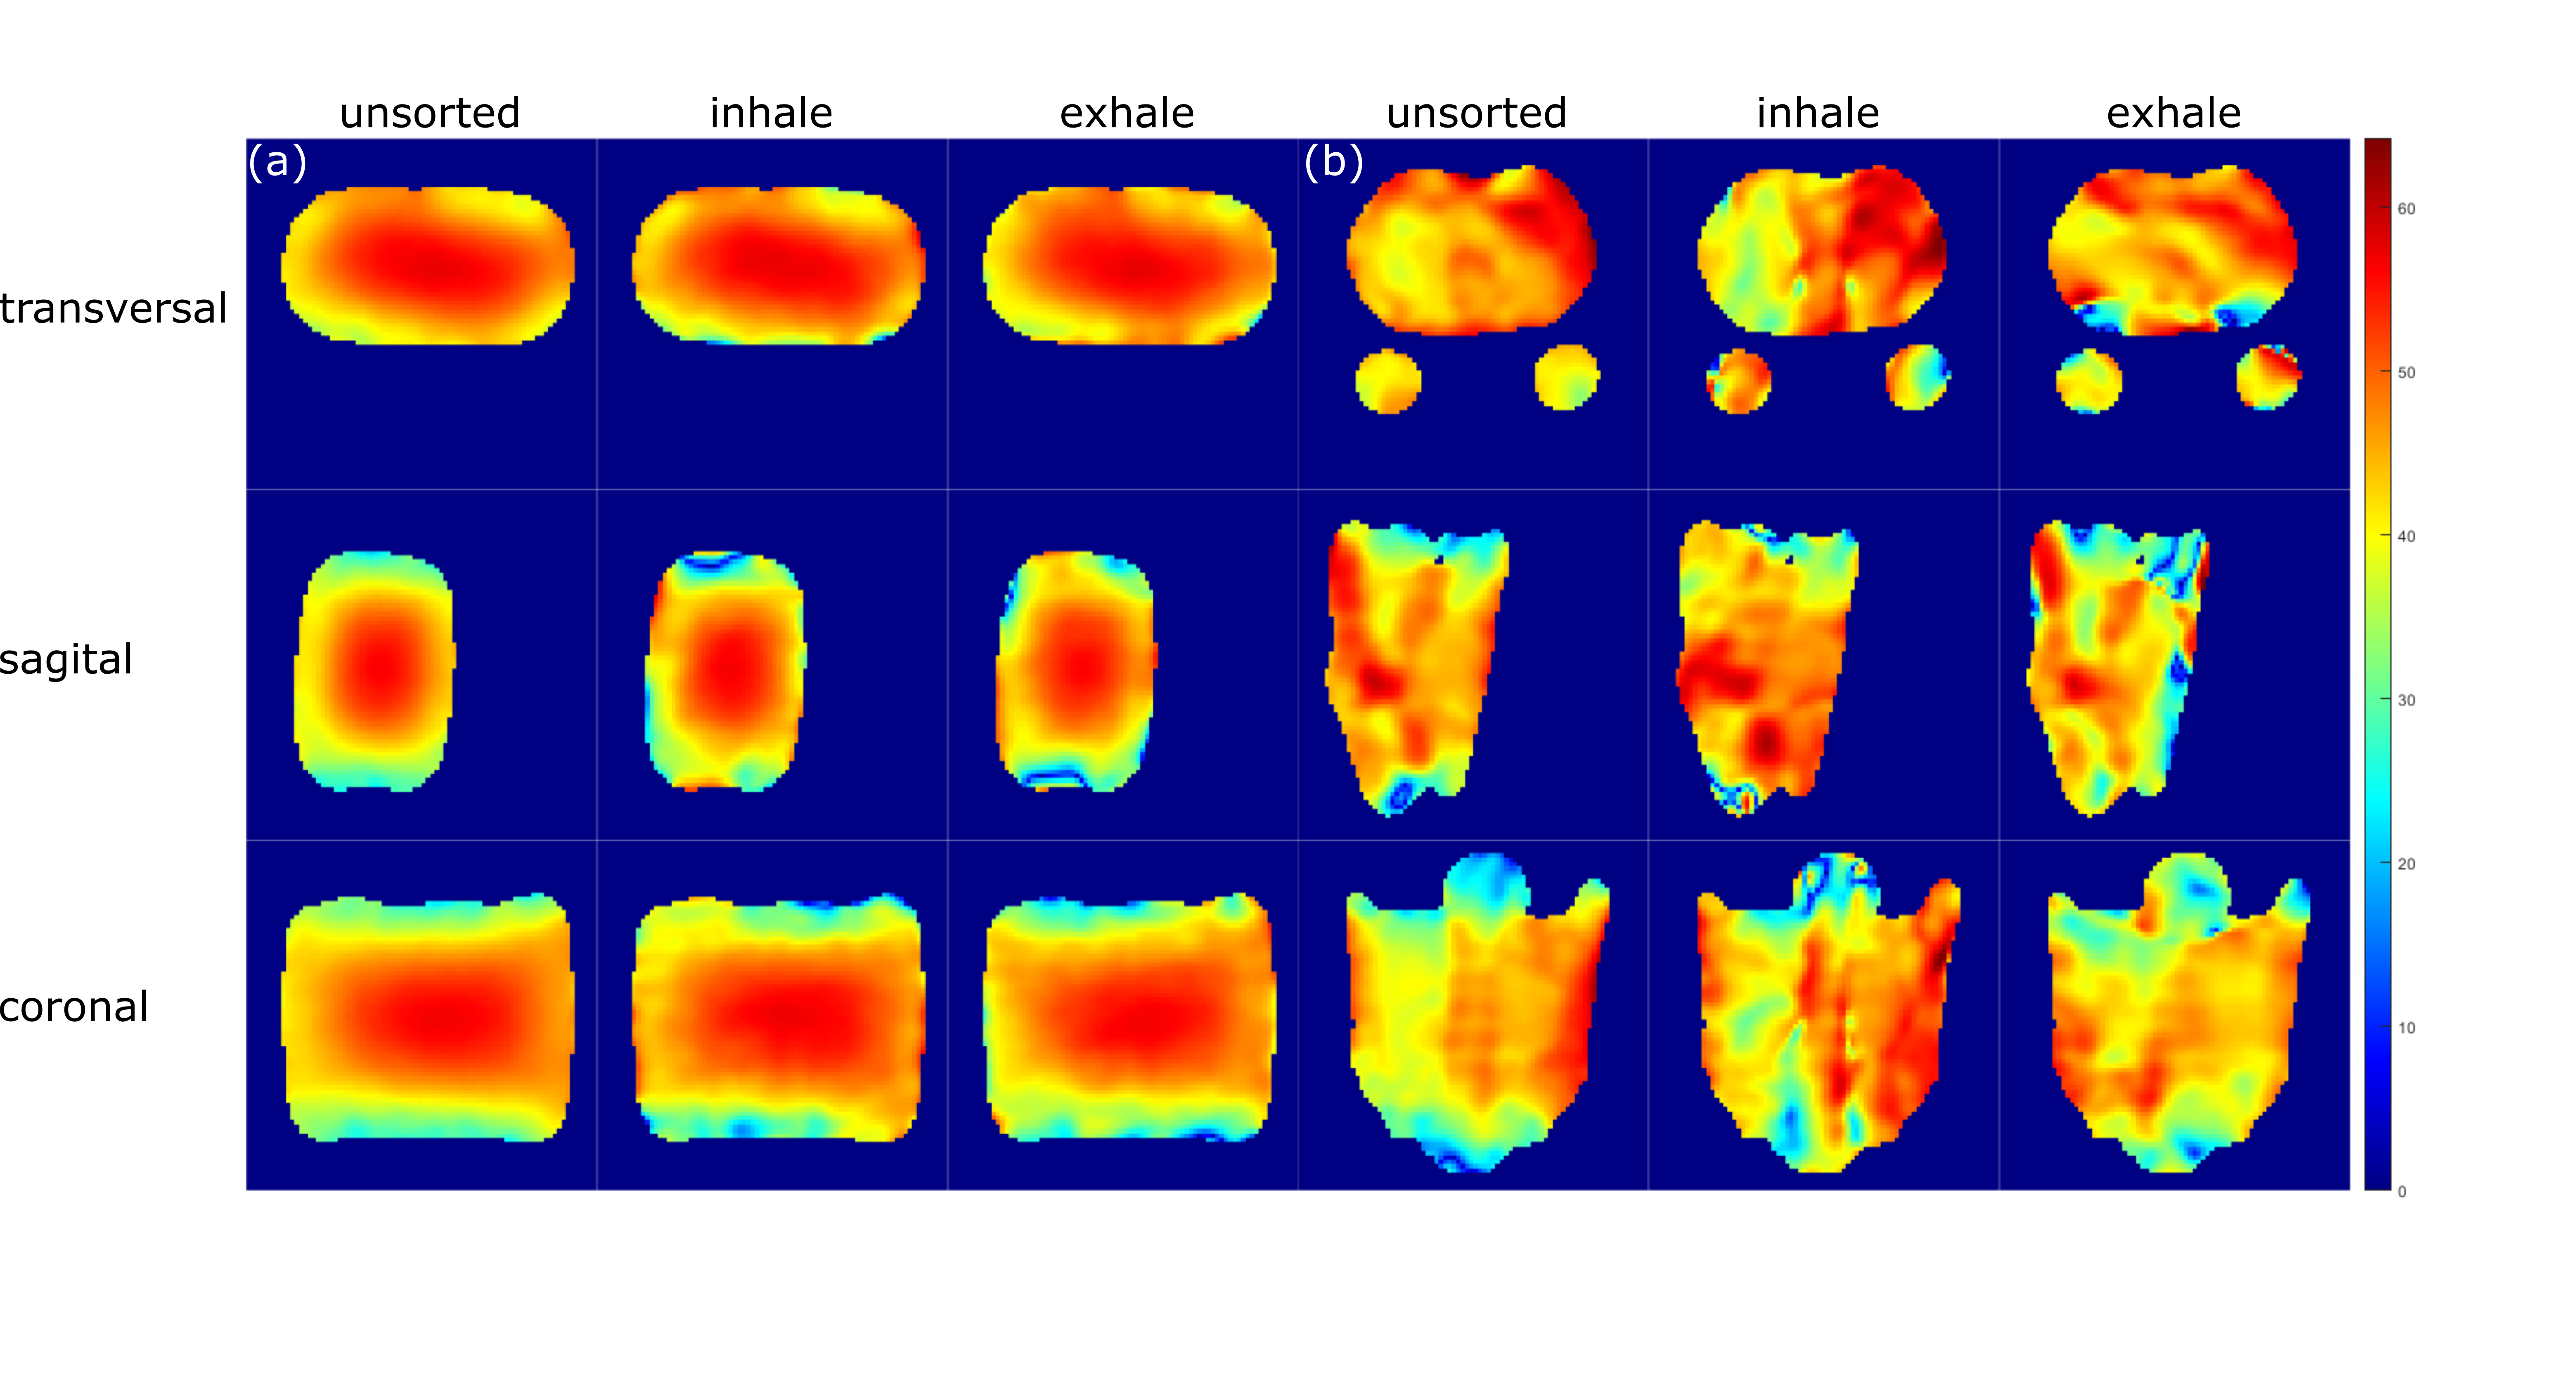
For both, spin density‐weighted images and B1+ maps, retrospective respiratory self‐gating was applied, sorting the projections into two respiratory states (inhaled and exhaled) based on the respiration-dependent signal changes in the k-space center2.
Datasets for B1+ maps were Gauss-filtered (σ=10mm), image data was filtered with a Hamming filter.
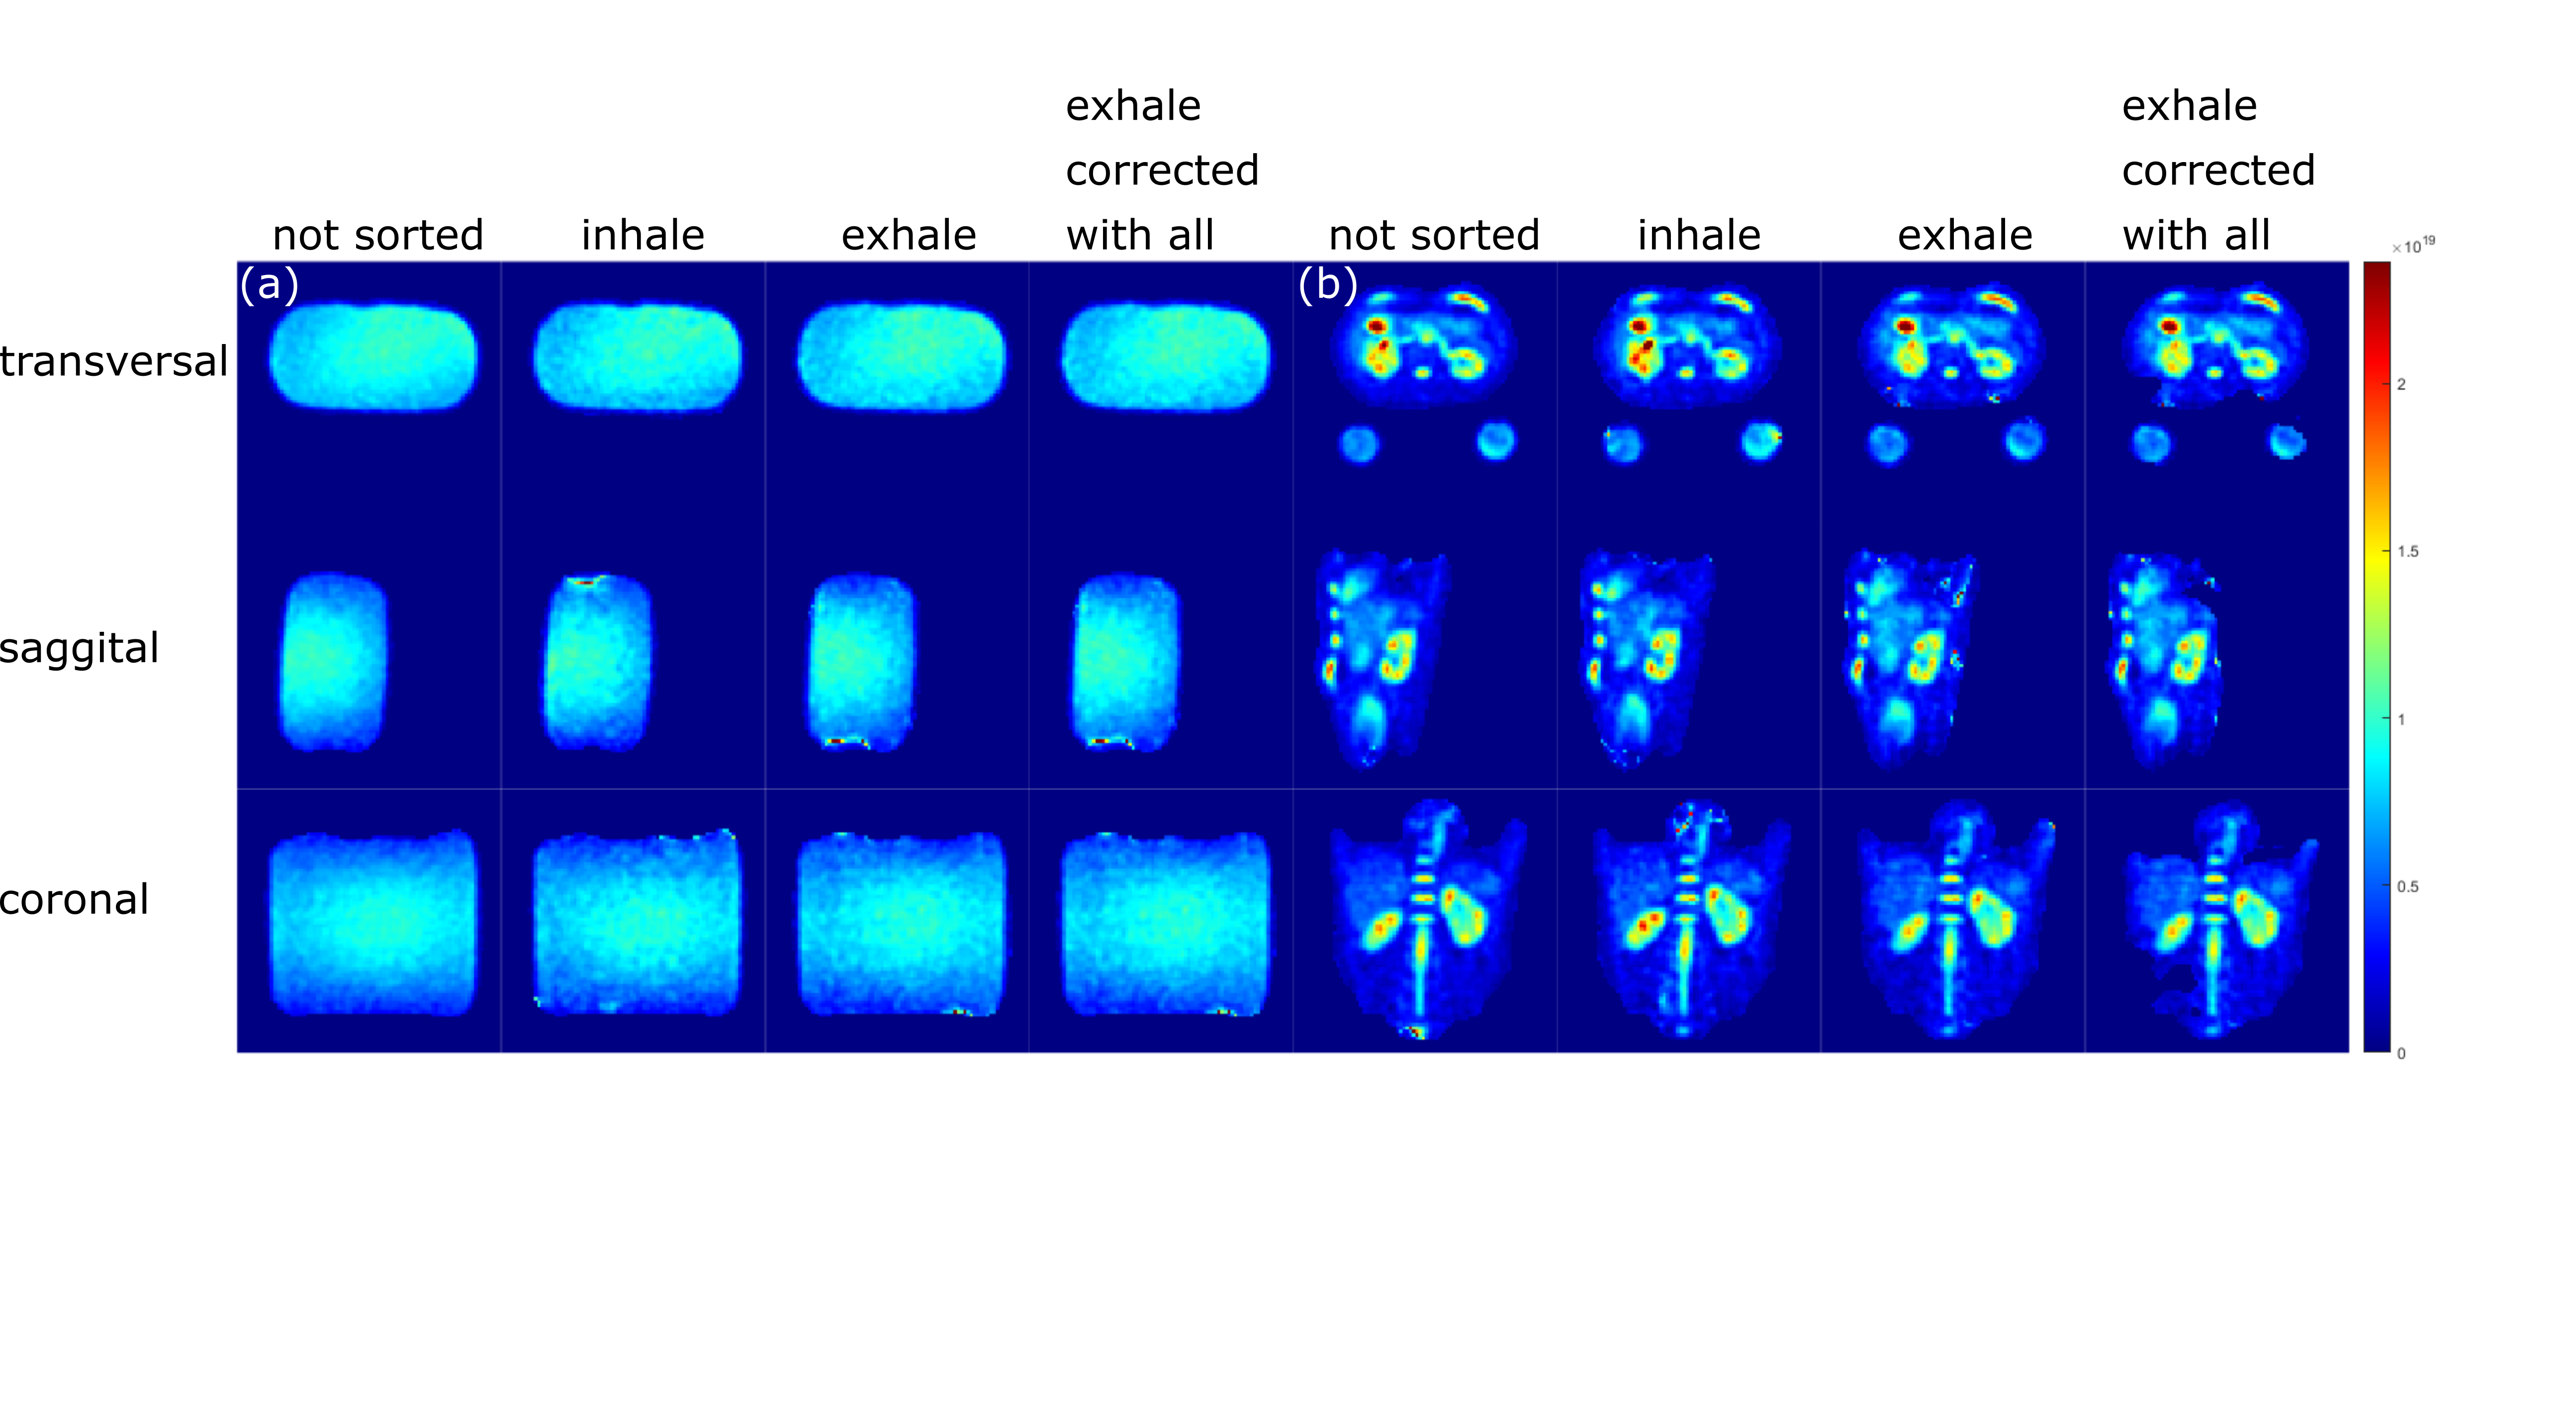
Full datasets and respiratory sorted datasets were reconstructed and B1+ corrected separately (see Fig.2) and the concentration was determined with a semi-automated segmentation tool developed in Matlab (The MathWorks Inc., Natick, MA, USA) using the known concentration in the reference vials and a linear fit. For the in-vivo data, region of interest (roi) for the whole kidneys were segmented in Matlab as well.
Results
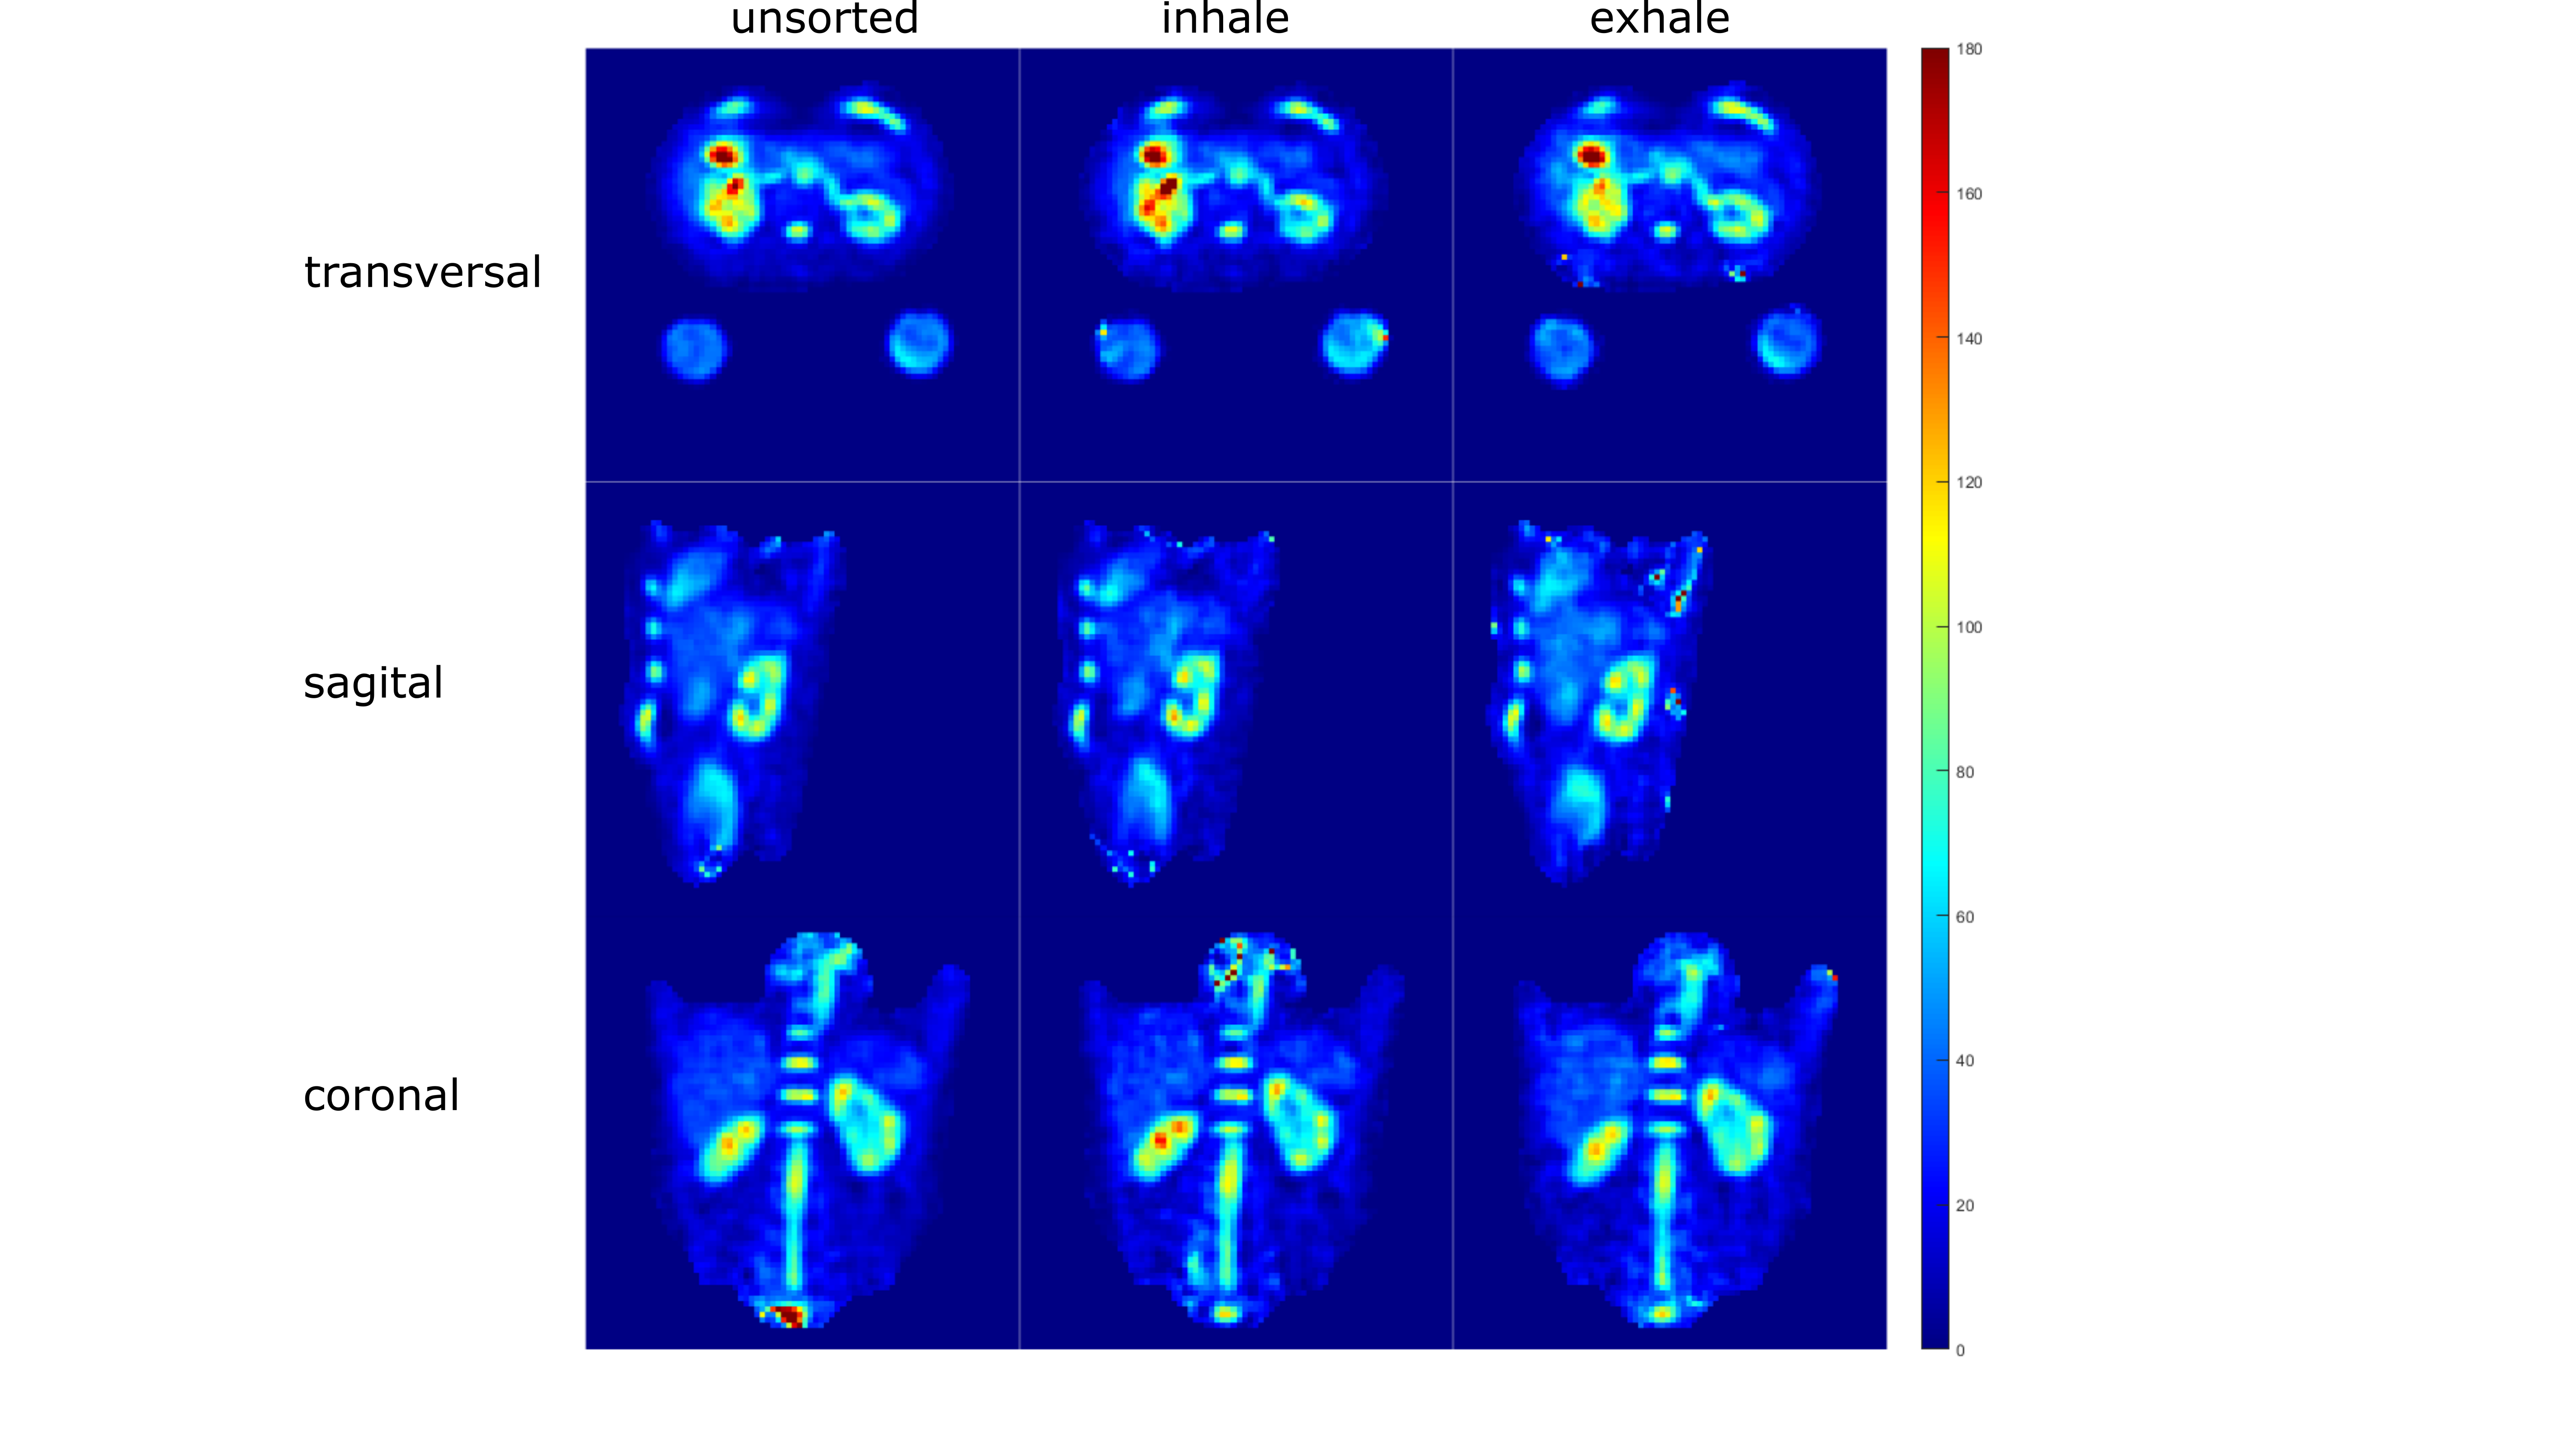
In-vivo measurements in a healthy volunteer yielded a sodium concentration for the different motion states (all projections, inhaled, exhaled) between (72.6±20.8)mmol/L and (78.3±18.7)mmol/L for the left and (98.7±24.5)mmol/L and (101.8±30.7)mmol/L for the right kidney as shown in Tab.2.The B1+ and B1- corrections lead to a decrease in the standard deviation in both phantom and in-vivo measurements. In case of the phantom data, the corrections bring the determined concentration closer to the ground truth (see Tab.1). Motion sorted B1+ correction was shown to be feasible with the applied setup for 23Na MRI at 7T.
Discussion & Conclusion
Quantitative 23Na MRI of the kidney benefits from high magnetic field strengths B09, granting a higher SNR. The simulated receive-field map for the phantom was not considering the exact setup. This may lead to the inhomogeneous concentration map in the homogeneous phantom and an overestimated concluded concentration when only evaluating parts of the phantom as performed using the segmented rois from the in-vivo measurements in Tab.2. More precise simulation data could homogenize the phantom concentration map and improve this result.The human kidney contains different tissue types including cortex, medulla and renal pelvis10, therefore the here determined concentrations are average values for the combination of these tissue types. Registration of the 23Na images with high-resolution hydrogen images would help to segment the different tissue compartments, therefore enabling a more accurate determination of the sodium concentration of each individual tissue type. Nevertheless the mesasured 23Na concentrations are in good agreement with the literature measurements conducted at 3T11, ranging from (48.6±5.3)mmol/L to (108.0±10.9)mmol/L, depending on the physiologic condition and segmented tissue type.
Moreover, motion compensation could be beneficial in 23Na abdominal image reconstruction to reduce blurring and could be implemented in the future for more accurate quantitative measurements.
Acknowledgements
No acknowledgement found.References
1. Zöllner, F. G., Konstandin, S., Lommen, J., Budjan, J., Schoenberg, S. O., Schad, L. R., and Haneder, S. (2016) Quantitative sodium MRI of kidney. NMR Biomed., 29: 197– 205., https://doi.org/10.1002/nbm.3274.
2. Platt, T, Umathum, R, Fiedler, TM, et al. In vivo self‐gated 23Na MRI at 7 T using an oval‐shaped body resonator. Magn Reson Med. (2018); 80: 1005– 1019. https://doi.org/10.1002/mrm.27103
3. Nagel, A.M., Laun, F.B., Weber, M.‐A., Matthies, C., Semmler, W. and Schad, L.R. (2009), Sodium MRI using a density‐adapted 3D radial acquisition technique. Magn. Reson. Med., 62: 1565-1573. https://doi.org/10.1002/mrm.22157
4. Chan, R.W., Ramsay, E.A., Cunningham, C.H. and Plewes, D.B. (2009), Temporal stability of adaptive 3D radial MRI using multidimensional golden means. Magn. Reson. Med., 61: 354-363. https://doi.org/10.1002/mrm.21837
5. E.K. Insko, L. Bolinger, Mapping of the Radiofrequency Field, Journal of Magnetic Resonance, Series A, Volume 103, Issue 1, 1993,Pages 82-85, ISSN 1064-1858, https://doi.org/10.1006/jmra.1993.1133.
6. Lott, J, Platt, T, Niesporek, SC, et al. Corrections of myocardial tissue sodium concentration measurements in human cardiac 23Na MRI at 7 Tesla. Magn Reson Med. 2019; 82: 159– 173. https://doi.org/10.1002/mrm.27703
7. Christ A, Kainz W, Hahn EG, et al. The Virtual Family—development of surface-based anatomical models of two adults and two children for dosimetric simulations. Phys Med Biol. 2010;55:N23-N38.
8. Hasgall PA, Di Gennaro F, Baumgartner C, Neufeld E, Gosselin MC, Payne D, Klingenböck A, Kuster N. IT’IS database for thermal and electromagnetic parameters of biological tissues, Version 2.6, www.itis.ethz.ch/database.
9. Kraff, O., Fischer, A., Nagel, A.M., Mönninghoff, C. and Ladd, M.E. (2015), MRI at 7 tesla and above: Demonstrated and potential capabilities. J. Magn. Reson. Imaging, 41: 13-33. https://doi.org/10.1002/jmri.24573
10. Christopher J. Lote, (2012), Principles of Renal Physiology, Springer, New York, https://doi.org/10.1007/978-1-4614-3785-7
11. Haneder, Stefan and Konstandin, Simon and Morelli, John N. and Nagel, Armin M. and Zoellner, Frank G. and Schad, Lothar R. and Schoenberg, Stefan O. and Michaely, Henrik J., (2011), Quantitative and Qualitative 23Na MR Imaging of the Human Kidneys at 3 T: Before and after a Water Load, Radiology, 260, 3: 857-865, https://doi.org/10.1148/radiol.11102263
Figures
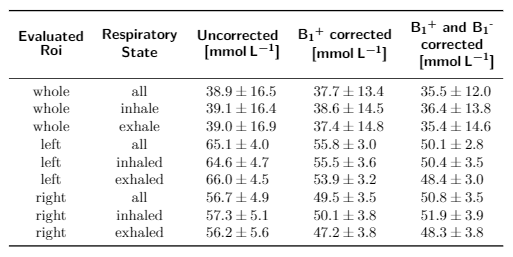
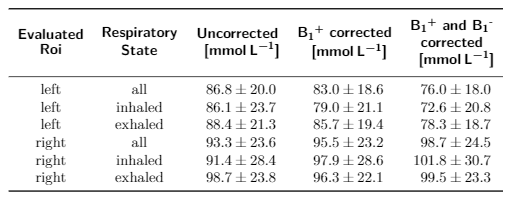
Tab. 2: Determined concentrations for the left and right kidney for the different respiratory states (not sorted, inhaled, exhaled) and in comparison for no correction, B1+ corrected and B1+ as well as B1- corrected data.