0237
First in vivo detection of carnosine using CEST1NeuroSpin, CEA, Gif-sur-Yvette, France, 2Paris-Saclay University, Saclay, France, 3Technical University of Munich, Munich, Germany
Synopsis
Accelerated CEST acquisitions using a linescan sequence coupled with an ultra-high magnetic field allows, for the first time, the detection of carnosine in vivo.
Introduction
Chemical Exchange Saturation Transfer (CEST) has demonstrated enhanced in vivo detection sensitivity for numerous metabolites including glutamate [1], glucose [2] and creatine [3]. In this study, we reveal, for the first time, the in vivo detection of carnosine using CEST-linescan MRI in the rat lower-leg muscle.Material and Methods
All measurements were performed on a 17.2T preclinical scanner (Bruker Biospin, Germany). The CEST acquisitions were performed using in-house developed pulse sequences. Specifically, we used either a zPREST [4] sequence or a CEST-linescan sequence. The CEST-linescan, developed according to [5], uses magnetic field gradients for spatial encoding during the saturation pulse and allows a dramatic reduction of the acquisition time needed for a complete Z-spectrum (16s vs 13min28s for zPREST). Direct detection and quantification of carnosine was performed using a LASER sequence [6].In vitro A 15mL Falcon tube was filled with 20mM solution of carnosine diluted in 0.01M PBS and adjusted to pH 7.0. The sample was maintained at (37 ± 1) °C during scanning.
In vivo Four male Dark Agouti rats (250-300g) were scanned under isoflurane anaesthesia and controlled physiological conditions using a pair of surface/volume coils (Rapid Biomedical, Germany). Anatomical images of the lower-leg muscle were acquired using a RARE sequence (TE/TR=8/2000ms, in plane resolution= 140x140 µm2, slice thickness=1 mm). CEST-linescan acquisitions were subsequently performed along a line parallel to the bone (Fig. 3A) with the following acquisition parameters: TE/TR=3/8000ms, slice/line thickness=3/1.8mm, resolution along the line=70 µm; CEST saturation module: 10 square pulses of 400ms and B1=1µT, 64 saturation offsets from -5 to 5ppm or from 0.8 to 4.3 ppm. 80 repetitions (pairs of lines with and without the saturation) were acquired to increase the SNR for a total acquisition time of 21m20s.
Data analysis To obtain the Z-spectra, CEST data were processed as follows:
-zPREST: For each saturation offset, the data was Fourier transformed, the integral of the water peak was computed and normalized by a reference signal at ẟ=10ppm.
-CEST-linescan: The ratio between the Fourier transforms of the signal acquired with and without saturation was plotted against the saturation offsets.
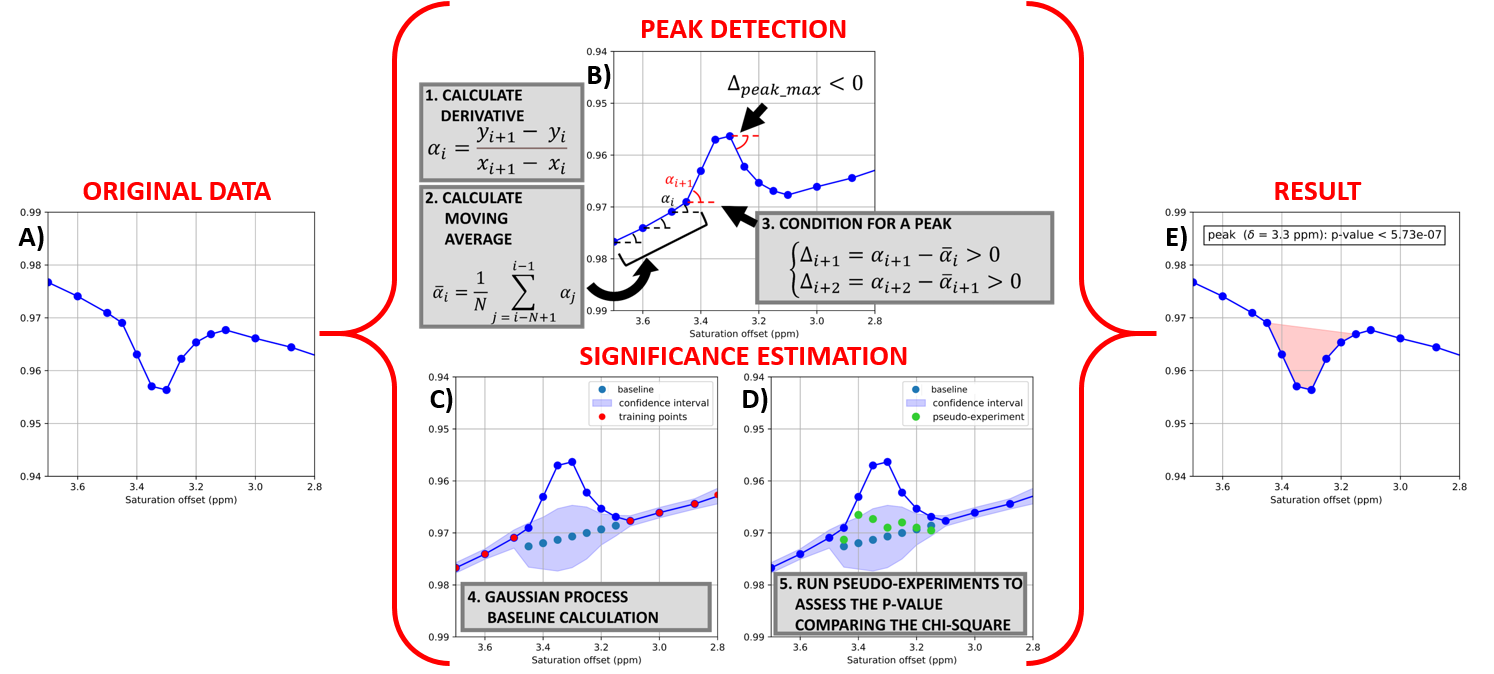
The peaks in any given Z-spectrum were automatically detected and the statistical significance calculated using an in-house built, Python based, algorithm whose principles are illustrated in Fig. 1. This algorithm also computes the carnosine peak amplitude with respect to the corresponding baseline (in %).
Results
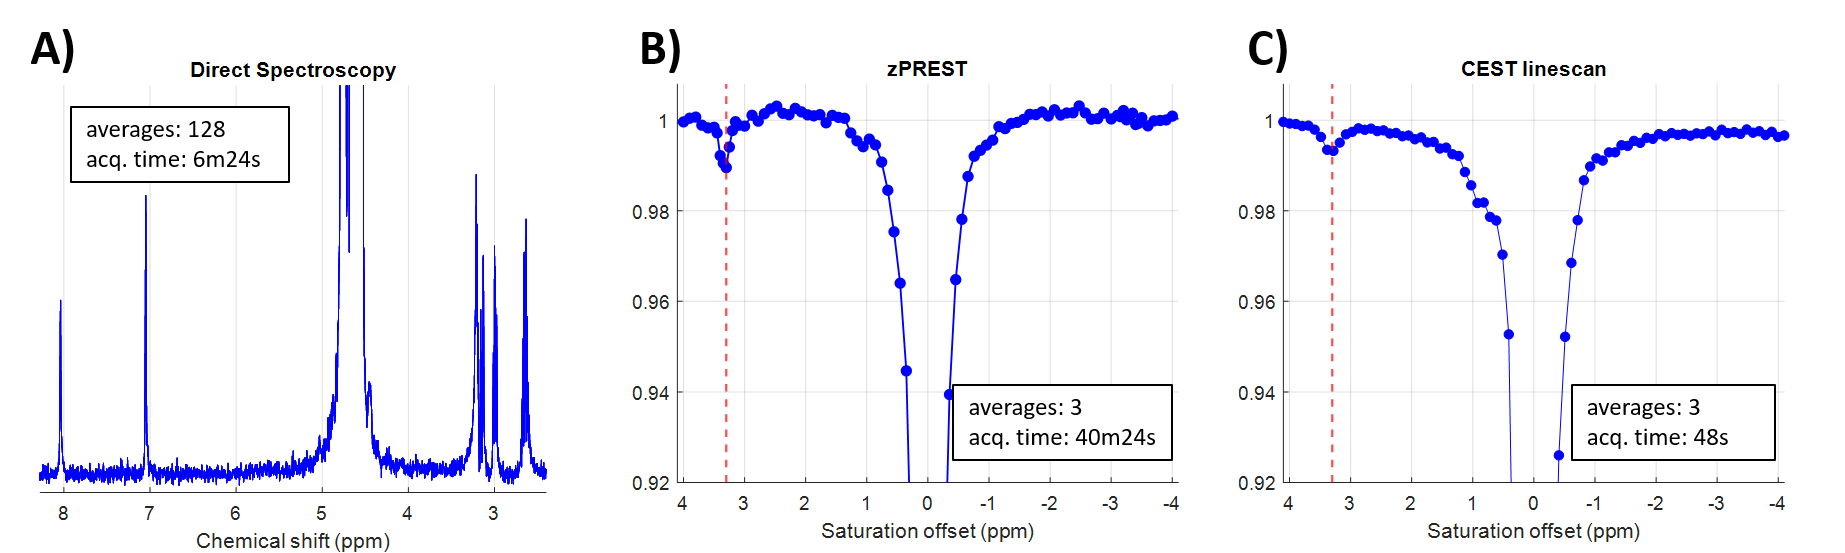
In vitroFigure 2 shows three different acquisitions performed on a 20 mM carnosine solution. Localized 1H NMR spectroscopy provides the signature of carnosine (Fig. 2A). The CEST acquisitions, zPREST (Fig. 2B) and CEST-linescan (Fig. 2C), show a small decrease in the water signal at approximately (3.30 ± 0.5) ppm (this is somewhat shifted from 3.1 ppm reported in [7], most likely due to the difference in pH). The CEST acquisitions were performed using a saturation power B1=1µT, which was experimentally found as being the optimal value for carnosine detection.
When comparing the SNR of the two CEST acquisitions we found similar values, 20.4 for CEST-linescan vs 22.6 for zPREST, both obtained for an acquisition time of 13min28s, which is the minimum necessary for a single average zPREST acquisition. However, given the much shorter time required for the acquisition of one single CEST linescan Z-spectrum, this sequence offers increased signal stability especially for in vivo acquisitions as a larger variability over time is expected (due to frequency drifts and other physiological noises).
In vivo
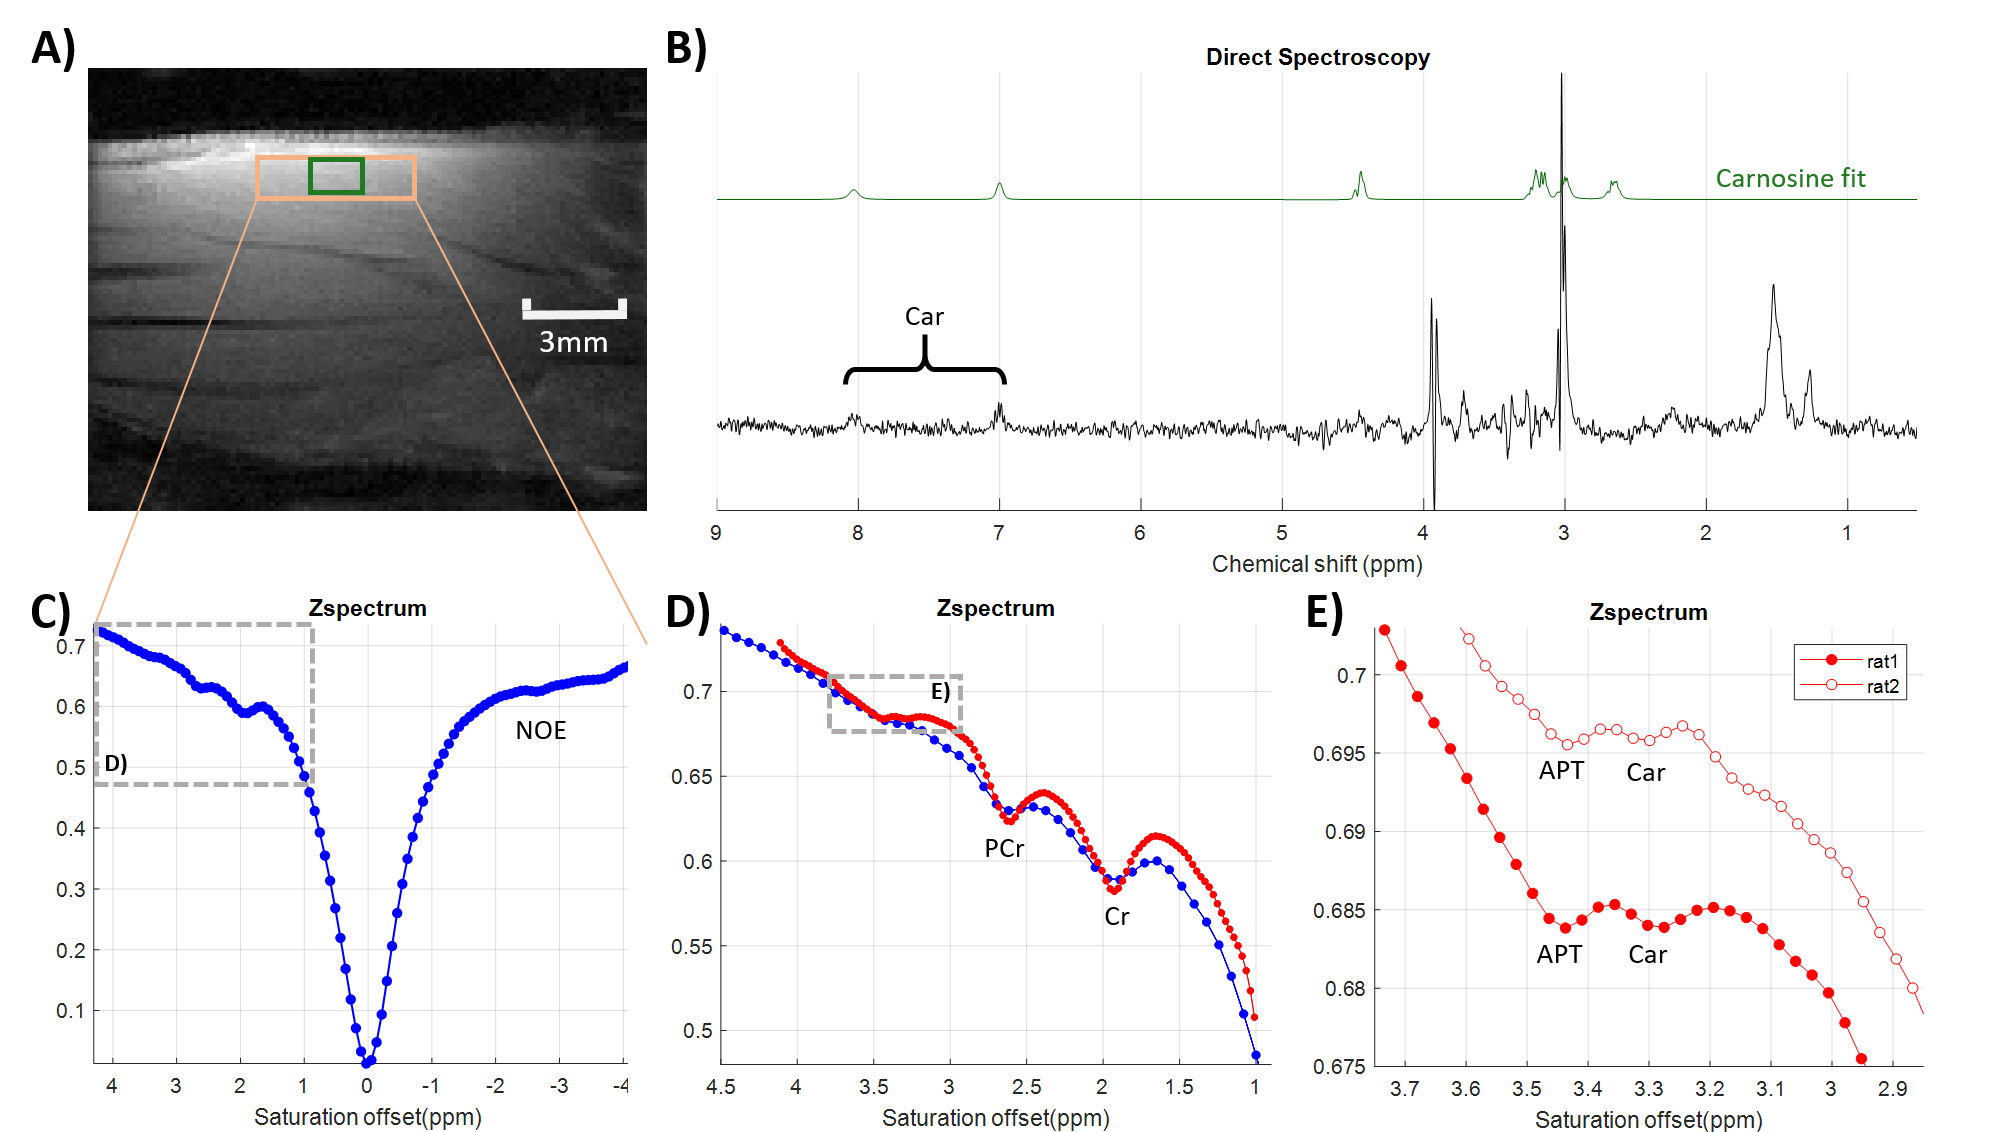
Figure 3 presents the in vivo rat leg muscle results obtained with the CEST-linescan approach (position depicted by the orange rectangle in Fig. 3A). On the full Z-spectrum (Fig. 3C), we recognize the peaks corresponding to NOE on the right, and creatine (Cr) and phosphocreatine (PCr) on the left [8]. By increasing the strength of the CEST saturation gradient, we obtain a higher resolution Z-spectrum (Fig. 3D) spanning a smaller frequency range. Here the Cr and PCr peaks are better defined and we detect two additional peaks corresponding to APT at (3.45 ± 0.05) ppm and carnosine (Car) at (3.30 ± 0.05) ppm (see also the zoom in Fig. 3E, the empty circles correspond to data from an additional animal). Similar results were obtained on all four animals with an average carnosine peak amplitude of (0.14 ± 0.06) %. 1H-MRS confirmed the presence of carnosine for all animals. Figure 3B shows the 1H spectrum obtained for rat 1 and acquired in the green voxel (Fig. 3A). From the decomposition of the 1H-MRS spectra using LCModel [9], we estimate an average (N=4 animals) Car concentration of (10 ± 2) mM considering a Cr+PCr concentration of 38 mM.
Discussion and Conclusion
Accelerated CEST acquisitions using a linescan sequence coupled with an ultra-high magnetic field allowed, for the first time, the detection of carnosine in vivo. While we present acquisition performed on a leg muscle, such studies can also be extended to the brain especially in areas with high carnosine concentration (e.g. the olfactory bulb). Indeed, carnosine is a molecule of interest since it is involved in antioxidant activities and has neuroprotective properties [10].Acknowledgements
This research was supported by a public grant overseen by the ANR and DFG under the project name BAMBOO. The authors thank Dr. C.I. Ciobanu for his help with data analysis and E. Selingue for managing the animal preparation and welfare.References
[1] K. Cai, M. Harris, A. Singh et al. Magnetic resonance imaging of glutamate, Nature Med, 18, 302-306, 2012.
[2] K. Chan, M. McMahon, Y. Kato et al. Natural D-glucose as a biodegradable MRI contrast agent for detecting cancer, Magn Reson Med, 68(6):1764-73, 2012.
[3] M.Harris, R. Nanga, A.Singh et al. Exchange rates of creatine kinase metabolites: feasibility of imaging creatine by chemical exchange saturation transfer MRI, NMR Biomed, 25(11):1305-9, 2012.
[4] T. Roussel, P. Svehla, D. Le Bihan et al. The origins of CEST contrast in ischemic tissue: effects of hypotonic stress on the nervous system of Aplysia californica, ISMRM, 2017.
[5] X. Xu, J-S. Lee and A. Jerschow. Ultrafast Scanning of Exchangeable Sites by NMR Spectroscopy Xiang, Angewandte Chemie, 125(32):8439-8442, 2013.
[6] M. Garwood, L. DelaBarre The return of the frequency sweep: designing adiabatic pulses for contemporary NMR. J Mag Reson, 153:155-177, 2001.
[7] O. Bodet, S. Goerke, N.Behl et al. Amide proton transfer of carnosine in aqueous solution studied in vitro by WEX and CEST experiments, NMR in Biomed, 28(9):1097-1103, 2015.
[8] K. Pavuluri, J. Rosenberg, S. Helsper et al. Amplified detection of phosphocreatine and creatine after supplementation using CEST MRI at high and ultrahigh fields, J Mag Reson, 313, 2020.
[9] S.W. Provencher. Estimation of metabolite concentrations from localized in vivo proton NMR spectra. Magn Reson Med, 30(6):672-9, 1993.
[10] S. Jain, E-S. Kim, D. Kim et al. Comparative Cerebroprotective Potential of D- and L-Carnosine Following Ischemic Stroke in Mice, Int J Mol Sci, 21(9):3053, 2020.
Figures