0236
Assessment of sensitivity, resolution, and quantification of Synomag-D labeled dendritic cells with magnetic particle imaging1Department of Medical Biophysics, University of Western Ontario, London, ON, Canada, 2Cellular and Molecular Imaging Group, Robarts Research Institute, London, ON, Canada, 3Department of Microbiology and Immunology, University of Western Ontario, London, ON, Canada, 4Biotherapeutics Research Laboratory, Robarts Research Institute, London, ON, Canada
Synopsis
The purpose of this study was to explore magnetic particle imaging (MPI), which directly detects superparamagnetic iron oxide nanoparticles (SPIOs) as a novel technique for tracking dendritic cells (DCs). DCs were labeled using Vivotrax, a commonly used MPI-SPIO, and Synomag-D, a tailored MPI-SPIO, with and without transfection agents. Vivotrax with TAs showed high levels of extracellular iron, overestimating iron content and cellular sensitivities. The use of TAs improved cellular sensitivity of Synomag-D to as few as 6k cells with 1min 2D images. Signal from 250k and 25k cells could be resolved at a distance of 2cm with 3D imaging.
Introduction
Immunotherapies are useful for treating cancer as an alternative to or in combination with traditional therapies1. Dendritic cell- (DC-based) therapies must migrate to lymphoid organs to be effective and the magnitude of the ensuing anti-tumour T cell response is proportional to the number of lymph node-migrated DC2. We have successfully detected and quantified DC migration to lymph nodes using both iron-based 1H MRI and perfluorocarbon-based 19F MRI; however, both have limitations3,4. Measuring signal loss from iron-labeled DC is at best semi-quantitative and other endogenous sources of low signal limits specificity. In contrast, 19F signal from PFC-labeled cells is specific, however, sensitivity is lower, requiring thousands of cells for detection. Magnetic Particle Imaging (MPI) is an alternative imaging modality capable of quantifying cell migration with high specificity. MPI directly detects the response of superparamagnetic iron oxide (SPIO) to a magnetic field and produces a signal that is linearly correlated with iron, allowing unambiguous imaging and quantification. A limitation of MPI is resolution, which is strongly related to the type of SPIO. The purpose of this study was to explore MPI for tracking DC migration by testing different SPIOs for cellular labeling and sensitivity.Methods
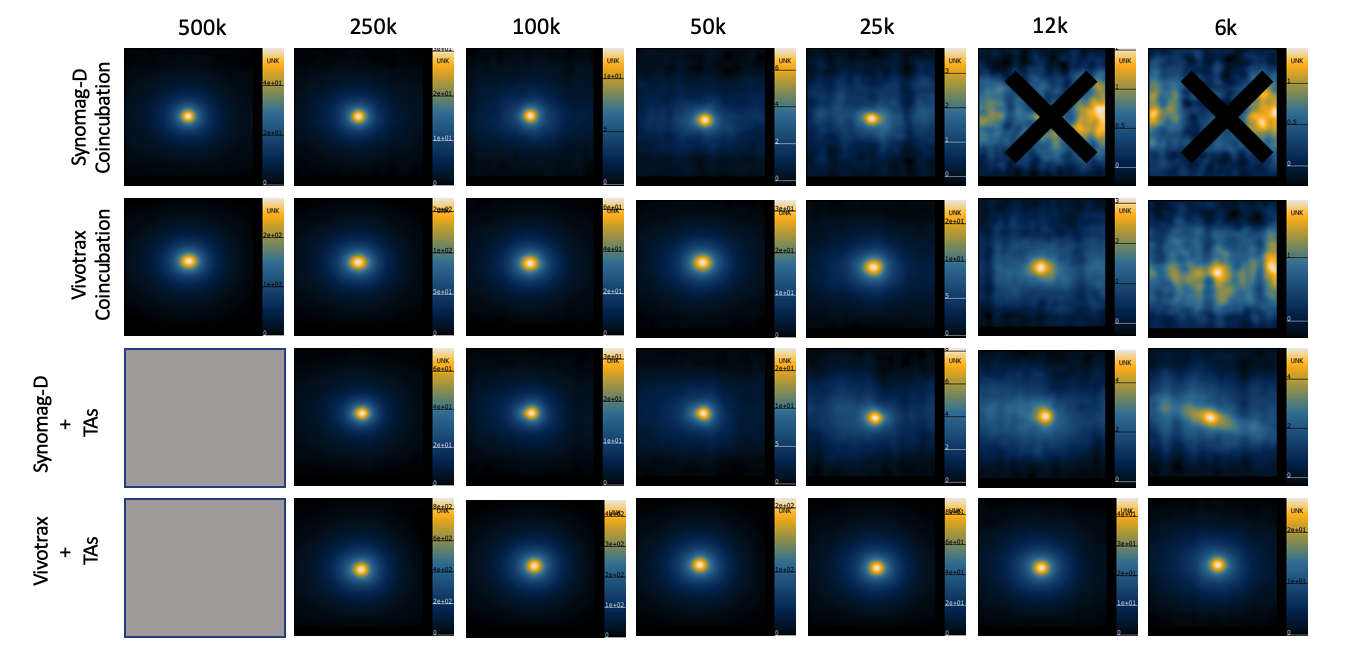
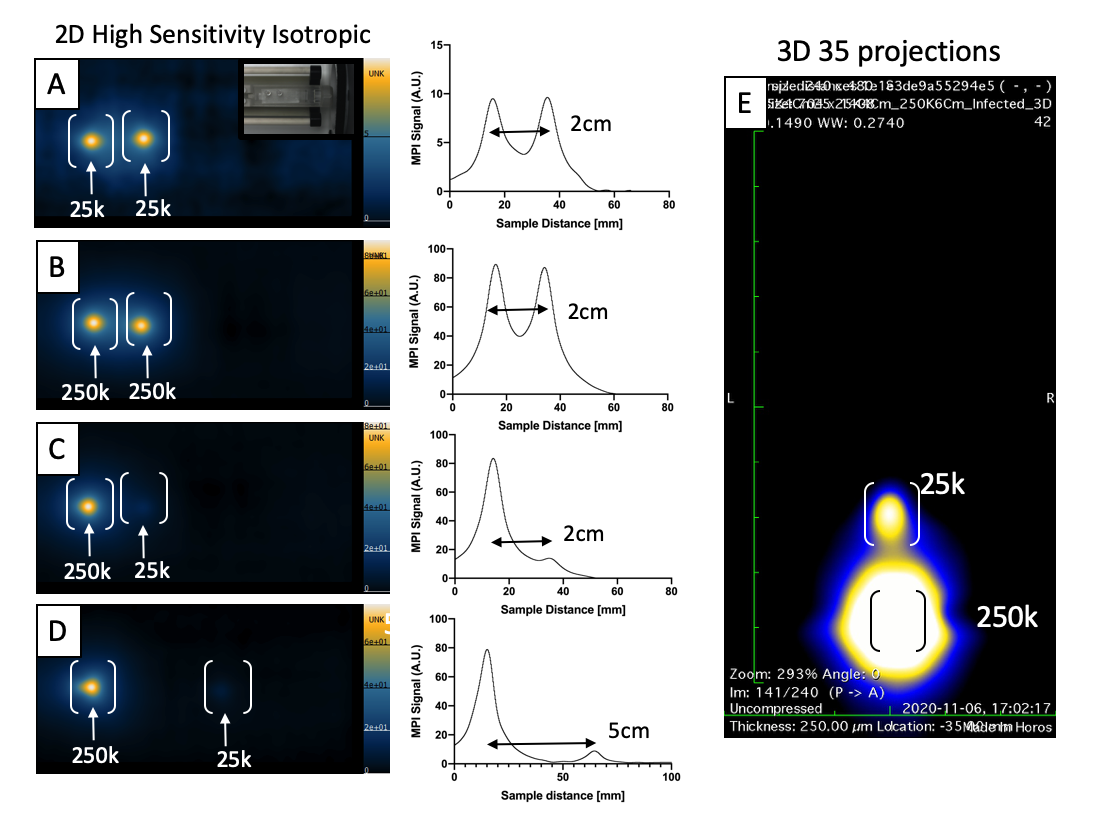
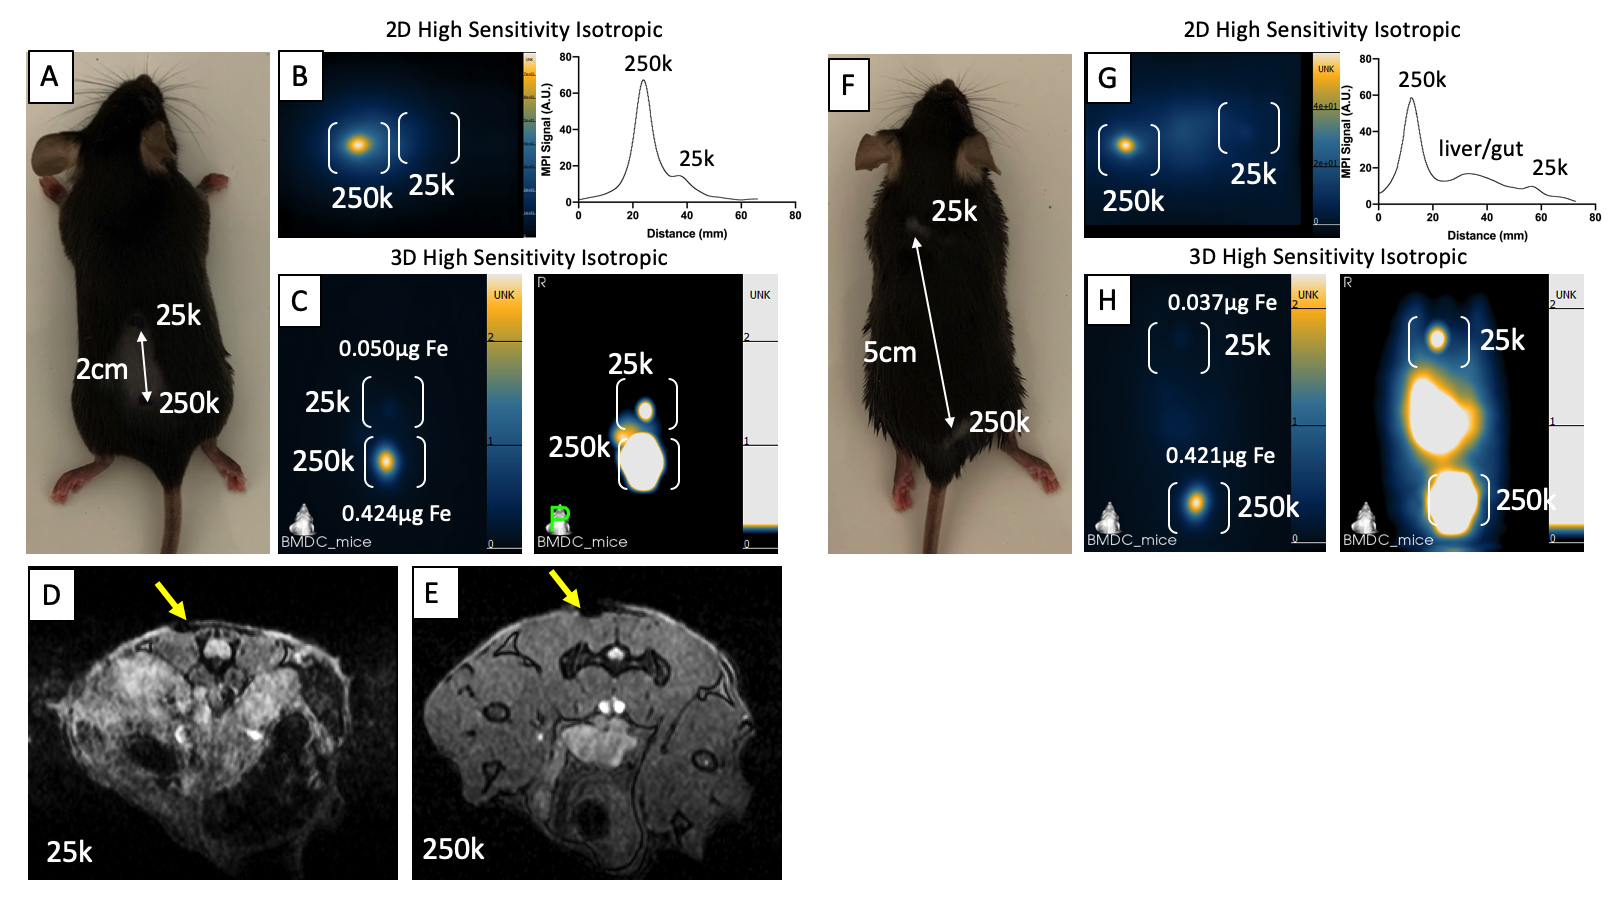
Two SPIO tracers were used to label DC: (1) Vivotrax™ (Magnetic Insight Inc., CA, USA), a bimodal particle (70% 5nm, 30% 25nm cores) and (2) Synomag-D (Micromod GmbH, Germany), ~30nm particle designed for MPI. DCs were labeled for 24 hours by co-incubation or using transfection agents (TA) to increase labeling efficiency5. Iron loading efficiency, phenotype and viability was assessed. Phantoms containing 500k, 250k, 100k, 50k, 25k, 12k, 6k, (k = thousand) iron+ DC were made in triplicate and underwent MPI on a Momentum™ scanner (Magnetic Insight Inc.) using 2D (1min) and 3D (20min) imaging. Iron quantification was estimated using calibration lines made from a 1:1 dilution series of each agent described previously6. Synomag-D labeled DCs were used for further experiments. To model DC migration, a 250k cell sample (high signal) was placed 2cm from a 25k cell sample (low signal) to resemble the distance and signal between injection sites and draining lymph nodes. The 25k cell sample was moved away from the 250k cell sample to determine the minimum distance at which two distinct signals could be resolved. Four C57BL/6 mice were injected subcutaneously with 25k and 250k cells spaced either 2cm (n=2) or 5cm (n=2) apart and imaged with 2D and 3D MPI. MRI was acquired 8 days after the cell injection at 3T.Results
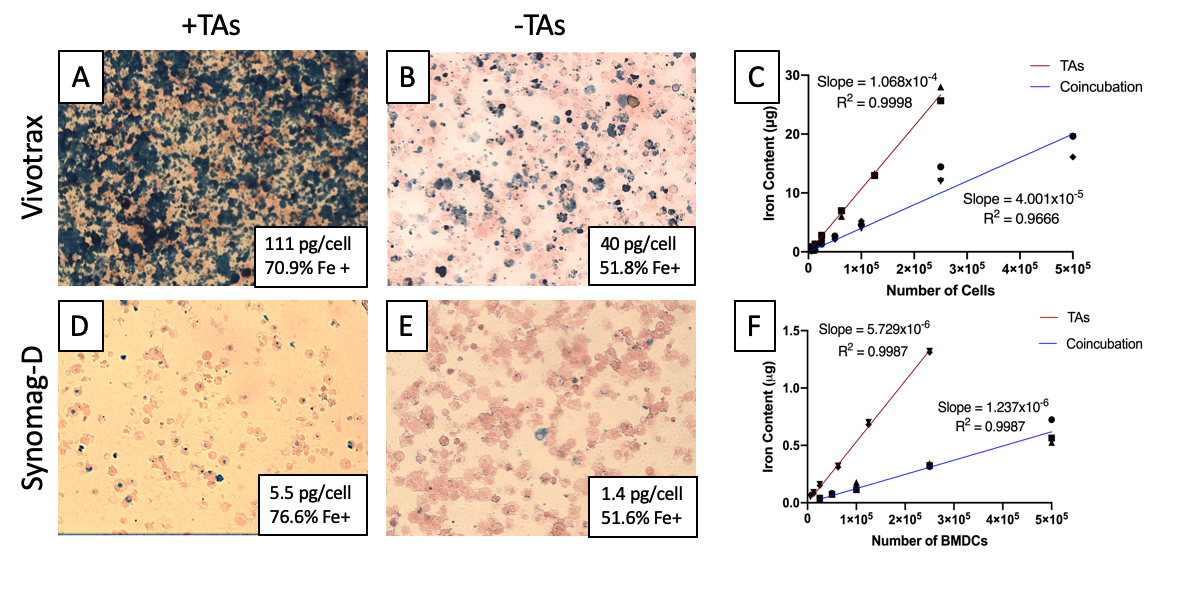
Perls Prussian Blue (PPB) of Vivotrax labeled DCs revealed extracellular iron and clumping of iron particles, which was pronounced with TAs (Figure 1A,B). This artificially increased iron content in cell samples (Figure 1C). DCs labeled with Synomag-D showed more realistic iron content. Labeling with TAs improved iron uptake by ~30% and labeling efficiency by 4x (Figure 1D-E), increasing sensitivity compared to no TAs (slope = 5.729x10⁻⁶ vs 1.237x10⁻⁶) (Figure 1F). For Synomag-D, as few as 25k cells were visible for labeling with co-incubation and 6k cells for labeling with TAs (Figure 2). Vivotrax cell detection limits were artificial.Samples with equal numbers of Synomag-D labeled DC can be clearly discerned when placed 2cm apart (Figure 3A-B) with corresponding signal intensity profiles showing two distinct peaks. When unequal samples are imaged together, the signal from fewer cells (less iron) was obscured by the signal from more cells (Figure 3C). To fully separate the signals from the unequal cell numbers, a minimum distance of 5cm was required (Figure 3D). Distinct signals are visible using 3D imaging (Figure 3E). Injections of 25k and 250k cells 2cm apart (Figure 4A) could not be resolved with 2D imaging (Figure 4B) but could with 3D imaging (Figure 4C). With injections 5cm apart (Figure 4F), signal from the lower source (25k) is partially hidden within signal from the liver/gut (Figure 4G). Three distinct signal regions were visible with 3D imaging (i) 250k cells, (ii) liver/gut, and (iii) 25k cells (Figure 4H). MRI showed a larger signal void for 250k cells than 25k cells separated by ~3cm (Figure 4D-E).
Discussion
An ideal SPIO for MPI will have good resolution, high sensitivity and good cell labeling properties. Vivotrax labeling of DC was inefficient with high levels of extracellular iron leading to largely overestimated iron content and cellular sensitivities. The use of TAs improved cellular sensitivity of Synomag-D DC to as few as 6k cells with 1 min 2D images, the lowest number we tested. This detection limit will improve with longer scans and/or 3D imaging. Signal from 250k and 25k cells could be resolved at a distance of 2cm with 3D imaging. Discriminating the MPI signal from two nearby sources of unequal signal is critical for our efforts to quantify the migration of DC since <10% of DC migrate from the injection site to lymph nodes.Conclusion
Here we describe the first study demonstrating MPI of Synomag-D labeled DCs. While MPI offers advantages of direct detection and quantification, optimizing the SPIO type, cell labeling and imaging parameters is fundamental for improving cellular sensitivity and resolution. These experiments motivate our future work which will use Synomag-D to track the fate of migrating DC in vivo.Acknowledgements
National Sciences and Engineering Research Council of Canada (NSERC)References
1. Sogn, J. A. Tumor Immunology: The Glass is Half Full. Immunity 9, 757–763 (1998).
2. de Vries, I. J. M. et al. Magnetic resonance tracking of dendritic cells in melanoma patients for monitoring of cellular therapy. Nature Biotechnology 23, 1407–1413 (2005).
3. Fink, C. et al. 19F-perfluorocarbon-labeled human peripheral blood mononuclear cells can be detected in vivo using clinical MRI parameters in a therapeutic cell setting. Sci Rep 8, 590 (2018).
4. Dekaban, G. A. et al. Tracking and evaluation of dendritic cell migration by cellular magnetic resonance imaging. WIREs Nanomedicine and Nanobiotechnology 5, 469–483 (2013).
5. Thu, M. S. et al. Self-assembling nanocomplexes by combining ferumoxytol, heparin and protamine for cell tracking by magnetic resonance imaging. Nature Medicine 18, 463–467 (2012).
6. Sehl, O., Makela, A., Hamilton, A. & Foster, P. Trimodal Cell Tracking In Vivo: Combining Iron- and Fluorine-Based Magnetic Resonance Imaging with Magnetic Particle Imaging to Monitor the Delivery of Mesenchymal Stem Cells and the Ensuing Inflammation. Tomography 5, 367–376 (2019).
7. Sehl, O. C., Gevaert, J. J., Melo, K. P., Knier, N. N. & Foster, P. J. A Perspective on Cell Tracking with Magnetic Particle Imaging. (2020) doi:10.20944/preprints202009.0720.v1.
Figures