0235
High-resolution 3D Phosphorus Metabolic Imaging of the Human Brain at 7T using SPICE1CMRR, Department of Radiology, University of Minnesota, Minneapolis, MN, United States, 2Beckman Institute for Advanced Science and Technology, University of Illinois at Urbana-Champaign, Urbana, IL, United States, 3Departments of Electrical and Computer Engineering, University of Illinois at Urbana-Champaign, Urbana, IL, United States
Synopsis
In vivo 31P MRS imaging (MRSI) is unique to study brain energy metabolism including ATPase and creatine kinase metabolic rates, and the NAD redox ratio especially at ultrahigh field (UHF) with significant improvements in detection sensitivity and spectral resolution. Nevertheless it is still challenging to achieve high spatial resolution even at UHF, owing to extremely low concentration of phosphorus metabolites. In this study, we employed the subspace‐based image reconstruction method called SPICE to largely reduce spectral noise and increase the signal-to-noise ratio (SNR) for achieving high-resolution 3D 31P MRSI covering the entire human brain at 7T.
Introduction
In vivo 31P MRSI is a promising imaging technique for noninvasively studying brain high phosphorus energy metabolism including measuring ATPase and creatine kinase metabolic rates1-3, NAD metabolism and redox ratio4,5 and phosphorus lipid metabolism. Its applications have been greatly challenged by the limited SNR, especially in the human brain owing to very low concentration of cerebral phosphorus metabolites. Ultrahigh field (UHF) systems provide unique opportunities for 31P MRSI with significantly increased signal-to-noise ratio (SNR) and improved spectral resolution6. However, it is still difficult to achieve high-resolution and high-fidelity 3D 31P MRSI covering the entire human brain even at UHF. The subspace-based imaging framework of SPICE has demonstrated advantages in denoising spectra using a subspace framework with pre-learned spectral basis. In this work, we present preliminary results of phosphorus metabolite maps on phantoms and of the human brain using 31P-MRSI at 7T and the SPICE technique for effective denoising.Methods
Signal model: In this study, the spatiotemporal functions of the 31P MRSI signals are represented using a subspace model, as: $$\rho(x,t)=\sum_{l=1}^L(c_l(x)\varphi_l(t)),$$where $$$\left\{\varphi_l(t)\right\},\left\{c_l(x)\right\},L$$$ denote the basis functions, corresponding spatial coefficients and the model order, respectively. This subspace model exploits the strong spatiotemporal correlation of the MRSI signals and the fact that the spatiotemporal distributions reside in a low-dimensional subspace7. This model can significantly reduce the number of degrees-of-freedom, thus enabling efficient denoising of 31P MRSI signals. The temporal basis functions used as spectral constraint were determined from a set of high-SNR training data8-10.Image reconstruction: with the pre-determined basis functions, the desired spatiotemporal functions were obtained by solving the following optimization problem: $$\left\{\hat{c}_l(x)\right\}=arg min_{\{c_l(x)\}}\parallel d(k,t)-\mathcal{F}\left(\sum^{L}_{l=1}c_l(x)\varphi_l(t)\right)\parallel_2^2+\mathcal{R}\left(\sum^{L}_{l=1}c_l(x)\varphi_l(t)\right)$$
where $$$d(k,t)$$$ is the measured MRSI data, $$$\mathcal{F}$$$ the Fourier operator and $$$\mathcal{R}$$$ the regularization operator. In this study, an edge-preserved regularization was applied using anatomical constraints derived from a proton structure image.
Experiments: 31P-MRSI experiments were performed on both phantom and healthy subjects on a 7T SIEMENS human scanner (Magnetom, Germany) with a dual-channel 31P-1H quadrature TEM head volume coil. To test the denoising effects brought by SPICE, CSI sequences were used on a phantom with 10mM ATP concentration. k-Space weighting was either performed uniformly or using the Siemens product CSI sequence. Two healthy subjects were scanned (see the acquisition parameters in figure captions). Shimming was performed over the whole brain volume on the 1H signal with a water linewidth at least below 30 Hz. Separate basis functions were applied for phantom and in vivo. Human scans were performed according to the approved protocol of the IRB of the University of Minnesota.
Results
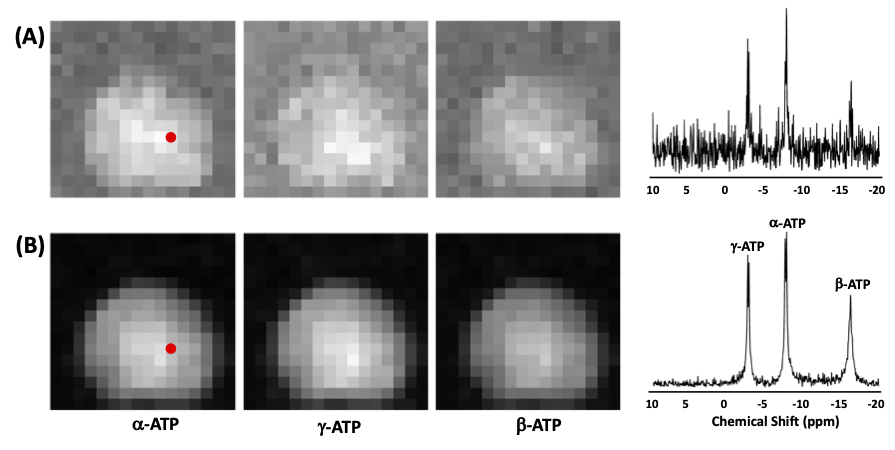
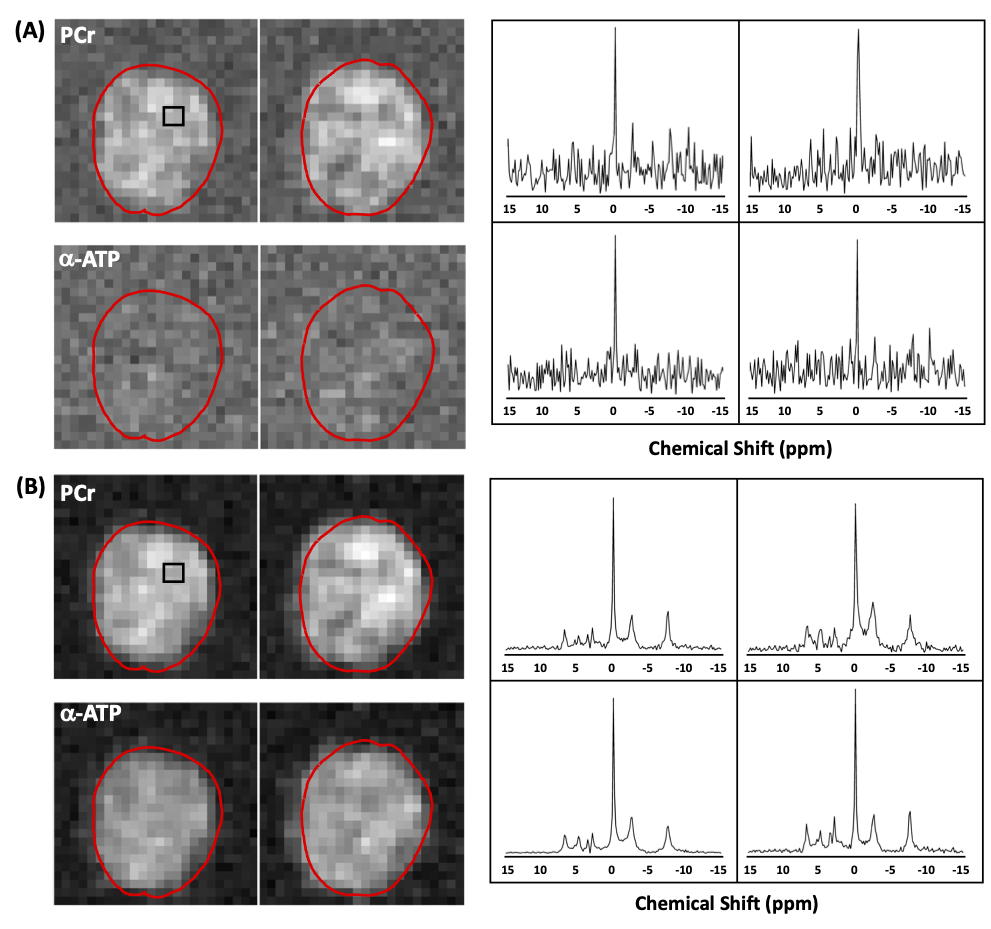
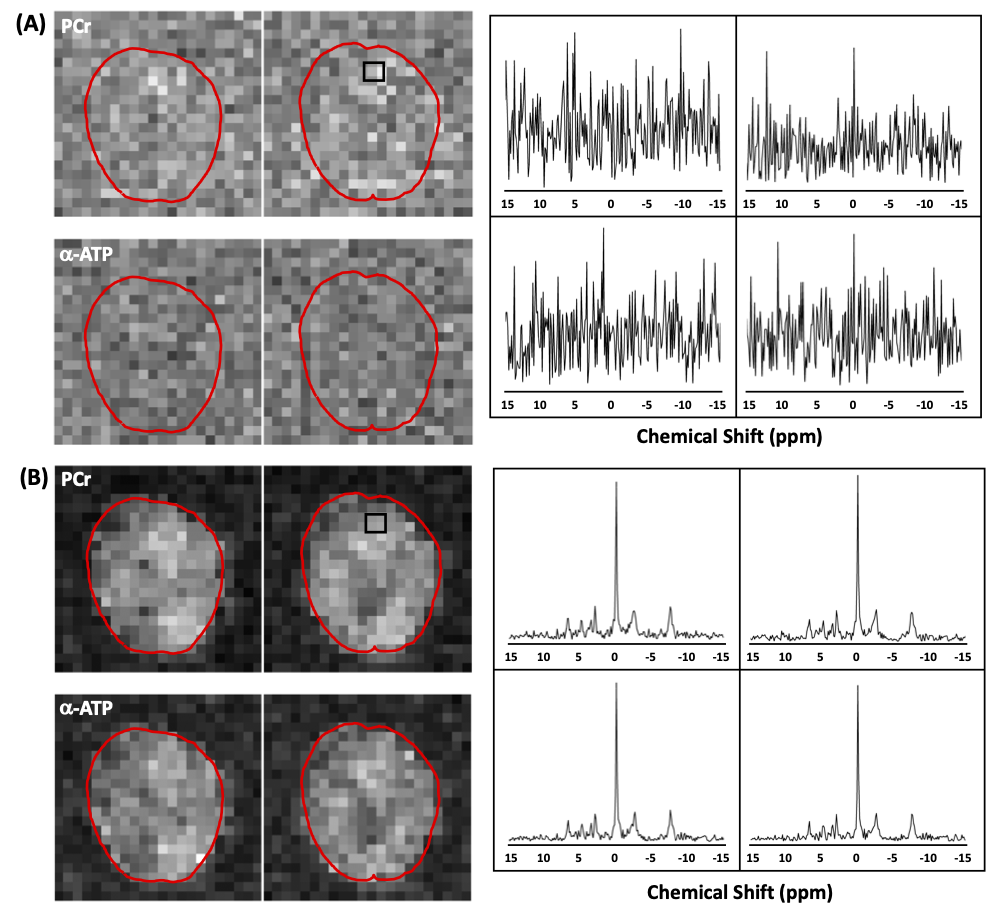
Figure 1 illustrates the phantom results, showing spatial distributions of γ-ATP, α-ATP and β-ATP resonances (strongest α-ATP and secondary γ-ATP) as expected from the sensitivity profile of the TEM volume coil as well representative voxel spectra before (Figure 1A) and after (Figure 1B) denoising using SPICE . It shows that SPICE could largely reduce the spectral noise and gain SNR for providing high-quality ATP maps.Figure 2 shows the 3D in vivo 31P MRSI results (only representative 2D maps were demonstrated) collected from human brain at 7T (with a nominal voxel size of 9.1×9.1×16 mm3 and k-space weighting) before and after the application of the SPICE denoising method. Although the PCr signal was visible inside the brain in the metabolite maps based on the conventional FT method, α-ATP was barely detected (Fig. 2A). In contrast, the metabolite maps as well as voxel spectra clearly show large improvements in spectral and map quality for both PCr and ATP signals (Fig. 2B). To further push the spatial resolution to the nominal voxel size of 10×10×10 mm3 (without k-space weighting), both PCr and α-ATP became invisible (Fig. 3A); again, the SPICE denoising method recovered the signals inside the brain with good SNR and high quality of spectra (Fig. 3B).
Discussion
We present the preliminary results from a pilot study for exploiting the utility of the SPICE denoising method for largely improving the performance of in vivo 31P MRSI for human brain application at 7T. The results clearly demonstrate the promise of SPICE reconstruction for effectively reducing measurement noise and revealing metabolite signals even when the data were acquired under sub-optimal condition. From a contrast perspective in the in vivo metabolic maps of PCr and γ-ATP anatomical details in the form of darker areas became apparent, which are likely the ventricles and similar in pattern to previous whole-head MRSI studies11.Conclusion
This work demonstrates that the combination of UHF 31P MRSI with the SPICE denoising method made possible high-resolution and high-quality cerebral phosphorus metabolic imaging of the entire human brain within a reasonable acquisition time. With further improvement, this technique can provide a powerful tool for studying brain energy metabolisms and NAD redox state and their spatial distributions under healthy and diseased state.Acknowledgements
This work was supported, in part, by the National Institutes of Health grant: U01 EB026978, R01CA24095, P41 EB027061 and P30 NS076408.References
1 Lei, H., Ugurbil, K. & Chen, W. Measurement of unidirectional Pi to ATP flux in human visual cortex at 7 T by using in vivo 31P magnetic resonance spectroscopy. Proc Natl Acad Sci U S A 100, 14409-14414 (2003).
2 Du, F. et al. Tightly coupled brain activity and cerebral ATP metabolic rate. Proc Natl Acad Sci U S A 105, 6409-6414 (2008).
3 Zhu, X. H., Lee, B. Y. & Chen, W. Functional energetic responses and individual variance of the human brain revealed by quantitative imaging of adenosine triphosphate production rates. J Cereb Blood Flow Metab 38, 959-972 (2018).
4 Lu, M., Zhu, X. H., Zhang, Y. & Chen, W. Intracellular redox state revealed by in vivo 31P MRS measurement of NAD+ and NADH contents in brains. Magn Reson Med 71, 1959-1972 (2014).
5 Zhu, X. H., Lu, M., Lee, B. Y., Ugurbil, K. & Chen, W. In vivo NAD assay reveals the intracellular NAD contents and redox state in healthy human brain and their age dependences. Proc Natl Acad Sci U S A 112, 2876-2881 (2015).
6 Lu, M., Chen, W. & Zhu, X. H. Field dependence study of in vivo brain 31P MRS up to 16.4 T. NMR Biomed 27, 1135-1141 (2014).
7 Liang ZP. Spatiotemporal imaging with partially separable functions. Proc IEEE Int Symp Biomed Imaging. 988–991 (2007).
8 Lam F, Liang ZP. A subspace approach to high‐resolution spectroscopic imaging. Magn Reson Med. 71:1349-1357 (2014).
9 Lam F, Li Y, Guo R, et al. Ultrafast magnetic resonance spectroscopic imaging using SPICE with learned subspaces. Magn Reson Med. 83:377-390 (2020).
10 Li Y, Lam F, Clifford B, Liang ZP. A subspace approach to spectral quantification for MR spectroscopic imaging. IEEE Trans Biomed Eng. 64:2486-2489 (2017).
11 Brown R, Lakshmanan K, Madelin G, Parasoglou. A nested phosphorus and proton coil array for brain magnetic resonance imaging and spectroscopy. NeuroImage. 124:602-611 (2016).
Figures