0233
Hyperpolarized [2-13C]Pyruvate Molecular Imaging with Whole Brain Coverage1Department of Radiology and Biomedical Imaging, University of California, San Francisco, CA, United States, 2ISOTEC Stable Isotope Division, MilliporeSigma, Merck KGaA, Miamisburg, OH, United States, 3Department of Neurological Surgery, University of California, San Francisco, CA, United States
Synopsis
Hyperpolarized (HP) [2-13C]pyruvate MRI has great clinical potential for monitoring pyruvate-to-glutamate conversions through the TCA cycle in addition to pyruvate-to-lactate glycolytic metabolism. This new method for human molecular imaging has enabled whole brain acquisitions with sufficient signal-to-noise. Using a specialized multi-slice EPI sequence, volumetric, dynamic images of HP [2-13C]pyruvate and its downstream metabolites [5-13C]glutamate and [2-13C]lactate were acquired from healthy brain volunteers. The downfield and upfield lactate signals were acquired separately with no artifacts arising from J-coupling were observed. This work demonstrated the capability of volumetric and dynamic [2-13C]pyruvate EPI to interrogate both glycolytic and oxidative cerebral energy metabolism simultaneously.
Introduction
Hyperpolarized (HP) [1-13C]pyruvate is the most widely utilized molecular contrast agent for MR metabolic imaging to characterize abnormal metabolism in patients with tumors, based on the measured glycolytic metabolism of [1-13C]pyruvate-to-[1-13C]lactate conversion upregulated in tumors.1 The application of [1- 13C]pyruvate, however, is limited for assessing the flux of pyruvate to TCA cycle only through pyruvate dehydrogenase (PDH) because the 13C label is lost as CO2 during the conversion to Acetyl-CoA. Alternatively, labeling the C2 position of pyruvate provides access to the TCA cycle as the labeled carbon is carried over to acetyl-CoA and eventually to the glutamate pool, but is more difficult to image because of a shorter T1, a less sparse spectrum, and peak-splitting due to JCH coupling. The safety and feasibility of using HP [2-13C]pyruvate for measuring its conversion to [2-13C]lactate and [5-13C]glutamate in the brain of healthy volunteers was previously demonstrated with non-localized dynamic 13C MR spectroscopy.2 In this work, multi-slice, dynamic HP [2-13C]pyruvate echo-planar imaging (EPI) was developed and applied in healthy volunteer studies with whole brain coverage to investigate its application for human brain studies using HP [2-13C]pyruvate.Methods
Following phantom testing, HP [2-13C]pyruvate metabolic data of the brain were acquired from healthy volunteers (N = 5) using a 2D multi-slice EPI sequence,3 following the injection of 241 ± 7 mM [2- 13C]pyruvate hyperpolarized for ~ 3hrs in a 5T GE SPINlab at 0.8 K. The pulse sequence consisted of a single-band spectral-spatial RF pulse that was sequentially applied to the resonance frequencies of [2- 13C]pyruvate, [5-13C]glutamate, and downfield and upfield peaks of [2-13C]lactate doublet with 20°, 60°, 60, and 60° flip angles, respectively. The images of downfield and upfield lactate signals were acquired separately to avoid artifacts due to J-coupling.4 A multi-resolution approach was applied, yielding an in- plane spatial resolution of 7.5 x 7.5 mm2 for pyruvate and 22.5 x 22.5 mm2 for glutamate and lactate, for 5 slices with 3 cm thickness.5 Twenty timeframes were acquired per metabolite with a 3 s temporal resolution,yielding a total scan time of 60 s. All experiments were performed on a 3T clinical MR scanner using a 24-channel receiver (Rapid Biomedical, Germany) in combination with birdcage RF transmit coils. The acquired 13C data were denoised using a patch-based higher order singular value decomposition method.6 Voxel-wise calculations of kPG (apparent pyruvate-to-glutamate conversion rate) and kPL (apparent pyruvate-to-lactate conversion rate) were performed with two-site exchange models.7Results and Discussion
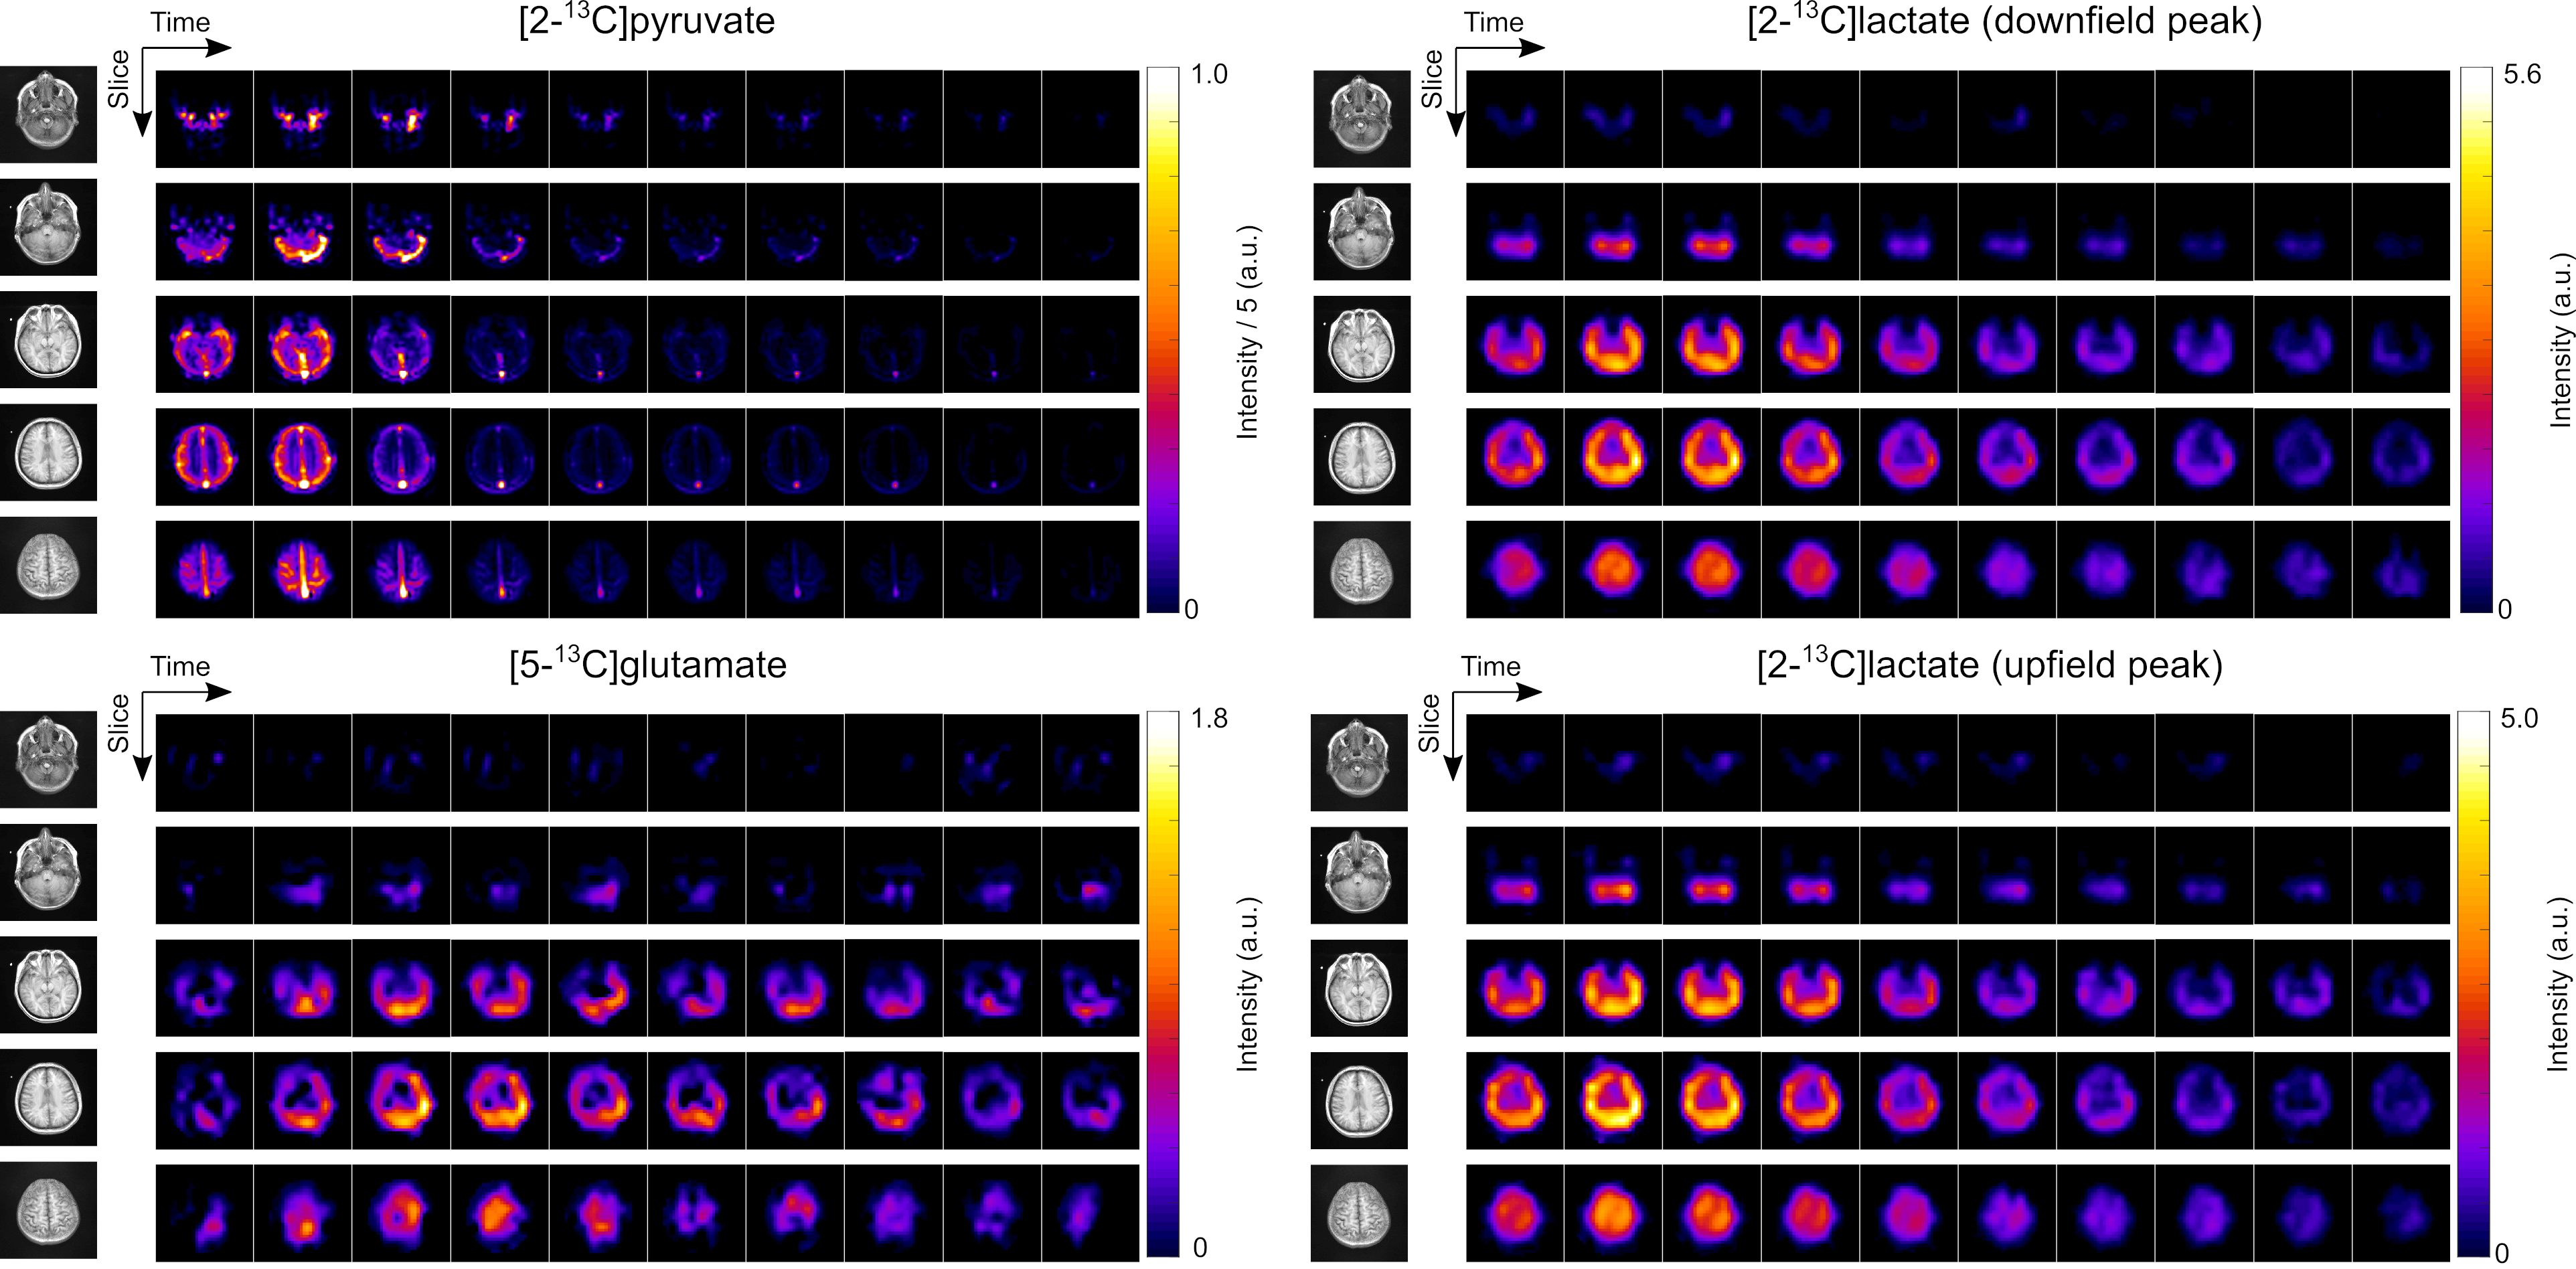
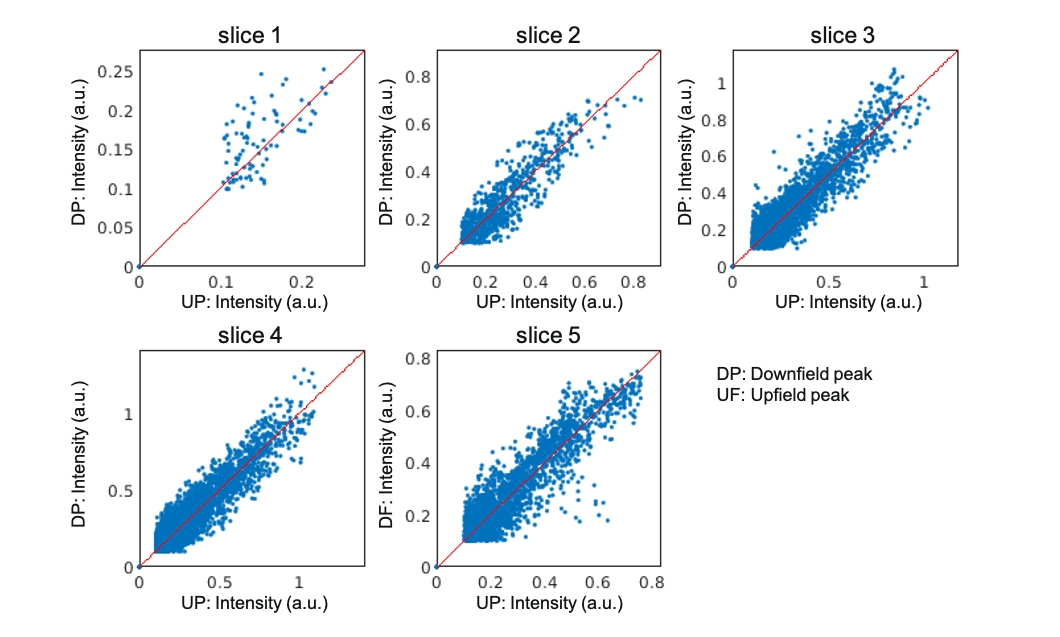
Figure 1 shows representative dynamic images of [2-13C]pyruvate, [5-13C]glutamate, and the upfield and downfield [2-13C]lactate signals from the brain of a healthy volunteer. The maximum apparent signal-to- noise ratio (SNR) in this dataset were 844, 32, 97, and 72 respectively for pyruvate, glutamate, and the downfield and upfield peak of lactate. The high-resolution pyruvate data acquired at 7.5 x 7.5 mm2 show strong signals from the arteries and veins, which were well separated from surrounding tissues. For glutamate and lactate, coarser resolution of 22.5 x 22.5 mm2 achieved high SNR to allow confidence in signal quantification. The lactate distribution was similar between the images of downfield and upfield signals, and no artifacts arising from J-coupling were observed.In Figure 2, signal intensities of downfield and upfield lactate images were compared on a voxelwise basis for each slice. Overall, it showed good agreement between the two resonances, which demonstrated the feasibility of acquiring two peaks of lactate doublet separately. Thus, the total lactate signals can be obtained by combining the downfield and upfield lactate images without any correction, improving the lacate SNR for quantification.
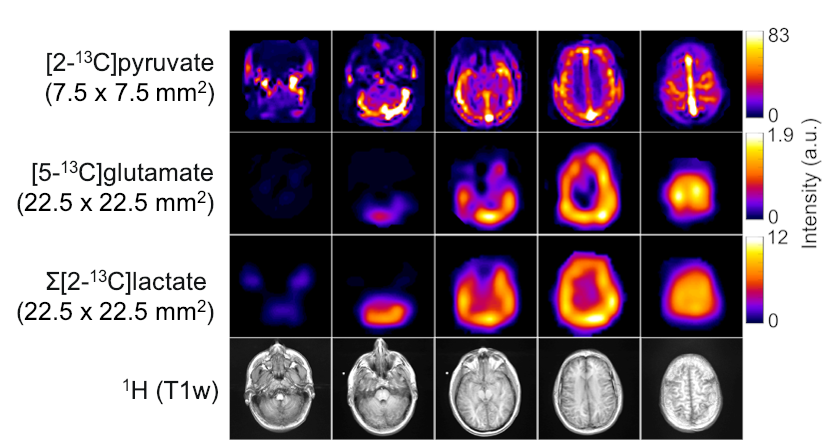
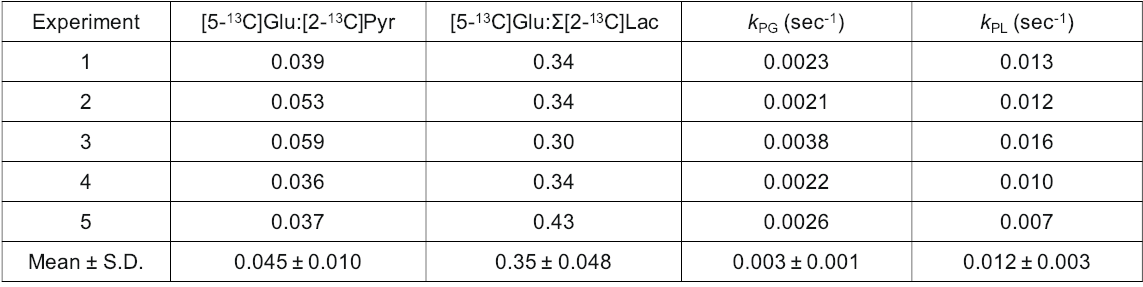
Figure 3 displays representative 13C sum-over-time (AUC) images of pyruvate, glutamate, and lactate from another volunteer. The lactate AUC images represent the sum of the downfield and upfield lactate signal intensities. The metabolite ratios of [5-13C]glutamate to [2-13C]pyruvate ([5-13C]Glu:[2-13C]Pyr) and [5- 13C]glutamate to Σ[2-13C]lactate ([5-13C]Glu: Σ[2-13C]Lac) for the whole brain were calculated from the AUC images. The averaged values for [5-13C]Glu:[2-13C]Pyr and [5-13C]Glu: Σ[2-13C]Lac from 5 datasets were found to be 0.045 ± 0.010 and 0.35 ± 0.048, respectively. Also, the average kPG and kPL values were determined as 0.003 ± 0.001 and 0.012 ± 0.003 s-1, respectively. Figure 4 summarizes the measured metabolic ratios, kPL, and kPB values obtained from each dataset. ROI-based quantification of metabolic conversion and the assessment of its accuracy is currently being investigated. The capability of assessing both pyruvate-to-lactate and pyruvate-to-glutamate conversion with spatial resolution indicates a potential for using HP [2-13C]pyruvate to investigate cerebral energy metabolism and characterize brain tumors with isocitrate dehydrogenase (IDH) mutations.8
Conclusion
This work demonstrates the feasibility of volumetric and dynamic EPI of HP [2-13C]pyruvate metabolism to [5-13C]glutamate and to [2-13C]lactate in the human brain probing glycolytic and oxidative metabolism simultaneously. The strategy of separately exciting the two peaks of the lactate doublet was shown feasible for imaging metabolites with signal splitting. In combination with a variable resolution approach, the hyperpolarized metabolite signals were utilized for quantifying kPL and kPB throughout the brain of healthy volunteers providing new measures of cerebral energy metabolism.Acknowledgements
This work was supported by NIH grants P41EB0135898, P01CA118816, U01EB026412, and the UCSF NICO project.References
1. Wang ZJ, Ohliger MA, Larson PEZ, et al. Hyperpolarized 13C MRI: State of the Art and Future Directions. Radiology 2019;291:273–284.
2. Chung BT, Chen H-Y, Gordon J, et al. First hyperpolarized [2-13C]pyruvate MR studies of human brain metabolism. Journal of Magnetic Resonance 2019;309:106617.
3. Gordon JW, Chen H, Autry A, et al. Translation of Carbon-13 EPI for hyperpolarized MR molecular imaging of prostate and brain cancer patients. Magn. Reson. Med. 2019;81:2702–2709.
4. Datta K, Spielman D. MRI of [2-13C]Lactate without J-coupling artifacts. Magn. Reson. Med. 2021;85:1522–1539.
5. Gordon JW, Autry AW, Tang S, et al. A variable resolution approach for improved acquisition of hyperpolarized 13C metabolic MRI. Magn Reson Med 2020;84:2943–2952.
6. Zhang X, Peng J, Xu M, et al. Denoise diffusion-weighted images using higher-order singular value decomposition. NeuroImage 2017;156:128–145.
7. Larson PEZ, Chen H-Y, Gordon JW, et al. Investigation of analysis methods for hyperpolarized 13C- pyruvate metabolic MRI in prostate cancer patients: Hyperpolarized Pyruvate Prostate Cancer Analysis Methods. NMR in Biomedicine 2018;31:e3997.
8. Izquierdo-Garcia JL, Viswanath P, Eriksson P, et al. IDH1 Mutation Induces Reprogramming of Pyruvate Metabolism. Cancer Research 2015;75:2999–3009.
Figures